
7 Best Methods to Read Candlesticks
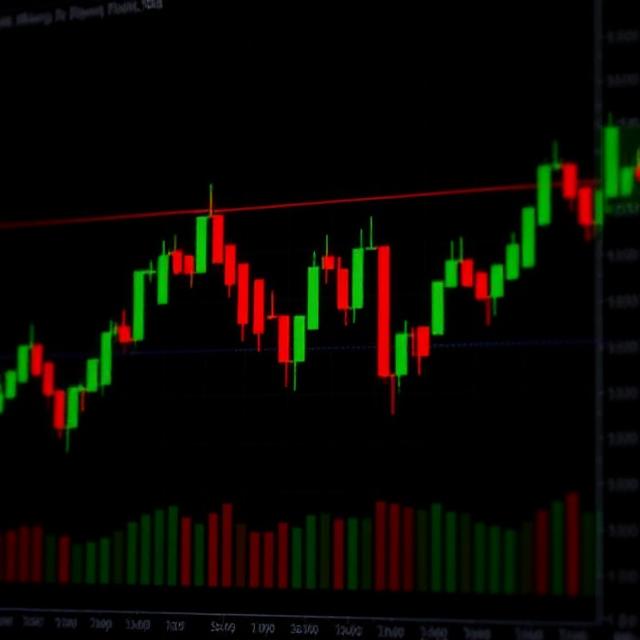
Candlestick charts offer a powerful way to visualize price movements in any financial market. These visual tools display the open, high, low, and close values for a specific time period. Each candlestick tells a story about market sentiment during that interval.
The history of this analytical approach dates back to 18th century Japan. Munehisa Homma, a famous rice trading expert, developed the earliest known system. His methods gained modern popularity when Steve Nison introduced them to Western audiences through his influential 1991 book.
Today, understanding candlestick formations is essential for traders seeking an edge. These patterns reveal crucial information about price action and potential market direction. Mastering their interpretation can significantly improve decision-making.
This guide explores effective techniques for analyzing these visual patterns. You'll learn to recognize key formations that signal opportunities. The skills covered apply across various trading timeframes and market conditions.
Key Takeaways
- Candlestick charts visually represent price movements using open, high, low, and close data
- This technical analysis method originated in 18th century Japanese rice trading
- Steve Nison popularized candlestick analysis in Western markets through his 1991 book
- Candlestick patterns provide insights into market sentiment and potential price direction
- Mastering these techniques helps traders make more informed decisions
- The methods work across different timeframes and market conditions
- Proper pattern recognition can enhance trading strategy effectiveness
Introduction to Candlestick Trading
From their origins in 18th century rice trading to contemporary financial markets, candlestick charts have maintained their analytical power. These visual tools represent a bridge between historical wisdom and modern technical analysis. Their enduring relevance speaks to their effectiveness in market interpretation.
?si=PUA0boge9Q-ff9nB">?si=PUA0boge9Q-ff9nB
The Rise of Candlestick Charts
Japanese rice merchant Munehisa Homma developed the earliest candlestick techniques in the 1700s. His methods focused on price movement visualization for rice trading. This innovative approach later influenced generations of traders.
In the early 20th century, Japanese chartist Sokyu Honma introduced these methods to Western audiences. This created a crucial connection between Eastern and Western trading philosophies. The methodology gained widespread recognition through Steve Nison's 1991 book.
How Technical Analysis Informs Trading
Candlestick patterns serve as essential components of modern technical analysis. They allow traders to interpret complex price information quickly. Just a few bars can reveal significant market insights.
This form of analysis helps identify trends, reversals, and market sentiment. Recognizing these patterns forms the foundation for informed trading decisions. The visual nature of candlestick charts makes complex data accessible.
Today, these patterns remain among the most popular technical analysis methods. Their application spans various market conditions and timeframes. This versatility contributes to their enduring value in financial analysis.
Understanding the Anatomy of a Candlestick
Understanding candlestick structure begins with recognizing the three fundamental parts that convey price information. Each candle tells a complete story about market activity during a specific period.
Body, Wick, and Shadow Explained
The rectangular body represents the core trading range. It shows the distance between the open and close prices for that timeframe.
Thin lines called wicks or shadows extend from the body. These indicate the high and low prices reached during the period.
Color provides immediate directional clues. Green or white candlestick bodies show price increases. Red or black bodies indicate decreases.
These three components work together to form complete candlestick patterns. Mastering this anatomy helps traders interpret market sentiment quickly.
Candlestick Chart Elements and Their Significance
Every candlestick pattern begins with four essential price points that define market activity. These components work together to create the visual representation traders analyze.
Open, High, Low, and Close
The opening price marks where trading begins for the period. It establishes the initial market sentiment. The high represents the maximum price reached during that timeframe.
The low indicates the minimum price achieved. The closing price shows where trading ends. These four data points create each candle's complete shape.
The relationship between open and close determines the body's size. The highs and lows form the upper and lower shadows. Together, they provide comprehensive trading information.
Color and Market Sentiment
Candlestick coloring serves as an immediate visual indicator. Green or white candle bodies signal bullish sentiment. This means buyers dominated and pushed prices higher.
Red or black bodies indicate bearish sentiment. Sellers controlled the market and drove prices lower. The strength of the color reflects conviction behind movements.
Understanding these color variations helps traders assess momentum quickly. Stronger colored bodies generally indicate more decisive market movements. This knowledge enhances pattern interpretation accuracy.
Basics of Technical Analysis for Traders
Technical analysis provides traders with essential tools for interpreting market behavior. This approach studies historical price movement to forecast future direction. Candlestick patterns represent one of the most popular components within this framework.
Professional traders use these methods to identify opportunities across various market conditions. The visual nature of candlestick patterns allows quick interpretation of complex data.
Understanding Market Trends
Markets typically follow three primary trend types. Uptrends show higher highs and higher lows, indicating bullish momentum. Downtrends feature lower highs and lower lows, signaling bearish control.
Sideways trends represent consolidation periods with limited direction. Identifying the current trend is crucial before applying candlestick patterns. Different formations signal varying opportunities depending on context.
While candlestick patterns excel at quick predictions, they work best alongside other technical analysis tools. Combining them with volume indicators and support levels enhances reliability. This comprehensive approach leads to more informed trading decisions.
Classic Bullish Reversal Patterns
Bullish reversal patterns provide crucial signals for identifying when selling pressure may be giving way to buying momentum. These formations appear during downtrend periods and suggest potential trend changes.
Hammer and Inverted Hammer Patterns
The hammer candlestick pattern forms at downtrend bottoms. It features a small body with a long lower shadow. This pattern indicates initial selling pressure followed by strong buying recovery.
The inverted hammer shows a long upper shadow instead. Both candle types signal potential reversal opportunities. They demonstrate buying selling dynamics shifting toward buyers.
Bullish Engulfing and Piercing Line
The bullish candle engulfing pattern occurs when a small red candle gets completely covered by a larger green one. This two-candle formation shows decisive buyer control.
The piercing line pattern features a significant gap down followed by strong recovery. Both candlestick patterns reliably signal reversal from downtrend to potential uptrend.
Recognizing Bearish Reversal Patterns
Bearish reversal patterns serve as critical indicators that upward trends may be exhausting and downward movements could follow. These formations alert traders to potential market tops and opportunities for protective strategies.
Shooting Star and Bearish Engulfing
The shooting star candlestick pattern forms during an uptrend with distinctive features. It shows a small lower body and a long upper shadow at least twice the body's length.
This formation typically gaps higher at opening, rallies to an intra-day high, then closes near the open. The pattern signals that buyers lost control after pushing prices higher.
The bearish engulfing pattern occurs when a small green candle gets completely covered by a subsequent long red candle. This demonstrates a decisive shift from buying to selling pressure.
Evening Star and Three Black Crows
The evening star is a three-candle formation featuring a short candle between a long green and long red candlestick. Research shows this pattern has approximately 69% success rate in predicting bearish reversals.
The three black crows pattern consists of three consecutive long red candles with minimal shadows. Each opens near the previous close and sells off significantly, indicating sustained selling pressure.
| Pattern Name | Formation | Key Characteristics | Reliability |
| Shooting Star | Single candle | Long upper shadow, small body, forms in uptrend | Moderate to High |
| Bearish Engulfing | Two candles | Small green candle engulfed by large red candle | High |
| Evening Star | Three candles | Short candle between long green and long red candles | 69% Success Rate |
| Three Black Crows | Three candles | Consecutive long red candles with minimal shadows | High |
Decoding Patterns of Market Indecision
Market indecision creates distinctive candlestick formations that signal potential trend changes. These patterns occur when neither buyers sellers establish clear control. Understanding these formations helps traders identify consolidation periods and potential reversals.
Doji and Spinning Top Patterns
The doji pattern forms when opening and closing prices are nearly identical. This creates a candle with a minimal or non-existent body. The resulting cross shape shows perfect equilibrium between market forces.
This formation indicates a struggle where neither side gains advantage. While neutral alone, the doji gains significance within larger reversal patterns. It often appears in both bullish and bearish reversal setups.
The spinning top features a small centered body with equal upper and lower shadows. This candle demonstrates that bulls pushed prices up while bears pushed them down. The result is minimal net price change.
Both formations signal indecision market conditions. They frequently appear after strong trends, suggesting momentum may be weakening. Traders watch for confirmation candles to determine which direction the market will ultimately take.
Recognizing these patterns helps avoid premature entries. The spinning top specifically indicates indecision during consolidation phases. Proper interpretation requires analyzing the broader market context.
Key Continuation Patterns in Candlestick Analysis
While reversal patterns grab attention, continuation formations offer equally vital insights into market dynamics. These candlestick patterns signal that an established trend is likely to persist after a brief pause. Recognizing them helps traders maintain profitable positions with greater confidence.
These formations represent a period consolidation within the larger market movement. They indicate that the current trend is simply taking a breath before continuing its journey. This distinguishes a temporary pause from a genuine trend reversal.
Falling and Rising Three Methods
The Falling Three Methods is a bearish continuation pattern. It appears during a downtrend. The formation starts with a long red candle, followed by three small green candles contained within its range.
The pattern concludes with another long red candle. This shows that sellers remain in control despite minor bullish attempts. The downtrend is expected to resume.
The Rising Three Methods is the bullish counterpart. It forms within an uptrend. This pattern consists of three short red candles sandwiched between two long green bullish candles.
It signals that buyers are still dominant, even with brief selling pressure. The uptrend is likely to continue its upward path after this consolidation.
| Pattern Name | Trend Context | Formation Structure | Market Message |
| Falling Three Methods | Established Downtrend | Long red, 3 small green (within range), long red | Sellers maintain control; downtrend continues |
| Rising Three Methods | Established Uptrend | Long green, 3 small red (within range), long green | Buyers retain control; uptrend continues |
Analyzing Support and Resistance with Candlesticks
Support and resistance levels provide crucial context that enhances candlestick pattern reliability. These technical zones represent areas where price has historically struggled to move beyond.
Candlestick Patterns at Key Price Levels
When candlestick patterns form at established support or resistance, their significance increases dramatically. A bullish reversal pattern at support suggests buyers are defending that price level.
Similarly, bearish formations at resistance indicate sellers are active. This convergence creates high-probability trading signals. Traders use these setups to identify optimal entry points.
The market often respects these critical zones. Understanding this relationship helps filter quality opportunities. It separates strong signals from random noise.
| Pattern Type | At Support Level | At Resistance Level | Signal Strength |
| Bullish Reversal | High Reliability | Low Reliability | Strong Buy Signal |
| Bearish Reversal | Low Reliability | High Reliability | Strong Sell Signal |
| Continuation | Moderate Reliability | Moderate Reliability | Trend Confirmation |
| Indecision | Watch for Breakout | Watch for Breakdown | Neutral Signal |
This approach helps manage risk effectively. Stop losses can be placed beyond these key levels. The combination creates a robust trading framework.
Integrating Candlestick Patterns into Trading Strategies
Effective trading strategies often combine multiple analytical approaches for superior results. While candlestick patterns provide excellent visual signals, they achieve maximum effectiveness when integrated with other technical analysis tools. This layered approach creates confirmation systems that filter out false signals.
Combining Patterns with Other Indicators
Traders benefit from using pattern recognition as initial signal generators. Moving averages help confirm trend direction, while volume indicators validate pattern strength. Momentum oscillators assess overbought or oversold conditions within the market.
Practical applications demonstrate this integration's value. A bullish engulfing pattern at support gains credibility when accompanied by moving average crossovers. Increasing volume during pattern formation adds further confirmation.
This comprehensive analysis approach recognizes that no single method is perfect. Combining complementary tools creates a robust framework for understanding price movement. Systematic processes help traders develop repeatable strategies that improve consistency over time.
When using any candlestick pattern, remember they work best alongside other forms of technical analysis to confirm the overall trend. This multi-indicator methodology separates high-probability setups from random market noise.
7 Best Methods to Read Candlesticks
Accurate pattern recognition stems from implementing structured evaluation methods. These systematic approaches help traders interpret candlestick formations with professional precision. Mastering these techniques transforms random observations into reliable trading signals.
Step-by-Step Techniques for Accurate Readings
Begin by thoroughly understanding candlestick anatomy. Analyze the relationship between body size, shadow length, and color. This foundation helps assess the strength behind each price movement.
Context analysis forms the second critical method. Evaluate patterns within broader market trends and key price levels. This approach ensures accurate interpretation of each formation's significance.
Pattern categorization helps identify specific signal types. Learn to distinguish between reversal, continuation, and indecision formations. Each category carries distinct predictive implications for market direction.
Confirmation techniques prevent premature entries. Wait for subsequent candles or supporting indicators to validate signals. This patience separates professional traders from impulsive beginners.
Volume correlation adds conviction to your analysis. Genuine patterns show strong participation through accompanying volume spikes. Weak formations often lack this confirming evidence.
Timeframe analysis provides additional confirmation. Examine patterns across multiple chart periods to ensure alignment. Consistent signals across timeframes increase trade probability.
The best way to learn involves practical application. Develop skills by entering and exiting trades based on candlestick signals. Consider starting with a risk-free demo account before progressing to live trading.
Advanced Pattern Recognition for Experienced Traders
Expert traders distinguish themselves through their ability to interpret sophisticated multi-candle configurations. This advanced skill goes beyond textbook definitions to recognize variations that carry significant predictive value. The pattern formed often reveals underlying market psychology.
Seasoned practitioners develop an intuitive sense for complex formations. They can identify when multiple candlestick patterns appear simultaneously across different timeframes. This level of recognition helps filter out false signals and identify genuine opportunities.
Advanced analysis involves assessing the quality of each pattern. Professionals evaluate factors like formation clarity and position within broader trends. Volume confirmation adds crucial validation to the setup.
| Assessment Factor | High Quality Pattern | Low Quality Pattern | Impact on Reliability |
| Formation Clarity | Clean, well-defined shapes | Fuzzy, ambiguous appearance | High impact on signal strength |
| Trend Position | Appears at logical reversal points | Forms randomly in trend middle | Critical for context validity |
| Volume Confirmation | Strong volume during formation | Weak or declining volume | Essential for conviction |
| Timeframe Alignment | Consistent across multiple periods | Contradictory signals | Important for confirmation |
The true mastery lies not in memorizing more formations, but in understanding what each pattern indicates about market participant behavior.
This advanced pattern recognition requires extensive chart time and experience. Each candlestick configuration that pattern formed under specific conditions builds intuitive knowledge. The resulting timing advantage translates directly to improved trading performance.
Tools and Platforms for Practicing Candlestick Reading
Modern trading platforms offer sophisticated tools for practicing pattern recognition without financial risk. These digital environments allow traders to develop essential skills using real market data. The transition from theory to practical application becomes seamless with proper tools.
Demo accounts provide risk-free learning spaces for beginners and experienced traders alike. Reputable brokers offer these simulated environments with real-time price feeds. Traders can practice identifying candlestick formations and executing trades based on their signals.
Demo Accounts and Simulation Software
Popular platforms like MetaTrader and TradingView feature extensive charting capabilities. These systems allow customization of candlestick displays and include pattern recognition tools. Historical data enables backtesting strategies across various market conditions.
Simulation software supports practice across multiple timeframes. Intraday charts show minute-by-minute price action for day trading analysis. Weekly charts reveal longer-term patterns that help understand broader market trends.
Many platforms automatically highlight common candlestick formations. This feature helps traders learn to spot patterns through repeated exposure. Consistent practice accelerates skill development for live trading situations.
Traders use these tools to test different approaches to candlestick reading. Experimentation with confirmation techniques and indicator combinations helps determine optimal strategies. This hands-on experience builds the visual recognition skills necessary for successful trading.
Case Studies: Real-World Applications of Candlestick Methods
Real-world trading examples bring candlestick analysis to life through practical application. These case studies demonstrate how pattern recognition works across various market conditions.
Examples from Current Market Trends
Recent day trading sessions show clear candlestick pattern effectiveness. A hammer formation appeared at support during last week's market dip. Traders who recognized this reversal signal captured significant gains.
Bullish engulfing candlestick patterns frequently precede upward price movements. One currency pair displayed this formation before a 3% rally. The pattern provided early entry confirmation.
Bearish signals also prove valuable for risk management. A shooting star pattern at resistance warned of coming price declines. This allowed position adjustments before the downtrend accelerated.
Not every formation delivers expected results. Some doji signals fail to produce meaningful reversals. This highlights the importance of confirmation from other indicators.
These practical examples show how candlestick patterns adapt to different trading environments. They work equally well in trending and range-bound markets when properly interpreted.
Enhancing Trading Strategies Through Candlestick Analysis
The integration of candlestick reading elevates investment decision-making through precise timing and clear visual signals. This approach provides traders with objective criteria that complement existing analytical methods.
Candlestick analysis improves entry timing by identifying specific price levels where probability favors new positions. Traders can enter trends early while managing risk with clearly defined stop-loss levels.
The systematic application of candlestick patterns reduces emotional decision-making. It provides objective visual signals that guide trading actions across all market conditions.
Enhanced trading strategies utilize candlestick methods as a universal language. This applies from short-term day trading to long-term position approaches.
Pattern clarity and confirmation levels help determine appropriate trade sizes. This advantage in position sizing leads to improved risk-adjusted returns.
Candlestick analysis works synergistically with fundamental approaches. Technical patterns help time entries and exits for positions based on fundamental convictions.
Ultimately, this centuries-old methodology leads to better-informed decisions. Traders gain visual clarity and timing precision that transforms their market participation.
Risk Management and Candlestick Pattern Limitations
Successful trading requires more than just pattern recognition—it demands disciplined risk management. While candlestick patterns provide valuable signals, they never guarantee future price movement. Every trader must implement proper capital protection strategies.
Stop-loss orders and careful position sizing form the foundation of responsible trading. These tools protect against unexpected market moves when a pattern occurs but fails to deliver expected results.
Using Patterns Responsibly
Candlestick patterns work probabilistically, not with certainty. Even high-quality formations can fail due to unexpected news or low liquidity. This reality requires disciplined risk control at all times.
False signals represent a significant limitation. Formations may suggest one outcome while markets move opposite. Single-candle patterns like the hanging man carry less reliability than multi-candle formations.
Traders should avoid forcing recognition where no clear pattern exists. Ignoring contradictory signals or risking excessive capital leads to poor outcomes. Responsible usage means acknowledging when conditions make analysis less reliable.
Understanding these limitations prevents overconfidence. Candlestick patterns remain valuable tools within comprehensive strategies. They provide insights but aren't infallible predictors of price movement.
Conclusion
Candlestick patterns serve as the visual language of market psychology and price dynamics. This comprehensive approach to technical analysis provides traders with a systematic framework for interpreting complex financial data.
Successful application requires understanding formation anatomy, recognizing context, and confirming signals with complementary tools. Consistent practice in demo environments builds the pattern recognition skills essential for effective trading decisions.
The journey of mastering candlestick interpretation never truly ends. Markets evolve, and so must our analytical approaches. Continuous learning and practical application remain the keys to sustained success.
This analysis methodology offers a timeless advantage in navigating financial markets. When combined with proper risk management, it becomes an indispensable component of any serious trader's toolkit.

0 Comments Comments