
Real Estate
The Brutal Housing Truth Nobody Wants to Hear About Payments

NAR (September 2026): median existing-home price $417,500, up 1.3% year over year (39th straight annual gain); sales pace 3.99 million, down 2.2% year over year; inventory 1.60 million, 4.8 months’ supply; median 33 days on market; first-time buyers 31%. Freddie Mac 30-year rate: 6.36% (May 14) to 7.40% (October 15, 2026). Census median household income 2025: $87,460; post-tax $76,060. My calculation: median home, 20% down, 7.40%: about $2,313 a month in principal and interest (31.7% of median pre-tax income); income needed at a 28% guideline about $99,100; price-to-income ratio 4.8. Lock-in (Realtor.com, Q1 2026): about 49.9% of outstanding mortgages at 4% or less; roughly 78% below 6%. Moving from a 3.5% loan to 7.40% adds about $813 a month (my calculation).
Here is the one I think matters most: the problem is no longer just the price of a house. It is the monthly payment, and the payment has been pushed up by a mortgage rate that reached 7.40% on October 15, up from 6.36% in May. At the same time, the people who already own homes are, for the most part, unwilling to sell. The market is stuck, and the people stuck in it are on both sides of every transaction.
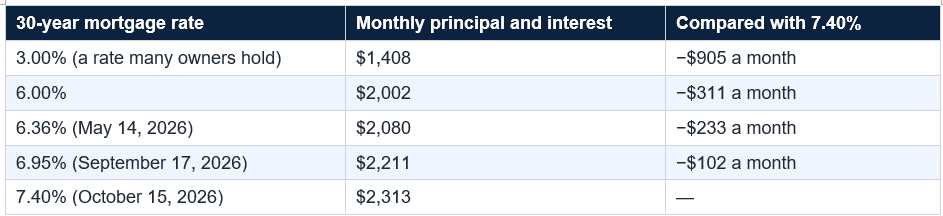
The rise since May alone adds about $230 a month, or roughly $2,800 a year, to the same loan. Said another way, to bring the payment back to May’s level at today’s 7.40% rate, the median home would have to cost about 10% less, roughly $375,600 instead of $417,500. That is what "affordability" means in practice: a rate move can do the work of a double-digit price change.
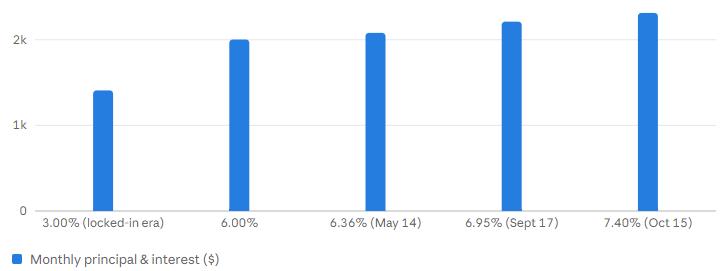
The numbers: Median price $417,500 (NAR, September 2026). With 20% down: 7.40% = about $2,313 a month; 6.36% = about $2,080; 3.00% = about $1,408. The rise from May’s rate adds roughly $2,800 a year. My calculation; principal and interest only.
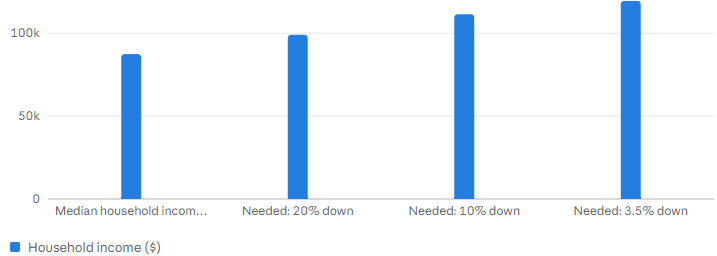
Using a common lending guideline that housing costs should stay near 28% of gross income, a household would need roughly $99,000 a year to afford that payment on the median home with 20% down. The median household earns less than that. And that is the optimistic case. With only 10% down, the payment rises to about $2,602 and the income needed to about $111,500. With 3.5% down, it is about $2,790 and $119,600. The price-to-income ratio, $417,500 divided by $87,460, is about 4.8.

The pressure is easing at the edges. Inventory reached 1.60 million homes, a 4.8-month supply, up from 4.5 months a year ago, and homes took a median of 33 days to sell, up from 31 in August. NAR Chief Economist Lawrence Yun said that higher borrowing costs mean fewer buyers can qualify, and that sellers need to be realistic about local conditions, which could require price discounts and incentives. One secondary source reported that 20.8% of listings had price cuts, the highest September share since 2018. These are signs of a market loosening slowly, not breaking.
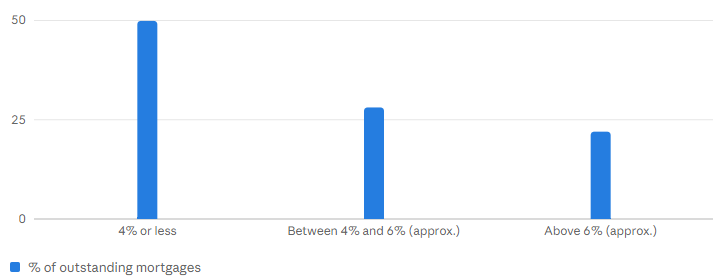
The math explains the reluctance. Take a $334,000 loan. Moving from a 3.5% mortgage to 7.40% adds about $813 a month, or $9,753 a year, by my calculation. Zillow estimated in April that giving up a sub-4% mortgage for 6.75% on the same median-priced home meant paying $3,900 to nearly $8,000 more a year, and the gap is wider at today’s rate. Owners are not being irrational. They are making a sensible financial choice that happens to starve the market of supply. About 49.9% of outstanding mortgages are at 4% or less; roughly 78% are below 6% (Realtor.com, Q1 2026). Moving from 3.5% to 7.40% on a $334,000 loan adds about $813 a month (my calculation).
That is my interpretation, not a forecast. And there is a second gamble in waiting: rates. The Federal Reserve raised its target range to 3.75%–4.00% in September, and the 10-year Treasury yield was around 5.24% in mid-October. A buyer who waits for lower rates is betting they arrive before prices rise further. If rates fall, demand returns and prices may rise with it. Waiting can work, but it is a trade-off with its own risk, not a free option.
But there is a catch. Renting builds no equity, and owning has historically been a forced-savings mechanism for many families. Renting only wins on wealth if you actually invest the difference, month after month, for years. For many people, the discipline is harder than it sounds. And over a long horizon, owning can still pay off through principal paydown and appreciation, which are not guaranteed. The honest answer is that it depends on how long you will stay, your local rent-to-price ratio and your own discipline.
If you are an owner, treat equity as paper wealth until you sell. If your rate is low, that is a real asset, so be cautious about trading it away without a strong reason. If you must sell, price to the local market, since NAR’s economist says sellers need to be realistic. If you are a renter, consider the discipline question: set up automatic investing of the difference, build your credit and keep a separate down-payment fund so you are ready when your numbers work.
None of that means you should give up or rush in. It means looking at the payment rather than the sticker price, matching your decision to how long you will stay, negotiating where the market allows and being honest about the real cost of both buying and renting. The market may loosen slowly, as inventory and days on market suggest. Until then, know your numbers, keep a cushion and decide from strength. A qualified housing or mortgage professional can help with your situation.
No one can say for certain. NAR reported a median existing-home price of $417,500 in September 2026, up 1.3% from a year earlier and the 39th straight annual gain. Sales are slow and inventory is rising, but about half of mortgages carry rates of 4% or less, which keeps many owners from selling. That tends to support prices even as sales fall.
How much income do I need to buy the median home?
At the September median price of $417,500, a 20% down payment and a 7.40% mortgage rate, principal and interest alone come to about $2,313 a month. Using a common guideline of keeping that payment near 28% of gross income, you would need about $99,000 a year, before property taxes, insurance and maintenance. The median household income in 2025 was $87,460.
What is the mortgage lock-in effect?
It is the reluctance of owners with low-rate mortgages to sell and take on a much higher rate. Realtor.com found that about 49.9% of outstanding mortgages carried rates of 4% or less in early 2026. Moving from a 3.5% loan to 7.40% on the same loan size would add roughly $813 a month in my calculation.
Is renting smarter than buying right now?
Often cheaper month to month. MarketWatch data reported in September 2026 found that in all 50 major US metro areas, renting costs less than buying. But renting builds no equity, so it only wins if you invest the difference. The right answer depends on how long you will stay and your local market.
Should I wait for mortgage rates to fall before buying?
Waiting is a bet on rates, and nobody can predict them reliably. The 30-year rate reached 7.40% on October 15, up from 6.36% in May, and the Fed raised rates in September. If you do buy, ask about price negotiation or seller credits, and plan for the possibility of refinancing later without counting on it.
Table of Contents
- The Truth Hiding in Plain Sight
- The Short Answer
- Truth One: The Payment Is the Price
- Truth Two: The Median Home Needs More Than the Median Income
- Truth Three: Prices Rise Even as Sales Collapse
- Truth Four: Sellers Are Trapped Too
- Truth Five: Waiting for a Crash Is a Gamble
- Truth Six: Renting Is Often Cheaper, With a Catch
- What Buyers, Owners and Renters Can Actually Do
- Questions to Ask Before You Sign
- Conclusion
- Frequently Asked Questions
Payment on the median home ($417,500, 20% down) at different rates ($/month)
Monthly P&I ($), before taxes and insurance by 30-year mortgage rate (Freddie Mac for 2026 dates)
Median household income vs. income needed to buy the median home ($)
Annual income ($) by At 7.40%, 28% of gross income on principal & interest (my calculation)
The lock-in effect: share of outstanding mortgages by rate (%, Q1 2026)
% of mortgages by Source: Realtor.com / FHFA National Mortgage Database
The Truth Hiding in Plain Sight
Everyone in housing has a reason to be optimistic. Sellers want to hear that prices are holding. Agents want to hear that spring is coming. Buyers want to hear that rates will fall and prices will drop at the same time. Everyone wants to promise relief. So the uncomfortable parts of the story tend to get skipped, even though they are sitting in the data for anyone to read.Here is the one I think matters most: the problem is no longer just the price of a house. It is the monthly payment, and the payment has been pushed up by a mortgage rate that reached 7.40% on October 15, up from 6.36% in May. At the same time, the people who already own homes are, for the most part, unwilling to sell. The market is stuck, and the people stuck in it are on both sides of every transaction.
The Short Answer
The brutal truth is that the typical home now needs more than the typical household earns, almost nobody with a cheap mortgage wants to sell, and neither fact is likely to change quickly. Prices are still inching up even as sales sit near the lowest levels in years, because fewer sellers means less supply, not more bargains. Waiting for a crash is a gamble, not a plan. The smart moves are less dramatic: understand the payment, not just the price, and match the decision to how long you will stay.Truth One: The Payment Is the Price
Most people talk about home prices. Most people live with home payments. NAR reported that the median existing-home price in September 2026 was $417,500. Put 20% down, borrow $334,000 and the payment depends entirely on the rate. At the 7.40% Freddie Mac reported on October 15, principal and interest come to about $2,313 a month, by my calculation. At May’s 6.36%, the same loan cost about $2,080. At the 3% rates many owners locked in, it would be about $1,408.The rise since May alone adds about $230 a month, or roughly $2,800 a year, to the same loan. Said another way, to bring the payment back to May’s level at today’s 7.40% rate, the median home would have to cost about 10% less, roughly $375,600 instead of $417,500. That is what "affordability" means in practice: a rate move can do the work of a double-digit price change.
The numbers: Median price $417,500 (NAR, September 2026). With 20% down: 7.40% = about $2,313 a month; 6.36% = about $2,080; 3.00% = about $1,408. The rise from May’s rate adds roughly $2,800 a year. My calculation; principal and interest only.
Truth Two: The Median Home Needs More Than the Median Income
The Census Bureau reported on September 17 that median household income hit a record $87,460 in 2025, up 2.6%. That is genuinely good news. But set it beside the payment. About $2,313 a month is $27,751 a year, or 31.7% of the median household’s pre-tax income, before property taxes, homeowners insurance or maintenance. Against median post-tax income of $76,060, it is about 36.5%.Using a common lending guideline that housing costs should stay near 28% of gross income, a household would need roughly $99,000 a year to afford that payment on the median home with 20% down. The median household earns less than that. And that is the optimistic case. With only 10% down, the payment rises to about $2,602 and the income needed to about $111,500. With 3.5% down, it is about $2,790 and $119,600. The price-to-income ratio, $417,500 divided by $87,460, is about 4.8.
Truth Three: Prices Rise Even as Sales Collapse
In a normal market, when sales slow sharply, prices soften. This one is different. NAR reported that existing-home sales ran at a 3.99 million annual pace in September, down 2.2% from a year earlier, with August and September the two slowest months of the year. Yet the median price rose 1.3% to $417,500, the 39th consecutive month of annual gains. Fewer transactions have not meant lower prices.The pressure is easing at the edges. Inventory reached 1.60 million homes, a 4.8-month supply, up from 4.5 months a year ago, and homes took a median of 33 days to sell, up from 31 in August. NAR Chief Economist Lawrence Yun said that higher borrowing costs mean fewer buyers can qualify, and that sellers need to be realistic about local conditions, which could require price discounts and incentives. One secondary source reported that 20.8% of listings had price cuts, the highest September share since 2018. These are signs of a market loosening slowly, not breaking.
Truth Four: Sellers Are Trapped Too
Here is why volume stays so low. Realtor.com’s analysis of FHFA data found that about 49.9% of outstanding mortgages carried rates of 4% or less in early 2026, and roughly 78% were below 6%. The share with sub-4% rates peaked at 65% in 2022 and has eroded only gradually. These owners are locked in. Selling means giving up a cheap loan and taking on one at 7.40%.The math explains the reluctance. Take a $334,000 loan. Moving from a 3.5% mortgage to 7.40% adds about $813 a month, or $9,753 a year, by my calculation. Zillow estimated in April that giving up a sub-4% mortgage for 6.75% on the same median-priced home meant paying $3,900 to nearly $8,000 more a year, and the gap is wider at today’s rate. Owners are not being irrational. They are making a sensible financial choice that happens to starve the market of supply. About 49.9% of outstanding mortgages are at 4% or less; roughly 78% are below 6% (Realtor.com, Q1 2026). Moving from 3.5% to 7.40% on a $334,000 loan adds about $813 a month (my calculation).
Truth Five: Waiting for a Crash Is a Gamble
Many buyers are waiting for prices to fall. It is possible, and local markets differ widely: one NAR region showed a median price down 0.3% from a year ago while another was up 4.7%. But the evidence suggests a grind rather than a collapse, for a reason tied to the lock-in. A crash typically needs forced sellers, and most owners today hold low-rate mortgages with substantial equity and little pressure to sell. Without distressed supply, scarcity holds prices up.That is my interpretation, not a forecast. And there is a second gamble in waiting: rates. The Federal Reserve raised its target range to 3.75%–4.00% in September, and the 10-year Treasury yield was around 5.24% in mid-October. A buyer who waits for lower rates is betting they arrive before prices rise further. If rates fall, demand returns and prices may rise with it. Waiting can work, but it is a trade-off with its own risk, not a free option.
Truth Six: Renting Is Often Cheaper, With a Catch
MarketWatch data reported in September 2026 found that in all 50 major US metro areas, renting costs less than buying, and InvestWithRoots estimated that owning a comparable home costs $500 to $1,500 more per month in most major markets. For a household that cannot comfortably afford the payment, that is a meaningful fact. Renting is not throwing money away when the alternative is stretching beyond what you can afford.But there is a catch. Renting builds no equity, and owning has historically been a forced-savings mechanism for many families. Renting only wins on wealth if you actually invest the difference, month after month, for years. For many people, the discipline is harder than it sounds. And over a long horizon, owning can still pay off through principal paydown and appreciation, which are not guaranteed. The honest answer is that it depends on how long you will stay, your local rent-to-price ratio and your own discipline.
What Buyers, Owners and Renters Can Actually Do
If you are a buyer, start with the payment. Run the full cost, including property taxes, insurance and maintenance, and check that it fits your income with room left for emergencies. Aim to stay at least five to seven years, since transaction costs and a high-rate loan take time to pay off. Negotiate: with inventory rising and days on market lengthening, sellers may accept a price cut or a seller credit, so compare which is worth more over your expected stay. Shop several lenders and compare written estimates.If you are an owner, treat equity as paper wealth until you sell. If your rate is low, that is a real asset, so be cautious about trading it away without a strong reason. If you must sell, price to the local market, since NAR’s economist says sellers need to be realistic. If you are a renter, consider the discipline question: set up automatic investing of the difference, build your credit and keep a separate down-payment fund so you are ready when your numbers work.
Questions to Ask Before You Sign
Can I afford the payment if taxes, insurance or my income change? Will I stay at least five to seven years? Do I have an emergency fund after closing? Does the payment fit even if I never refinance, since refinancing is not guaranteed? What would I do if the home’s value fell 10%? Am I buying because it makes financial sense, or because I fear missing out? An uncomfortable answer is information worth having before you sign.Conclusion
The brutal housing truth is not that homeownership is dead. It is that the math has changed, and few people in the market have an incentive to say so out loud. The median home costs about 4.8 times the median household income. At 7.40%, its payment takes around 32% of that income before taxes and insurance. Roughly half of owners hold mortgages at 4% or less and are reluctant to sell. So prices have held even as sales sink.None of that means you should give up or rush in. It means looking at the payment rather than the sticker price, matching your decision to how long you will stay, negotiating where the market allows and being honest about the real cost of both buying and renting. The market may loosen slowly, as inventory and days on market suggest. Until then, know your numbers, keep a cushion and decide from strength. A qualified housing or mortgage professional can help with your situation.
Frequently Asked Questions
Will home prices crash soon?No one can say for certain. NAR reported a median existing-home price of $417,500 in September 2026, up 1.3% from a year earlier and the 39th straight annual gain. Sales are slow and inventory is rising, but about half of mortgages carry rates of 4% or less, which keeps many owners from selling. That tends to support prices even as sales fall.
How much income do I need to buy the median home?
At the September median price of $417,500, a 20% down payment and a 7.40% mortgage rate, principal and interest alone come to about $2,313 a month. Using a common guideline of keeping that payment near 28% of gross income, you would need about $99,000 a year, before property taxes, insurance and maintenance. The median household income in 2025 was $87,460.
What is the mortgage lock-in effect?
It is the reluctance of owners with low-rate mortgages to sell and take on a much higher rate. Realtor.com found that about 49.9% of outstanding mortgages carried rates of 4% or less in early 2026. Moving from a 3.5% loan to 7.40% on the same loan size would add roughly $813 a month in my calculation.
Is renting smarter than buying right now?
Often cheaper month to month. MarketWatch data reported in September 2026 found that in all 50 major US metro areas, renting costs less than buying. But renting builds no equity, so it only wins if you invest the difference. The right answer depends on how long you will stay and your local market.
Should I wait for mortgage rates to fall before buying?
Waiting is a bet on rates, and nobody can predict them reliably. The 30-year rate reached 7.40% on October 15, up from 6.36% in May, and the Fed raised rates in September. If you do buy, ask about price negotiation or seller credits, and plan for the possibility of refinancing later without counting on it.
0 Comments
Be the first to share your thoughts on this article.