
Understanding Market Cycles: A Simple Guide for Investors
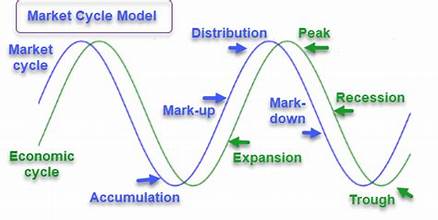
You’ll get a clear definition of market cycles and why they matter to your investments right now. I anchor this with the S&P 500 high-to-low idea so you can see how sectors and stocks behave across phases. The typical cycle has four stages: accumulation, mark-up, distribution, and markdown. Each stage changes risk, value, and timing for your trades and longer-term allocation. Cycles can last minutes or years
depending on your time frame. New trends often start with innovation, policy shifts, or product launches, and price plus volume data help pros spot shifts before most people act.
This section sets a practical base so you can align goals, manage risk, and avoid emotional moves when the next cycle shifts. You’ll be ready to study each stage and apply a clearer plan to your portfolio.
Key Takeaways
- Market cycles follow four classic phases that affect risk and opportunity.
- Use the S&P 500 high-to-low frame to gauge where sectors may be in a cycle.
- Price and volume signals can give early clues, but no single indicator wins alone.
- Your time horizon and strategy change how you read stages and trends.
- Innovation and policy can start or stretch cycles, so stay aware of real-economy drivers.
Understanding market cycles: what they are and why they matter right now
Pros define a full cycle by following a benchmark from peak to peak or trough to trough, so you capture both the advance and the decline rather than cherry-picked rallies.
From peak to trough: how pros define a full market cycle
A complete market cycle usually tracks a benchmark like the S&P 500 from a high down to a low and then back again. This method covers expansion and contraction and helps you see where assets have really gained or lost.
Why pinpointing the current phase in real time is hard
Beginnings and ends are fuzzy. Economic revisions, noisy trading days, and conflicting indicators often mean professionals confirm a phase only in retrospect.
Combine price, volume, and selected indicators to triangulate the likely phase. Even then, cycles compress into minutes for intraday trading or stretch over years for long-term trends.
"Distribution often shows as heavy activity without price progress—it's a common end-of-upmove signal."
- Actionable takeaway: map stages to your plan and respect uncertainty rather than forcing a single view.
The four core phases of a market cycle, explained in plain English
Each full cycle breaks into four clear stages that change how you read price action and position your portfolio.
Accumulation phase
After capitulation, experienced buyers start adding positions inside ranges. Sentiment shifts from negative to neutral and value stories reappear.
What to watch: low, steady volume in a base and institutional scaling before a breakout.
Markup phase
The breakout begins. You see higher highs, higher lows, and rising volume as participation expands.
Action: favor growth and momentum names, but scale in — avoid chasing the first big gap.
Distribution phase
Tops form. Heavy volume appears without sustained price gains. Look for double tops or head-and-shoulders and a possible 200-day moving average break.
Rule: trim winners and tighten stops when patterns and volume signal rotation.
Markdown phase
Selling accelerates and liquidity thins. Volume can spike at climactic lows, which often set up the next accumulation phase.
Defensive move: reduce exposure, protect gains, and watch for signs of capitulation before redeploying.
- Institutional accumulation often lasts inside ranges until supply thins.
- Use price and pattern cues to avoid overstaying in distribution.
- Confirm phase changes with tools like the 200-day MA and volume spikes.
For a concise overview of the four stages, see this guide on the four stages of stock market cycles.
What starts a new cycle: innovation, policy, and shifts in the economy
Often a fresh cycle starts when a product breakthrough or regulatory shift realigns winners and losers across sectors.
You’ll spot catalysts when several companies in an industry show synchronized growth or when a rule change reshapes supply and demand. These secular trends can create multi-year leadership for entire sectors.
Fiscal moves and central bank actions matter too. Aggressive rate cuts or stimulus can extend an uptrend for years, while tightening often compresses rallies and shortens the period of expansion.
Secular trends and industry rotations
Technology adoption, new products, or regulation often drive long-term trends. When many firms report rising revenue and profit, that confirms a structural shift rather than a short rebound.
How fiscal and Federal Reserve policy affect duration
Tax policy, spending, and liquidity change the backdrop for trading and long-term growth. Track rates, money supply, and cross-sector leadership to anticipate rotations before indexes fully reflect them.
"Policy and innovation rarely lift every asset at once; leadership rotates as fundamentals diverge."
- Action: separate cyclical bounces from secular turns using profit and revenue data.
- Monitor: rates, liquidity, and sector breadth to time entries and manage risk.
- Plan: translate macro drivers into portfolio shifts as evidence accumulates.
| Trigger | Typical effect | Example |
| Technological breakthrough | Secular growth for leaders | Cloud computing firms gaining market share |
| Regulatory change | Re-rates and sector rotation | New telecom rules boosting infrastructure names |
| Policy easing (rates cut) | Extended uptrend across risk assets | Lower rates supporting higher P/E multiples |
| Policy tightening | Compressed rallies and faster corrections | Rising rates pressuring interest-sensitive assets |
For a concise primer on how analysts time long swings, see this guide on market cycles.
Timeframes that matter: minutes to years and everything between
Your timeframe alters every decision — from which signals you trust to how you size positions. Pick a horizon first, then build rules that match it.
Day trader vs. long-term investor
If you trade intraday, you read five-minute bars and rely on price action and volume. Your stops are tight and review cadence is hourly or daily.
If you invest for years, you focus on fundamentals, secular trends, and macro data like rates. You let winners compound and accept wider swings.
Typical six-12 month cycles — and when they last longer
Many swings average six to twelve months, yet fiscal or monetary shifts can stretch a cycle into several years.
Mini cycles can sit inside larger trends; avoid mixing signals from different horizons by setting clear entry, risk, and exit rules.
- Practical rule: match tools to period — moving averages for short trades, fundamentals for multi-year bets.
- Risk tips: scale position size and stops based on your chosen horizon.
- Process: set regular checkpoints to review performance against your plan.
| Horizon | Key signals | Typical hold |
| Intraday | Price action, volume, short MAs | Minutes to days |
| Swing | Breakouts, weekly structure | Weeks to months |
| Position/Investor | Fundamentals, macro, rates | Months to years |
Tip: Read the psychology behind swings to align your behavior with timeframe goals — see master market cycle psychology.
Signals and indicators you can use to navigate phases
Read price action first, then layer other tools to confirm a phase change. Use a small, consistent checklist so you act when signals cluster instead of chasing a single point.
Price action and volume: ranges, breakouts, and climaxes
Price and volume together reveal accumulation ranges and genuine breakouts. Breakouts above resistance with rising volume often mark the shift from accumulation to markup.
Volume climaxes with little price progress often signal topping or heavy distribution.
Moving averages to visualize trend and confirmation
Use 20-, 50-, and 200-day averages to define trend, support, and resistance. A clean break below the 200-day can confirm distribution or the start of a markdown.
Chart patterns at tops: double tops and head-and-shoulders
Chart patterns help you avoid holding through deterioration. Double tops and head-and-shoulders paired with heavy volume are classic warning signs.
Fundamental context: profits, rates, and mid-cycle signals
Mid-cycle often shows moderating growth and steady profits. Combine those fundamentals with technical indicators to judge risk and timing for entries or exits.
| Signal | What it shows | Action point |
| Rising volume breakout | Transition to markup | Consider scaled entry |
| 200-day break | Distribution/markdown signal | Tighten stops, reduce risk |
| Double top / H&S | Top formation with failed advances | Trim winners, evaluate exits |
| Consistent MA support | Ongoing uptrend | Hold with defined risk |
How sectors and assets tend to behave across the cycle
Sectors do not move in lockstep; leadership shifts as prices, liquidity, and demand evolve across a cycle.
During upswings, discretionary and luxury names usually outpace peers because people buy nonessentials when confidence and growth are strong.
In contrast, staples and consumer durables often hold value in downturns. Essentials keep selling even as broader prices fall, so these assets defend capital.
Examples: luxury goods in upswings vs. staples in downturns
Example: luxury labels and high-end retailers tend to rally early in a markup, while grocers and household brands outperform in markdown phases.
This pattern helps you build a watchlist that anticipates strength instead of chasing yesterday’s winners.
Interest-rate-sensitive stocks and mid-cycle dynamics
Stocks sensitive to rates—real estate, financials, and utilities—react when policy shifts. A tightening cycle often pressures price multiples; easing can lift growth names.
Mid-cycle conditions often show moderating growth and profits meeting expectations. That environment favors cash-flow resilient businesses and value-style assets.
- Rule of thumb: favor discretionary exposure in markup and lean into staples or high-quality cash flows in markdown.
- Watch: rotation signals—breadth, sector leadership, and price patterns—so you can reallocate without overconcentrating.
"Match valuation, margin structure, and demand elasticity to the phase you expect; it improves portfolio resilience."
Your playbook: positioning, risk management, and timing entries
Build a clear playbook so you know how to enter, size, and protect positions as price action shifts.
A written process removes emotion and gives you rules to follow across phases. You’ll set starter sizes, add-on triggers, and hard invalidation levels.
Scaling in during accumulation vs. chasing markup — pros and cons
Scaling into an accumulation phase lowers your average cost because institutions buy inside ranges. It raises transaction costs but gives you patience before a breakout.
Chasing a markup can lock faster gains when volume expands. That path needs strict position sizing and a clear stop to limit downside.
Managing positions in distribution: trimming, stops, and discipline
Distribution often shows heavy activity without price progress. Use pattern warnings like head-and-shoulders, double tops, or a 200-day break to act.
Trim partials into heavy volume, tighten stops, and avoid adding when rallies fail. Document rules so you follow them when many investors feel pressure to hold.
- Scale entries: starter, add-on confirmation, final add on pullback.
- Checklist: setup quality, price location, volume confirmation, invalidation level.
- Exit rules: time-based, price-based, and condition-based plans to reduce discretion.
- Risk caps: define per-trade, portfolio, and scenario risk limits before trading.
| Situation | Signal | Action |
| Accumulation range | Flat price, rising interest from smart money | Scale in, expect modest tracking error |
| Markup breakout | Expanding volume and higher highs | Add on confirmation, use tight size controls |
| Distribution phase | High volume, no price progress | Trim winners, raise stops, protect value |
| 200-day MA breach | Structural deterioration | Cut exposure, re-evaluate thesis |
"A codified playbook lets you act when the price says so, not when your emotions do."
Conclusion
A compact playbook helps you act with clarity when prices shift and confidence wavers.
You’ll leave with a practical framework to spot which stage the market cycle is in and what to do next. Keep a short checklist that ties price, volume, and fundamentals to clear entries and exits.
Remember that cycles can run longer than expected—sometimes years—and patience plus strict risk control protects you during a crash. Align your investments to your time horizon so decisions reflect your plan, not the mood of others.
Track evidence, stay ready, and favor risk first, return second. Use the cycle lens as a durable guide to navigate change and pursue long-term investment goals.

0 Comments Comments