
Finance
US Inflation Chart 2026: CPI Data, Trends & Analysis
Table of Contents
- The US Inflation Chart: Monthly CPI Trajectory (June 2025 - May 2026)
- Full CPI Category Breakdown: What's Rising, What's Not
- The Energy Shock: Why Oil and Gas Are Driving This Inflation Episode
- Core Inflation: The Reassuring Signal Within the Headline Number
- The Federal Reserve Response: On Hold Amid the Energy Shock
- What the Inflation Data Means for American Households
- Conclusion
- Frequently Asked Questions (FAQ)
- External References & Further Reading
US inflation reached a three-year high of 4.2% in May 2026, the Bureau of Labor Statistics reported on June 10, 2026, marking the third consecutive monthly acceleration in headline prices and the highest annual reading since April 2023. The surge was driven overwhelmingly by a 23.5% year-on-year spike in energy prices, with gasoline prices alone rising 40.5% over the twelve months to May and fuel oil up 58.9% - figures directly attributable to the geopolitical oil shock triggered by ongoing US-Israeli military operations against Iran and the resulting disruption to global crude markets.
The good news embedded within the report is that the surge in inflation remained, in the words of economist Sung Won Sohn of Loyola Marymount University, 'concentrated mainly in energy, especially gasoline, rather than spreading widely across the economy.' Core CPI - which excludes the volatile food and energy categories and is the measure most closely watched by the Federal Reserve for its monetary policy decisions - rose a more moderate 2.9% annually and just 0.2% on a monthly basis, well below the forecast of 0.3% and the April reading of 0.4%. Core commodities prices actually declined 0.1% on the month.
This guide presents the complete US inflation chart data for the twelve months to May 2026, explains the specific mechanisms driving the current rate environment, provides a full CPI category breakdown, examines the Federal Reserve's policy response, and offers practical guidance on what the current inflation picture means for American households managing their budgets and their savings.
The US Inflation Chart: Monthly CPI Trajectory (June 2025 - May 2026)
The table below presents the monthly CPI trajectory across the twelve months to May 2026, providing the 'chart' view of both the monthly movement and the annual rate for both headline and core inflation. Note: the October 2025 BLS release was not published due to the temporary suspension of federal government statistical services; the Cleveland Fed's inflation nowcasting model estimated approximately 0.2% MoM for that period.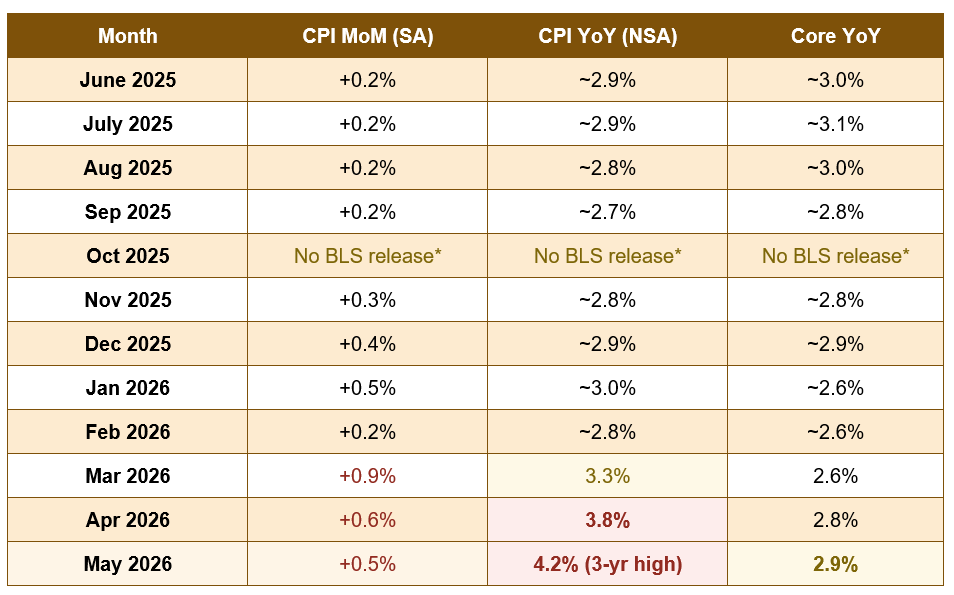
* The BLS did not release a CPI report for October 2025 due to the suspension of federal government services. Inflation nowcasting estimates from the Federal Reserve Bank of Cleveland fill this gap in the official series.
The March 2026 shock: +0.9% MoM - the biggest monthly gain since June 2022 — attributed to the initial oil price spike following the escalation of military operations involving Iran, which drove gasoline prices sharply higher in a single month before partially moderating in subsequent readings (BLS May 2026 CPI release)
- How to read headline vs core inflation: Headline CPI includes all items in the consumer basket, including the volatile food and energy categories. Core CPI excludes food and energy specifically, because these categories fluctuate based on factors - crop harvests, geopolitical events, weather - largely unrelated to the underlying, domestic demand-driven inflation the Fed targets. Core CPI at 2.9% tells a structurally different and considerably calmer story than the 4.2% headline figure, and is the reason the Federal Reserve, as of its June 17, 2026 meeting, chose to hold rates steady rather than raise them further in response to the May CPI surge.
Full CPI Category Breakdown: What's Rising, What's Not
The category-level data reveals that the headline 4.2% figure is far from a uniform story of across-the-board price increases. Energy is doing the overwhelming majority of the work, while several other major categories are either holding steady or actually declining on a monthly basis: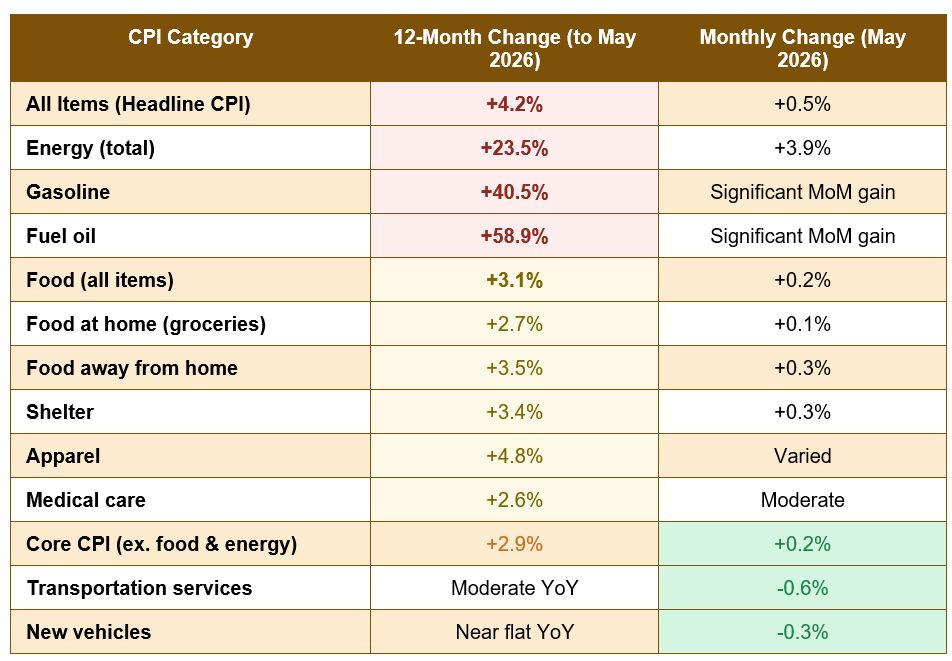
Several findings in this breakdown deserve specific attention. Transportation services actually fell 0.6% on a monthly basis - an indicator that higher energy costs were not, at least as of May, significantly filtering through into transport-related service prices at the consumer level. New vehicle costs declined 0.3% and used cars and trucks rose only 0.1%, suggesting that the tariff-related pressure on vehicle prices that some forecasters had anticipated was not yet manifesting in significant consumer-facing price increases in this category. Both of these data points supported the Federal Reserve's assessment that an immediate rate response was not warranted.
Shelter inflation, at 3.4% annually, remains elevated and deserves close attention, since shelter makes up more than one-third of the overall CPI weighting. A persistent shelter component above 3% acts as a floor beneath headline inflation even if energy prices moderate - meaning that even if the oil shock from the Iran conflict recedes, there is a structural minimum to how quickly headline inflation can return toward the Fed's 2% target without a specific moderation in housing-related price growth.
The Energy Shock: Why Oil and Gas Are Driving This Inflation Episode
To understand the May 2026 CPI reading, the starting point has to be crude oil and the specific geopolitical circumstances that drove energy prices to their current levels. The US-Israeli military operations against Iran that escalated beginning in early 2026 created significant disruption to global crude oil markets, given Iran's role as a major producer and the wider risk premium that armed conflict in the Persian Gulf region imposes on global energy supply expectations.Gasoline prices in the US rose 40.5% over the twelve months to May 2026 and fuel oil rose 58.9% - figures that, set against the context of energy being the largest single component of the monthly inflation increase, explain much of the 4.2% headline reading. These are year-on-year figures measured against the comparatively low energy prices of May 2025, which actually saw energy decline 3.5% on a twelve-month basis at that time, making the current 23.5% year-on-year energy figure partially a base effect as well as a reflection of genuinely higher current prices.
Oxford Economics' lead US economist Nancy Van Houten captured the market consensus position precisely: 'Inflation might not get worse, but it's going to be a bit warm for the time being. It might not cool until next year.' Current market projections from multiple forecasters have CPI potentially topping out in the 4.5-5% range before moderating, with the critical assumption being that the Iran-related oil shock does not intensify further. That assumption remains geopolitically dependent rather than economically determined.
Core Inflation: The Reassuring Signal Within the Headline Number
While the 4.2% headline figure attracted significant media attention, the core CPI data told a considerably more measured story. Core inflation - items excluding food and energy - rose 2.9% annually in May 2026 and just 0.2% on a monthly basis, the lowest monthly core reading since February and meaningfully below the 0.4% monthly gain in April. Core commodities prices actually declined 0.1% on the month.This distinction matters enormously for Federal Reserve policy, because the Fed targets core PCE inflation (a related but slightly different measure) rather than headline CPI as its primary monetary policy benchmark. The moderation in monthly core inflation was the specific reading that kept expectations of a June Fed rate hike from materialising - futures markets, following the May CPI release, continued to price the Fed on hold rather than pricing in additional rate increases, consistent with the actual FOMC decision.
The breakdown within core inflation also provides comfort: new vehicle costs declining, used car prices essentially flat, and transportation services actually falling all indicate that goods price inflation - which was the dominant driver of the 2021-2022 inflation surge - remains subdued in 2026. The current inflation episode is, at its core, an energy and shelter story rather than a broad-based goods and services price spiral, which is precisely why economists have described it as likely to prove more temporary than the 2021-2022 cycle.
Core CPI monthly gain, May 2026: +0.2%, below the April reading of +0.4% — the most important reassuring data point in the May 2026 CPI release, indicating that energy-driven inflation has not yet meaningfully bled through into the broader consumer basket and supporting the Federal Reserve's decision to hold interest rates steady (BLS, June 10, 2026)
The Federal Reserve Response: On Hold Amid the Energy Shock
The Federal Reserve held its benchmark interest rate steady at 3.50-3.75% at its June 17, 2026 FOMC meeting, in a decision fully anticipated by markets following the May CPI release. The current rate range represents a significant reduction from the 5.25-5.50% peak reached in late 2023, with the Fed having cut rates through 2024 and the first half of 2025 as inflation had moderated toward its 2% target before the 2026 energy shock reversed that progress at the headline level.The Fed's hold decision was consistent with its assessment that the current inflation episode is primarily exogenous - driven by a geopolitical energy shock rather than by excess domestic demand or unanchored inflation expectations - and that aggressively tightening monetary policy in response to an external supply shock would risk unnecessarily slowing economic activity without meaningfully addressing the underlying cause of the price increases.
Market expectations, as reflected in Fed funds futures following the May CPI release, continued to price no additional rate increases in 2026 and a potential resumption of cuts in early 2027 if inflation moderated as the base effects from the current energy surge roll off and the geopolitical situation stabilises. This forward guidance was broadly consistent with the outlook from major Wall Street research teams and independent forecasters, though all conditioned on the assumption that the Iran conflict does not escalate significantly beyond its current scope.
What the Inflation Data Means for American Households
For households navigating the current price environment, several specific, practical implications follow from the May 2026 CPI data:- The gas pump is where most households are feeling it most acutely: With gasoline up 40.5% year-on-year, the immediate, visible daily impact of current inflation for most American households is concentrated at the fuel pump. This is an area where households with flexible commuting or transportation choices - working remotely when possible, combining trips, or shifting to public transport in areas where it is viable - can make a direct, immediate impact on their personal inflation exposure.
- Grocery price inflation is more moderate than it feels: Food at home rose just 2.7% annually in May 2026, significantly below the headline 4.2% figure. The widespread perception that grocery prices are rising fast may reflect specific subcategory concentration (proteins, fresh produce) rather than broad-basket price growth - reviewing your own grocery spending by specific category can reveal where the actual pressure is concentrated.
- Shelter costs are likely to be a persistent pressure: Shelter inflation at 3.4% annually reflects both the continuation of elevated housing purchase costs and ongoing rental price growth in many US metros. Unlike energy prices, which are expected to moderate as geopolitical conditions evolve, shelter inflation reflects supply constraints that are structural rather than temporary, suggesting it will remain a meaningful contributor to headline inflation for a longer horizon.
- Core goods deflation offers some real relief: New vehicle prices declining 0.3% monthly, core commodities falling 0.1%, and transportation services down 0.6% all represent genuine real-terms relief in the consumer basket that partially offsets energy price pain. Households planning major durable goods purchases may find current pricing comparatively favourable within the overall inflationary environment.
- Reassess savings and debt at current interest rates: While the Fed is on hold, interest rates remain substantially higher than their pre-2022 norms, meaning high-interest savings accounts and money market funds continue to offer materially positive real returns for households with cash savings, while outstanding variable-rate debt remains expensive to carry. The interest rate environment remains broadly unfavourable for new or ongoing borrowing.
Conclusion
US inflation reached 4.2% in May 2026, the highest rate since April 2023 and the culmination of a three-month acceleration driven overwhelmingly by the energy price shock triggered by US-Israeli military operations against Iran. Gasoline prices up 40.5% annually and fuel oil up 58.9% account for the vast majority of the gap between the 4.2% headline figure and the considerably calmer 2.9% core inflation reading, which excludes food and energy and provides the cleaner signal of whether domestic, demand-driven inflation is gaining momentum - which, based on May's data, it is not.The Federal Reserve's decision to hold rates steady in June 2026 reflected this bifurcation: the central bank's policy tools are not well-suited to addressing an externally-driven energy price shock, and the core inflation data provided sufficient reassurance that the broader consumer basket was not experiencing the kind of self-reinforcing, demand-driven price spiral that would warrant additional rate increases. The prevailing market and analyst view is that inflation will remain 'a bit warm' through 2026 before moderating in 2027 as energy base effects roll off, contingent on no further escalation of the geopolitical situation.
For households managing their finances in this environment, the most important distinction in the May 2026 data is between energy - which is driving the headline surge but is expected to prove more temporary - and shelter, which at 3.4% annual growth represents a more persistent structural pressure with no clear short-term mechanism for relief. Managing energy costs where possible, recognising that grocery inflation is more modest than the headline suggests, and maintaining the high-interest savings positions made possible by the current rate environment are the three most actionable responses to the inflation picture the May 2026 CPI data presents.
Frequently Asked Questions (FAQ)
What is the current US inflation rate?
The most recent available reading is 4.2% for the 12 months to May 2026, reported by the Bureau of Labor Statistics on June 10, 2026. This is the highest annual reading since April 2023 and represents the third consecutive monthly acceleration. The next CPI release, covering June 2026, is scheduled for July 14, 2026.Why is inflation rising in 2026 when it had been falling?
The resurgence in headline inflation in early 2026 is attributed primarily to an energy price shock triggered by US-Israeli military operations against Iran, which disrupted global crude oil markets and drove gasoline prices up 40.5% and fuel oil up 58.9% over the twelve months to May. Before this shock, inflation had moderated significantly from its 2022 peak of 9.1%, falling to around 2.7-2.9% annually by late 2025. Core inflation, which excludes energy and food, has risen more modestly to 2.9%, indicating the energy shock has not yet spread significantly into the broader consumer basket.What is the difference between CPI and core CPI?
The Consumer Price Index (CPI) measures price changes across the full consumer basket, including food and energy. Core CPI excludes food and energy specifically, because these categories fluctuate based on factors largely outside domestic demand - geopolitical events, weather, crop conditions - that monetary policy cannot effectively address. The Federal Reserve focuses primarily on core PCE (a related measure) for its 2% inflation target. In May 2026, headline CPI was 4.2% while core CPI was 2.9%, a 1.3 percentage point gap explained almost entirely by the energy price spike.Will the Federal Reserve raise interest rates further?
Following the May 2026 CPI release, the Federal Reserve held its benchmark rate steady at 3.50-3.75% at its June 17, 2026 FOMC meeting. Market expectations as of that date did not price any further rate increases in 2026, with some probability of rate cuts returning in early 2027 if inflation moderates as energy base effects roll off. The Fed's assessment was that the current inflation episode is primarily driven by an external energy shock rather than by excess domestic demand, making aggressive rate increases an inappropriate response.How long will this inflation episode last?
Multiple forecasters, including Oxford Economics, have suggested that inflation may not cool meaningfully until 2027, with CPI potentially topping out in the 4.5-5% range before moderating as the base effects from the 2026 energy surge roll off. This forecast is contingent on the geopolitical situation with Iran not escalating significantly further. Structural shelter inflation at 3.4% annually is expected to be more persistent than energy-driven inflation, providing a floor beneath headline inflation that limits how quickly it can return to the Fed's 2% target even if energy prices moderate.
External References
The following authoritative sources were used in researching this article and are recommended for further reading:1. U.S. Bureau of Labor Statistics - Consumer Price Index Summary, May 2026
https://www.bls.gov/news.release/cpi.nr0.htm
2. U.S. Bureau of Labor Statistics - CPI Home Page
https://www.bls.gov/cpi/
3. U.S. Bureau of Labor Statistics - The Economics Daily: Consumer Prices Up 4.2% over the Year Ended May 2026
https://www.bls.gov/opub/ted/2026/consumer-prices-up-4-2-percent-over-the-year-ended-may-2026.htm
4. CNBC - CPI Inflation Report May 2026: Prices Rose 4.2% Annually
https://www.cnbc.com/2026/06/10/cpi-inflation-report-may-2026.html
5. CNN Business - US Inflation Tops 4% for First Time in Three Years as Oil Prices Jump
https://www.cnn.com/2026/06/10/economy/us-cpi-consumer-inflation-may
6. Trading Economics - United States Inflation Rate
https://tradingeconomics.com/united-states/inflation-cpi
7. Federal Reserve Bank of Cleveland - Inflation Nowcasting
https://www.clevelandfed.org/indicators-and-data/inflation-nowcasting
8. Federal Reserve - Federal Open Market Committee (FOMC) Statements 2026
https://www.federalreserve.gov/monetarypolicy/fomc.htm

0 Comments Comments