
Business
12-Week Rolling Cash Flow Forecast for Small Business
A 12-week rolling cash flow forecast is the single most important tool for keeping a small business solvent. This guide explains exactly how to build one from scratch, with a fully worked example using Bright Spark Electrical Ltd — a fictional but realistic UK electrical contracting business.
A 12-week rolling cash flow forecast solves this problem by showing you, week by week, exactly how much money you expect to receive and pay out over the next three months. It tells you your projected bank balance at the end of each week — and more importantly, it tells you in advance if that balance is heading toward zero or below. That advance warning gives you time to act: to chase outstanding invoices, negotiate a payment extension with a supplier, draw down a credit facility, or defer a non-essential purchase — options that are still open to you at week six but may not be at week eleven.
The 12-week horizon is deliberately short. It is long enough to reveal the medium-term cash position and identify seasonal or structural pressures, and short enough that the forecast is based on real, known information rather than increasingly uncertain projections. Most businesses can forecast their cash receipts and payments with reasonable confidence over a 12-week period; forecasting six months or a year ahead with the same level of accuracy is very difficult.
The 'rolling' aspect is what makes it a genuine management tool rather than a one-off exercise. Every week, you add a new week at the far end of the forecast, remove the week that has just passed, and compare your actual cash position with what you predicted. Over time, this process builds your forecasting accuracy and your understanding of your own business's cash patterns.
Your P&L is prepared on an accrual basis: revenue is recognised when you invoice a customer, and expenses are recognised when they are incurred, regardless of when money actually changes hands. If you complete a job in January and raise a 30-day invoice, that revenue appears on your January P&L. But the cash does not arrive until February. Your P&L says you made a profit in January; your bank account tells a different story.
A cash flow forecast is prepared on a cash basis: money appears only when it actually arrives in your bank account (receipts) or leaves it (payments). This means a cash flow forecast will always look different from your P&L, even for the same period, because of the timing difference between raising an invoice and being paid, and between incurring an expense and paying for it.
Profit is an opinion. Cash is a fact. A business that understands the difference between the two will never be surprised by a cash crisis.
— INSTITUTE OF CHARTERED ACCOUNTANTS IN ENGLAND AND WALES (ICAEW)
Common timing differences that create the gap between profit and cash include: customer payment terms (30, 60, or 90 days), VAT or sales tax payments due quarterly or monthly, annual insurance premiums paid in a single lump sum, loan repayments that reduce cash but are not an expense on the P&L, capital purchases that appear as cash outflows immediately but are depreciated gradually on the P&L, and staff wages that may be paid a week or two after the period they relate to.
Common inflow line items include: receipts from customer invoices (split by payment terms or customer group if useful), cash sales if you have walk-in or point-of-sale revenue, advance payments or deposits received on new orders, VAT refunds due, asset disposal proceeds, loan drawdowns, and any grant funding expected.
Common outflow line items include: staff wages and salaries (on their actual payment date), materials and stock purchases, rent and utilities, vehicle and fuel costs, supplier payments (on their actual due dates based on your terms), VAT/GST payments, loan repayments, PAYE and National Insurance on the payroll payment date, professional fees, and any planned equipment purchases.
The most important discipline here is timing. Bright Spark raises its invoices at the end of each week. With 30-day payment terms — and some clients taking 35 days in practice — invoice receipts in any given week are primarily the cash from invoices raised approximately four to five weeks earlier. This timing lag is the single most common source of cash flow problems for small businesses that trade on credit terms: revenue is rising, but the cash is always chasing behind.
For week 1 of the forecast (week commencing 1 May 2026), Bright Spark expects to receive: £22,000 in 30-day invoice receipts (representing invoices raised in late March and early April), £4,800 in on-site cash payments for smaller jobs, and no deposit receipts this week. Total expected cash inflows in week 1: £26,800.
In week 4 of the forecast, a new large commercial contract has been agreed and a £8,000 deposit will be received. In week 9, another contract deposit of £12,000 is expected. These one-off items are clearly flagged in the forecast so management can see exactly where the cash is coming from and can monitor whether the deposits arrive as expected.
The most important item to handle carefully is the VAT payment. Bright Spark is on standard quarterly VAT accounting and has a VAT quarter ending 30 April 2026 (falling in week 0 of this forecast) and another ending 31 July 2026 (falling in week 13). The VAT payments due in the forecast period are the payments for the quarters ending January 2026 and April 2026 — due in weeks 4 and 9 respectively. Each payment is approximately £14,200. These large, infrequent outflows are the most common cause of unexpected cash shortfalls for small businesses who track only their weekly costs without accounting for lumpy periodic payments.
Similarly, wages are paid every Friday. For Bright Spark, the combined weekly wages and salaries bill is £18,000 — a fixed and non-negotiable outflow every week, regardless of what cash has come in that week. Materials and parts costs are variable and are entered based on planned job schedules and existing supplier orders.
The running cash balance is then calculated: Opening Balance plus Net Cash Flow equals Closing Balance. This closing balance rolls forward as the next week's opening balance.
For Bright Spark in week 1: Total Cash In is £26,800, Total Cash Out is £38,500 (wages £18,000, materials £8,200, rent/utilities £3,500, vehicles £1,800, subcontractors £4,200, insurance/fees £800, loan repayment £2,000). Net Cash Flow is minus £11,700. Opening Balance is £28,500. Closing Balance is £16,800.
The business has started the forecast period with a reasonable buffer, but the net cash outflow in every single week of the forecast period is a serious warning that requires immediate management attention. Let us look at the full 12 weeks.
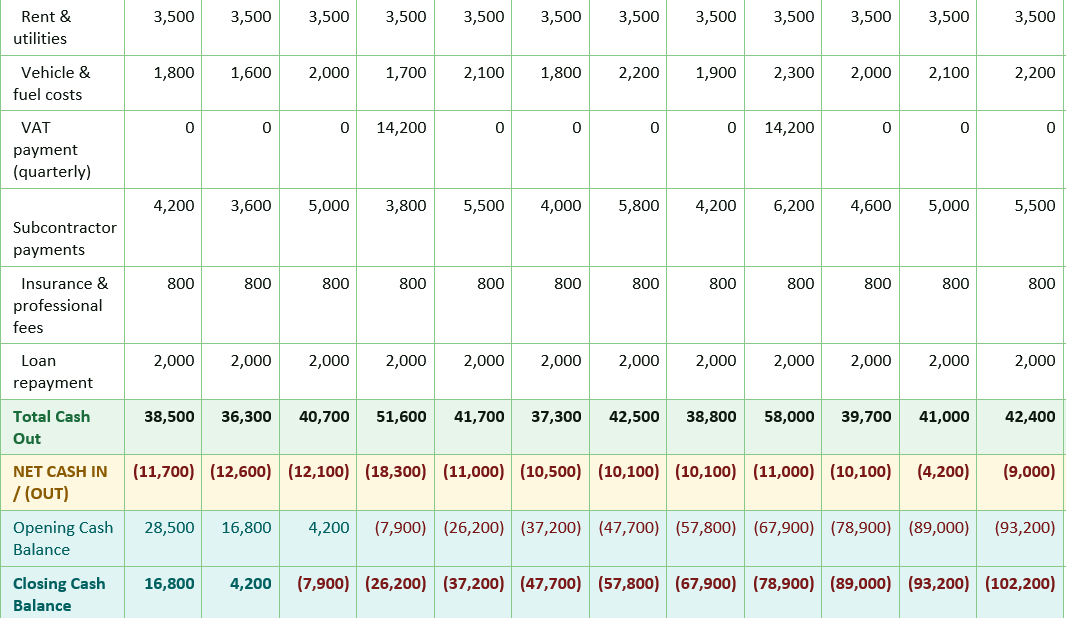
Note: Weeks 1–3 show manageable cash positions. However, the VAT payment in week 4 (£14,200) pushes the business into a negative cash balance for the first time (closing balance: minus £26,200). The closing balance then deteriorates steadily, reaching minus £102,200 by the end of week 12. This is a critical warning signal.
Most cloud accounting platforms — including Xero, QuickBooks Online, Sage, and FreeAgent — include built-in cash flow forecasting tools that pull data directly from your actual accounting transactions, reducing the manual data entry required. Xero's Short-Term Cash Flow tool, for example, automatically predicts when invoices are likely to be paid and when bills are due, and shows a rolling cash position for the next 30 days. For the 12-week horizon, a separate spreadsheet model remains the most flexible and transparent option for most small businesses.
Dedicated cash flow forecasting platforms such as Float, Fluidly, and Futrli connect directly to cloud accounting software and provide more sophisticated scenario modelling and variance analysis. These are worth considering for businesses where cash management is particularly complex or where the business is growing rapidly and cash forecasting accuracy is critical.
The forecast does not solve cash flow problems on its own. But it gives you the visibility to see them coming four, eight, or twelve weeks ahead — and that lead time is the difference between having options and having a crisis. Build your forecast this week. Update it every Monday. Share it with your accountant or bank if appropriate. And use what it tells you to make proactive decisions rather than reactive ones.
GOV.UK — Business Finance and Cash Flow Guidance https://www.gov.uk/guidance/business-finance-explained
British Business Bank — Cash Flow Forecasting Template and Guide https://www.british-business-bank.co.uk/finance-hub/cash-flow-forecasting/
Xero — Cash Flow Forecasting: A Guide for Small Businesses https://www.xero.com/uk/guides/cash-flow-forecasting/
QuickBooks — How to Create a Cash Flow Forecast https://quickbooks.intuit.com/uk/blog/accounting/cash-flow-forecast/
Sage — Cash Flow Forecast: What It Is and How to Prepare One https://www.sage.com/en-gb/blog/cash-flow-forecast/
HMRC — Understanding Your Business Cash Flow https://www.gov.uk/self-employed-records
US SBA — Cash Flow Management for Small Businesses https://www.sba.gov/business-guide/manage-your-business/manage-your-finances
Float App — 12-Week Cash Flow Forecasting Software https://www.floatapp.com/
Investopedia — Cash Flow Forecast: Definition, Purpose, and Example https://www.investopedia.com/terms/c/cashflow.asp
TABLE OF CONTENTS
- Why a 12-Week Rolling Cash Flow Forecast is Non-Negotiable
- Cash Flow vs Profit: Understanding the Critical Difference
- The Structure of a 12-Week Rolling Cash Flow Forecast
- Introducing the Example Company: Bright Spark Electrical Ltd
- Step 1: List All Cash Inflows
- Step 2: List All Cash Outflows
- Step 3: Calculate Net Cash Flow and Running Balance
- The Full 12-Week Forecast for Bright Spark Electrical Ltd
- Reading the Warning Signs: What the Numbers Tell You
- How to Update and Roll the Forecast Forward Each Week
- Tools and Templates for Building Your Forecast
- Conclusion
- Frequently Asked Questions
- References
Why a 12-Week Rolling Cash Flow Forecast is Non-Negotiable
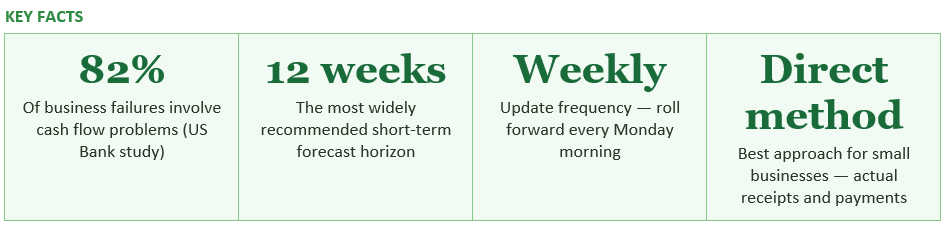
A study by US Bank found that 82% of small business failures are caused by poor cash flow management — not by poor products, bad marketing, or insufficient demand. A business can be genuinely profitable on paper and still run out of money in the bank. This happens when the timing of cash coming in does not match the timing of cash going out — and without a cash flow forecast, most business owners do not see the gap coming until it is already a crisis.A 12-week rolling cash flow forecast solves this problem by showing you, week by week, exactly how much money you expect to receive and pay out over the next three months. It tells you your projected bank balance at the end of each week — and more importantly, it tells you in advance if that balance is heading toward zero or below. That advance warning gives you time to act: to chase outstanding invoices, negotiate a payment extension with a supplier, draw down a credit facility, or defer a non-essential purchase — options that are still open to you at week six but may not be at week eleven.
The 12-week horizon is deliberately short. It is long enough to reveal the medium-term cash position and identify seasonal or structural pressures, and short enough that the forecast is based on real, known information rather than increasingly uncertain projections. Most businesses can forecast their cash receipts and payments with reasonable confidence over a 12-week period; forecasting six months or a year ahead with the same level of accuracy is very difficult.
The 'rolling' aspect is what makes it a genuine management tool rather than a one-off exercise. Every week, you add a new week at the far end of the forecast, remove the week that has just passed, and compare your actual cash position with what you predicted. Over time, this process builds your forecasting accuracy and your understanding of your own business's cash patterns.
Cash Flow vs Profit: Understanding the Critical Difference
Before building a cash flow forecast, it is essential to understand why it is different from your Profit and Loss statement — and why a profitable business can still run out of cash.Your P&L is prepared on an accrual basis: revenue is recognised when you invoice a customer, and expenses are recognised when they are incurred, regardless of when money actually changes hands. If you complete a job in January and raise a 30-day invoice, that revenue appears on your January P&L. But the cash does not arrive until February. Your P&L says you made a profit in January; your bank account tells a different story.
A cash flow forecast is prepared on a cash basis: money appears only when it actually arrives in your bank account (receipts) or leaves it (payments). This means a cash flow forecast will always look different from your P&L, even for the same period, because of the timing difference between raising an invoice and being paid, and between incurring an expense and paying for it.
Profit is an opinion. Cash is a fact. A business that understands the difference between the two will never be surprised by a cash crisis.
— INSTITUTE OF CHARTERED ACCOUNTANTS IN ENGLAND AND WALES (ICAEW)
Common timing differences that create the gap between profit and cash include: customer payment terms (30, 60, or 90 days), VAT or sales tax payments due quarterly or monthly, annual insurance premiums paid in a single lump sum, loan repayments that reduce cash but are not an expense on the P&L, capital purchases that appear as cash outflows immediately but are depreciated gradually on the P&L, and staff wages that may be paid a week or two after the period they relate to.
The Structure of a 12-Week Rolling Cash Flow Forecast
A 12-week rolling cash flow forecast has three main sections: cash inflows, cash outflows, and the resulting cash balance. These are arranged in columns — one for each of the twelve weeks ahead — with a row for each individual line item.Section 1: Cash Inflows
This section lists every source of money that you expect to receive each week. The most important distinction is to enter cash when it will actually arrive in your bank account, not when you invoice for it. If you raise an invoice on Monday of week one with 30-day payment terms, the cash receipt appears in week five (approximately four weeks later), not week one.Common inflow line items include: receipts from customer invoices (split by payment terms or customer group if useful), cash sales if you have walk-in or point-of-sale revenue, advance payments or deposits received on new orders, VAT refunds due, asset disposal proceeds, loan drawdowns, and any grant funding expected.
Section 2: Cash Outflows
This section lists every payment you expect to make. The key principle is completeness — every cash payment that will leave your bank account during the period, including items that only happen occasionally such as quarterly VAT, annual insurance renewals, tax payments, and one-off capital purchases.Common outflow line items include: staff wages and salaries (on their actual payment date), materials and stock purchases, rent and utilities, vehicle and fuel costs, supplier payments (on their actual due dates based on your terms), VAT/GST payments, loan repayments, PAYE and National Insurance on the payroll payment date, professional fees, and any planned equipment purchases.
Section 3: Cash Balance
The balance section has three rows: Opening Cash Balance (your actual bank balance at the start of each week), Net Cash Flow (Total Cash In minus Total Cash Out for that week), and Closing Cash Balance (Opening Balance plus Net Cash Flow). The closing balance of one week becomes the opening balance of the next. A red closing balance in any week is an immediate warning that action is needed.Introducing the Example Company: Bright Spark Electrical Ltd
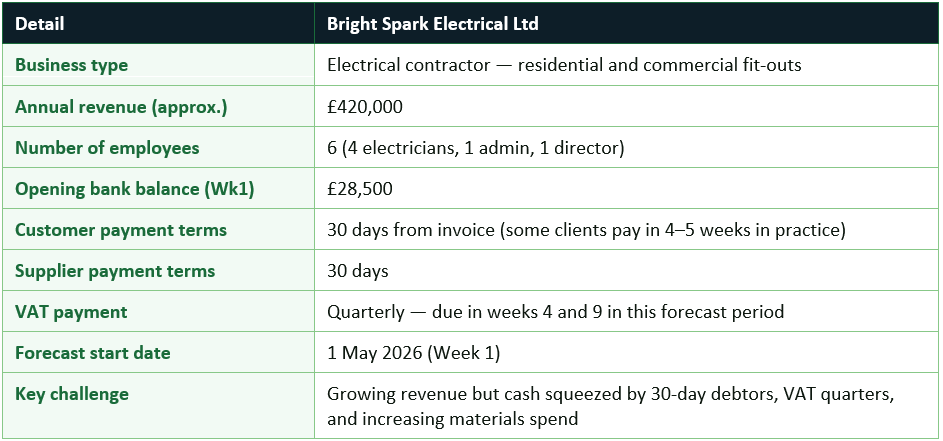
Throughout this guide, we use Bright Spark Electrical Ltd — a fictional but realistic UK electrical contracting business — to illustrate every step of the forecasting process.Step 1: List All Cash Inflows
Bright Spark Electrical Ltd has three main sources of cash inflow: receipts from 30-day invoices raised to clients, cash payments received on-site for smaller jobs, and periodic contract deposits when a new large contract is signed.The most important discipline here is timing. Bright Spark raises its invoices at the end of each week. With 30-day payment terms — and some clients taking 35 days in practice — invoice receipts in any given week are primarily the cash from invoices raised approximately four to five weeks earlier. This timing lag is the single most common source of cash flow problems for small businesses that trade on credit terms: revenue is rising, but the cash is always chasing behind.
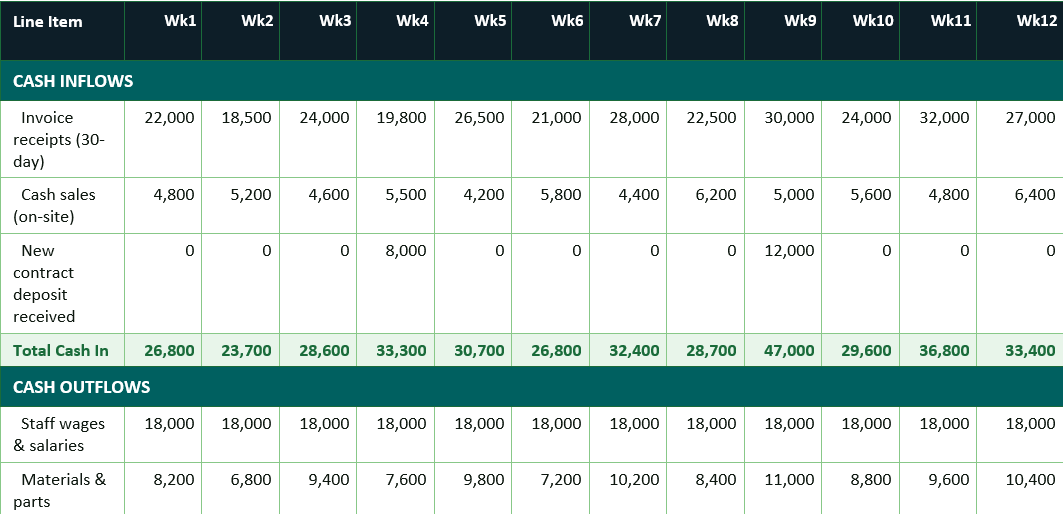
For week 1 of the forecast (week commencing 1 May 2026), Bright Spark expects to receive: £22,000 in 30-day invoice receipts (representing invoices raised in late March and early April), £4,800 in on-site cash payments for smaller jobs, and no deposit receipts this week. Total expected cash inflows in week 1: £26,800.
In week 4 of the forecast, a new large commercial contract has been agreed and a £8,000 deposit will be received. In week 9, another contract deposit of £12,000 is expected. These one-off items are clearly flagged in the forecast so management can see exactly where the cash is coming from and can monitor whether the deposits arrive as expected.
Step 2: List All Cash Outflows
Bright Spark's cash outflows are more predictable than its inflows, which is typical for most businesses. Fixed regular costs — wages, rent, loan repayment — occur on known dates each week or month. The main variables are materials spending (which rises with workload) and the quarterly VAT payment.The most important item to handle carefully is the VAT payment. Bright Spark is on standard quarterly VAT accounting and has a VAT quarter ending 30 April 2026 (falling in week 0 of this forecast) and another ending 31 July 2026 (falling in week 13). The VAT payments due in the forecast period are the payments for the quarters ending January 2026 and April 2026 — due in weeks 4 and 9 respectively. Each payment is approximately £14,200. These large, infrequent outflows are the most common cause of unexpected cash shortfalls for small businesses who track only their weekly costs without accounting for lumpy periodic payments.
Similarly, wages are paid every Friday. For Bright Spark, the combined weekly wages and salaries bill is £18,000 — a fixed and non-negotiable outflow every week, regardless of what cash has come in that week. Materials and parts costs are variable and are entered based on planned job schedules and existing supplier orders.
Step 3: Calculate Net Cash Flow and Running Balance
Once all inflows and outflows are entered for each week, the net cash flow calculation is straightforward: Total Cash In minus Total Cash Out equals Net Cash Flow for the week. This can be positive (more cash arriving than leaving) or negative (more cash leaving than arriving).The running cash balance is then calculated: Opening Balance plus Net Cash Flow equals Closing Balance. This closing balance rolls forward as the next week's opening balance.
For Bright Spark in week 1: Total Cash In is £26,800, Total Cash Out is £38,500 (wages £18,000, materials £8,200, rent/utilities £3,500, vehicles £1,800, subcontractors £4,200, insurance/fees £800, loan repayment £2,000). Net Cash Flow is minus £11,700. Opening Balance is £28,500. Closing Balance is £16,800.
The business has started the forecast period with a reasonable buffer, but the net cash outflow in every single week of the forecast period is a serious warning that requires immediate management attention. Let us look at the full 12 weeks.
The Full 12-Week Forecast for Bright Spark Electrical Ltd
The table below shows the complete 12-week rolling cash flow forecast. All figures are in pounds sterling. Negative numbers are shown in brackets. Red text indicates a negative figure; green text indicates a positive figure. The closing cash balance row shows where the business stands at the end of each week.Note: Weeks 1–3 show manageable cash positions. However, the VAT payment in week 4 (£14,200) pushes the business into a negative cash balance for the first time (closing balance: minus £26,200). The closing balance then deteriorates steadily, reaching minus £102,200 by the end of week 12. This is a critical warning signal.
Reading the Warning Signs: What the Numbers Tell You
The Bright Spark forecast reveals several important warning signals that management must address immediately.Warning 1: Structural negative net cash flow in every week
The most alarming finding is that Bright Spark has negative net cash flow in every single week of the 12-week forecast. This means the business is consistently spending more cash each week than it receives. Total outflows over 12 weeks are £508,500 against total inflows of £376,800 — a gap of £131,700. This is not a short-term timing problem; it is a structural imbalance between the pace of revenue collection and spending.Warning 2: VAT payments create acute cash pressure
The VAT payments in weeks 4 and 9 (£14,200 each) are not being accumulated in a separate savings account as VAT falls due. Many small businesses fall into this trap — they treat VAT collected from customers as their own cash until the payment is due, at which point it arrives as a shock. Bright Spark should be setting aside a proportion of each invoice receipt into a VAT reserve account each week.Warning 3: The business will be insolvent by week 4 without action
The forecast shows the closing cash balance going negative for the first time at the end of week 4. If no action is taken, the business will not be able to pay its creditors from week 4 onwards. This is the most important function of the 12-week forecast: it identifies this problem at week 1 — four weeks before it happens — giving management time to act.Immediate actions Bright Spark should take based on the forecast
- Chase debtors urgently: Review all outstanding invoices. If even 20% of debtors could be moved from 30-day to 14-day payment terms, cash inflows would increase significantly in weeks 2-5.
- Start a VAT savings pot today: Calculate the VAT component of every receipt and transfer it to a separate savings account immediately. This protects against the VAT payment shock in weeks 4 and 9.
- Negotiate extended payment terms with key suppliers: Pushing materials payments from 30 to 45 days would reduce early-week outflows and ease the cash pressure.
- Review subcontractor payment timing: Can any subcontractor payments be deferred by two weeks without damaging relationships? This is a short-term measure, not a permanent solution.
- Draw down the business overdraft or credit facility: If the business has a pre-agreed facility, now is the time to use it — week 1, not week 5 when the bank can see the crisis is already in progress.
- Speak to the bank: A proactive conversation with the business's bank at week 1, showing them the forecast and the actions being taken, is far more likely to secure support than a reactive call in week 5.
How to Update and Roll the Forecast Forward Each Week
The power of a rolling forecast comes from its weekly update discipline. Every Monday morning — ideally before you do anything else — you should spend 20 to 30 minutes updating your forecast. This is how the rolling mechanism works.Weekly rolling update process — step by step
- Step 1 — Enter actual figures for the week just ended: Replace your forecasted figures for last week with the actual cash receipts and payments from your bank statement. Every line item should be updated with the real number.
- Step 2 — Calculate the variance: For each line, calculate the difference between your forecast and actual. Large variances (positive or negative) should be understood — did a customer pay late? Did a material delivery cost more than expected? These variances improve your future forecasting accuracy.
- Step 3 — Remove the week just ended from the front: Your forecast now covers weeks 2 through 12 (the original week 1 is now history). Shift your view forward by one week.
- Step 4 — Add a new week 12 at the far end: Using the same approach as your initial forecast, estimate cash receipts and payments for the new week 12 that has just come into your visible horizon.
- Step 5 — Revise any weeks affected by new information: If a major client has signalled they will pay late, revise the relevant receipt weeks. If a supplier has confirmed a price increase, update future material costs. The forecast should always reflect your best current knowledge.
- Step 6 — Review the closing balance trend: Is the forecast improving or deteriorating compared with last week's version? Take any corrective action prompted by the updated picture before the week progresses further.
Tools and Templates for Building Your Forecast
The simplest tool for a 12-week rolling cash flow forecast is a spreadsheet. A well-structured Excel or Google Sheets template with automatic calculations takes no more than an hour to set up and can be maintained in 20 minutes per week once running. HMRC, the ICAEW, and the Business Finance Guide all publish free templates that can be downloaded and adapted.Most cloud accounting platforms — including Xero, QuickBooks Online, Sage, and FreeAgent — include built-in cash flow forecasting tools that pull data directly from your actual accounting transactions, reducing the manual data entry required. Xero's Short-Term Cash Flow tool, for example, automatically predicts when invoices are likely to be paid and when bills are due, and shows a rolling cash position for the next 30 days. For the 12-week horizon, a separate spreadsheet model remains the most flexible and transparent option for most small businesses.
Dedicated cash flow forecasting platforms such as Float, Fluidly, and Futrli connect directly to cloud accounting software and provide more sophisticated scenario modelling and variance analysis. These are worth considering for businesses where cash management is particularly complex or where the business is growing rapidly and cash forecasting accuracy is critical.
CONCLUSION
The 12-week rolling cash flow forecast is the most powerful early warning system available to a small business owner. As the Bright Spark Electrical Ltd example demonstrates, a business can have strong revenue, a full order book, and a genuinely profitable operation — and still be heading toward insolvency if the timing of cash receipts and payments is not actively managed.The forecast does not solve cash flow problems on its own. But it gives you the visibility to see them coming four, eight, or twelve weeks ahead — and that lead time is the difference between having options and having a crisis. Build your forecast this week. Update it every Monday. Share it with your accountant or bank if appropriate. And use what it tells you to make proactive decisions rather than reactive ones.
Frequently Asked Questions
What is a 12-week rolling cash flow forecast?
A 12-week rolling cash flow forecast is a weekly financial model showing expected cash receipts and payments for the next 12 weeks, along with the projected bank balance at the end of each week. It is 'rolling' because it is updated every week: the most recently completed week is removed from the front, and a new week 12 is added at the far end, so the forecast always looks three months ahead. It uses actual cash movements — when money arrives and leaves your bank account — not accounting concepts like accrued revenue or depreciation.What is the difference between a cash flow forecast and a P&L forecast?
A P&L (Profit and Loss) forecast shows revenue, costs, and profit on an accrual basis — income is recognised when earned, expenses when incurred, regardless of when cash changes hands. A cash flow forecast shows only actual cash movements: when money physically enters or leaves your bank account. A business can show a profit on its P&L while simultaneously running out of cash if customers are paying slowly, large periodic bills are due, or significant upfront costs are being incurred before revenue is collected.Why did Bright Spark Electrical Ltd's closing balance turn negative in week 4?
The closing balance turned negative in week 4 for two reasons: first, the structural imbalance between weekly cash outflows (primarily wages, materials, and subcontractors) and cash inflows, where 30-day invoice receipts lag behind the work being done by four to five weeks. Second, the quarterly VAT payment of £14,200 fell due in week 4. Together, these pushed the week 4 closing balance to minus £26,200. The key lesson is that the VAT payment was known in advance — the forecast shows it clearly — but many businesses fail to plan for it.How accurate does a 12-week cash flow forecast need to be?
Perfect accuracy is not the goal — useful accuracy is. In weeks one and two, most businesses can forecast with high confidence because the receipts are already invoiced and the outgoings are already committed. By week eight or nine, there is more uncertainty. A good rule of thumb is that if your forecast is within 5% to 10% of actual outcomes for each week, your forecasting is serving its purpose well. The weekly variance review (comparing actual to forecast) is what builds accuracy over time.What should I do if my 12-week forecast shows a negative balance?
Act immediately — the earlier you act, the more options you have. Prioritise chasing outstanding debtors to accelerate cash receipts. Review which outflows can be delayed or reduced without materially damaging the business. Contact your bank proactively to discuss your position before you are already in crisis — banks are far more willing to support businesses that approach them early with a clear plan than those who call when they have already missed payments. Consider whether an invoice financing or factoring arrangement could accelerate receipt of invoiced amounts. Seek advice from your accountant.Can I use Excel or Google Sheets to build a 12-week rolling cash flow forecast?
Yes, and for most small businesses, a well-structured spreadsheet is the most practical tool. HMRC, the ICAEW, and organisations including the British Business Bank publish free downloadable templates. Cloud accounting platforms like Xero and QuickBooks also include built-in cash flow tools. If you want more sophisticated scenario modelling, dedicated tools like Float, Fluidly, or Futrli connect directly to cloud accounting software and provide real-time cash position views.References
ICAEW — Cash Flow Forecasting: Why Every Business Needs One https://www.icaew.com/technical/business-finance/cash-flowGOV.UK — Business Finance and Cash Flow Guidance https://www.gov.uk/guidance/business-finance-explained
British Business Bank — Cash Flow Forecasting Template and Guide https://www.british-business-bank.co.uk/finance-hub/cash-flow-forecasting/
Xero — Cash Flow Forecasting: A Guide for Small Businesses https://www.xero.com/uk/guides/cash-flow-forecasting/
QuickBooks — How to Create a Cash Flow Forecast https://quickbooks.intuit.com/uk/blog/accounting/cash-flow-forecast/
Sage — Cash Flow Forecast: What It Is and How to Prepare One https://www.sage.com/en-gb/blog/cash-flow-forecast/
HMRC — Understanding Your Business Cash Flow https://www.gov.uk/self-employed-records
US SBA — Cash Flow Management for Small Businesses https://www.sba.gov/business-guide/manage-your-business/manage-your-finances
Float App — 12-Week Cash Flow Forecasting Software https://www.floatapp.com/
Investopedia — Cash Flow Forecast: Definition, Purpose, and Example https://www.investopedia.com/terms/c/cashflow.asp

0 Comments Comments