
Investing
60/40 Portfolio Split Explained: The Basics


Key Statistics: 7–8% average annual return (200-year history); worst year was 2022 (down 17.5%, worst since 1937); best recent recovery: +17.2% in 2023; 2024: +15%; 2025: ~+15%; 9.47% annualised 10-year return to July 2026 (PortfoliosLab); 10-year average rolling return of 7.8%; Sharpe ratio 1.46 as of July 2026; stock-bond 12-month correlation dropped from 0.80 in mid-2024 to 0.16 by late 2025.
Table of Contents
- The Portfolio That Has Survived Two Centuries
- What the 60/40 Portfolio Actually Is
- The Numbers: What a 60/40 Portfolio Has Historically Delivered
- Why It Works: The Stock-Bond Correlation
- The 60% Equity Slice: What Goes In
- The 40% Bond Slice: What Goes In
- The 2022 Crisis: When the 60/40 Almost Broke
- The 2023–2026 Comeback: Why It’s Working Again
- The Key Metrics: Sharpe Ratio, Volatility, and Drawdown
- Is the 60/40 Portfolio Right for You?
- Modern Variations: When Investors Tweak the Split
- How to Build a 60/40 Portfolio Practically
- Conclusion: The Portfolio That Keeps Coming Back
- Frequently Asked Questions
- External References and Further Reading
The Portfolio That Has Survived Two Centuries
In a world of increasingly complex investment strategies — alternative assets, factor tilts, thematic ETFs, cryptocurrency allocations — one of the most enduring investment frameworks is also one of the simplest. The 60/40 portfolio: 60 percent equities (stocks), 40 percent fixed income (bonds). No more than two asset classes. A concept so straightforward it can be explained in a single sentence.And yet, it has delivered an average annual return of approximately 7 to 8 percent over two centuries of market history. It survived two World Wars, the Great Depression, the dot-com crash, the 2008 financial crisis, the COVID-19 pandemic crash, and a severe near-death experience in 2022. It has been declared dead at least twice in the past decade, and it has recovered from both declarations to post double-digit returns.
This article explains the 60/40 portfolio from first principles: what it is, why it works, what it has actually delivered historically, the specific circumstances under which it struggles, and whether it remains a sensible foundation for an investment strategy in 2026. The data is drawn from Morningstar, Vanguard, Morgan Stanley, PortfoliosLab, and LPL Research, all updated through 2026.
What the 60/40 Portfolio Actually Is
A 60/40 portfolio is an investment portfolio that allocates 60 percent of its total value to equities (shares in publicly traded companies) and 40 percent to fixed-income securities (bonds). The simplest implementation is to hold a single broad-market equity index fund and a single broad-market bond index fund in this ratio, and to rebalance periodically to maintain it.The equity allocation provides growth. Over long periods, stocks have historically outperformed bonds, inflation, and cash. The bond allocation provides stability and income. Bonds typically generate regular interest payments and tend to hold their value or rise in price when equities fall — the diversification effect that makes the combined portfolio less volatile than a 100 percent equity portfolio.
The 60/40 split specifically has become the most common balanced portfolio benchmark because it reflects a moderate risk tolerance: enough growth exposure to build wealth over time, enough fixed-income exposure to reduce the severity of market downturns to a level most investors can tolerate without abandoning their strategy. Morningstar's Jeff Kephart describes it as the portfolio investors with a moderate risk tolerance are typically going to end up in.
Morningstar on the 60/40: It's the most popular portfolio because it really does strike a nice balance between your risky assets and your safe assets. When you have a moderate risk tolerance, this is typically the portfolio you're going to end up in.
The Numbers: What a 60/40 Portfolio Has Historically Delivered
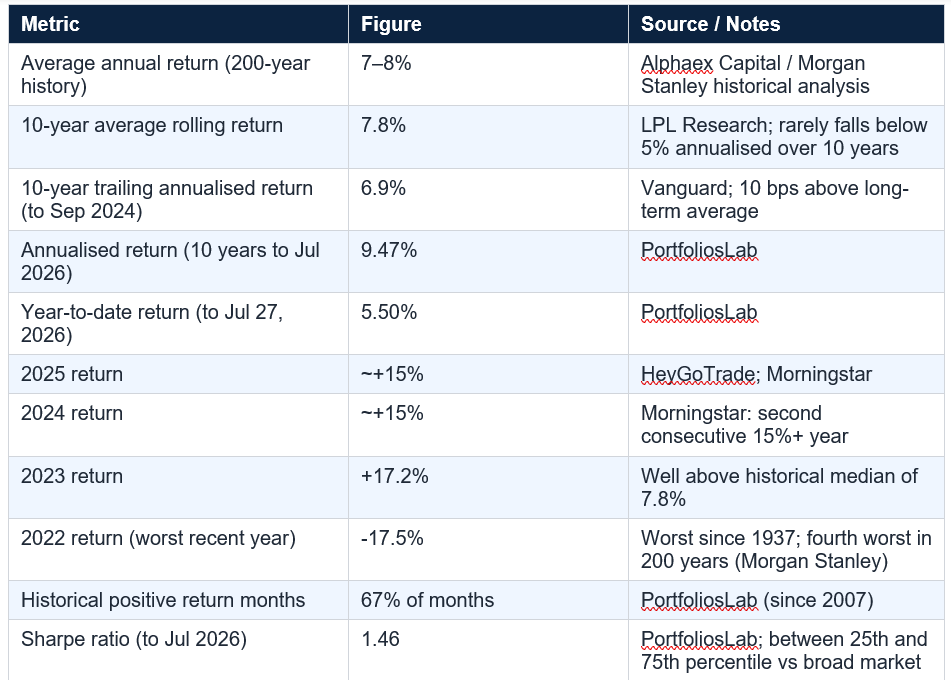
Two numbers in this table deserve emphasis. First, the 10-year average rolling return of 7.8 percent has rarely fallen below 5 percent annualised. This is a statement about the strategy's consistency rather than any single year's performance. Second, the 67 percent positive-month rate since 2007 — across two major crises and multiple drawdowns — reflects the smoothing effect that the bond allocation provides. In a 100 percent equity portfolio, the positive-month rate would be lower and the negative months would be more severe.
Why It Works: The Stock-Bond Correlation
The 60/40 portfolio's fundamental mechanism is the relationship between stocks and bonds. Under normal market conditions, stocks and bonds are negatively correlated: when equity prices fall (typically during economic downturns or market panics), investors move money into the relative safety of bonds, pushing bond prices up. This means that when the equity half of a 60/40 portfolio is losing value, the bond half is typically gaining value — cushioning the overall portfolio's decline.This negative correlation is not guaranteed and not constant. Historically, before the 2000s, positive correlation between stocks and bonds (both rising and falling together) was the norm rather than the exception. The sustained negative correlation from approximately 2000 to 2020 was the product of a specific monetary environment: falling interest rates, low inflation, and central banks cutting rates when equities fell. That environment changed in 2022.
The stock-bond 12-month correlation peaked at 0.80 in mid-2024, according to HeyGoTrade's April 2026 analysis — a highly positive correlation, meaning stocks and bonds were moving in the same direction. But by late 2025, that figure had dropped sharply to just 0.16, suggesting the correlation is normalising toward the negative relationship that makes the 60/40 most effective. As Morningstar noted in its December 2025 brief, during the pullback in the stock market in 2024, bonds did really well — suggesting bonds are regaining their traditional diversification role.
The 60% Equity Slice: What Goes In
The equity portion of a 60/40 portfolio can be implemented at varying levels of complexity, from a single total-market index fund to a diversified multi-fund equity allocation. For most investors, broad-market index funds provide the most cost-effective and diversified equity exposure.- US total market: a fund tracking the CRSP US Total Market Index or the Russell 3000 provides exposure to virtually all US-listed equities, from the largest mega-caps to small companies. Vanguard VTI, Fidelity ZERO Total Market, and iShares ITOT are common implementations.
- International developed markets: adding exposure to non-US developed markets (Europe, Japan, Australia) diversifies against US-specific economic and regulatory risks. Vanguard VXUS or iShares EFA provide this.
- Emerging markets: a smaller allocation to emerging market equities (China, India, Brazil, etc.) provides higher growth potential and further geographic diversification. iShares IEMG or Vanguard VWO are typical choices.
The 40% Bond Slice: What Goes In
The bond allocation's primary role is portfolio stability. It provides income through interest payments, a store of value when equities fall, and a counterweight to equity volatility. The implementation choice within bonds significantly affects both the income generated and the stability provided.- • Government bonds (US Treasuries, UK Gilts, etc.): highest quality, lowest credit risk. The most reliable safe-haven in equity downturns. Vanguard's BND (US total bond market) or iShares AGG provide broad exposure including government bonds.
- • Investment-grade corporate bonds: slightly higher yield than government bonds in exchange for slightly higher credit risk. Still considered high quality. Provide income above what pure government bonds offer.
- • Short-to-medium duration: the duration (sensitivity to interest rate changes) of the bond allocation significantly affects its behaviour in rising-rate environments. Alphaex Capital recommends keeping average duration under five years to balance yield and interest-rate risk.
Alphaex Capital, March 2026: Blend government and investment-grade corporate bonds, keep average duration under five years, and cap any individual bond issue at 15% of the bond allocation to balance yield and credit risk.
The 2022 Crisis: When the 60/40 Almost Broke
The single most important stress test the 60/40 portfolio has faced in recent decades was 2022. In that year, the Federal Reserve raised interest rates aggressively — from near zero to 4.5 percent in twelve months — in response to inflation reaching a 40-year high of approximately 9 percent. This created a specific and devastating environment for the 60/40 portfolio.The equity allocation fell as higher interest rates reduced the present value of future earnings and slowed economic activity: the S&P 500 fell 18.1 percent. The bond allocation also fell — sharply — as rising interest rates reduced the value of existing bonds: the Bloomberg US Aggregate Bond Index fell approximately 13 percent in 2022, its worst drawdown in history. Both asset classes fell simultaneously. The stock-bond correlation flipped positive. The 60/40 portfolio declined 17.5 percent — its worst year since 1937 and fourth worst in 200 years.
Morgan Stanley's analysis found that historical data shows an 80 percent probability of positive returns in the two years following a year of negative returns for both stocks and bonds. That probability proved accurate. The portfolio recovered 17.2 percent in 2023 — well above its historical median of 7.8 percent. By September 2024, the global 60/40 was back in positive territory with a cumulative 29.7 percent return since year-end 2022, according to Vanguard.
The 2023-2026 Comeback: Why It's Working Again
The recovery of the 60/40 portfolio from its 2022 low has been driven by two factors that make the strategy more fundamentally sound today than at any point in the preceding decade.First, bond yields are meaningfully positive for the first time since the post-2008 era of near-zero interest rates. Before 2022, a 10-year US Treasury bond yielded less than 1 percent. Today, yields are substantially higher, meaning the 40 percent bond allocation is generating real income that contributes positively to total return. The cushion against equity declines is larger because the income return from bonds is larger.
Second, the stock-bond correlation normalised. By late 2025, the 12-month stock-bond correlation had fallen from its peak of 0.80 in mid-2024 to just 0.16. Bonds were again behaving like bonds: providing positive returns when equities fell. Morningstar's December 2025 markets brief described 2025 as especially good for investors whose portfolios blend stocks and bonds, as both asset classes posted solid gains with the Morningstar US Core Bond Index up approximately 7 percent. The PortfoliosLab data confirms the recovery: 9.47 percent annualised over the 10 years to July 2026.
Vanguard's October 2024 analysis summarised the outlook: while strong equity returns have driven the 60/40 over the past decade and have pushed equity valuations back to high levels, they expect more proportional contributions from each asset class over the next 10 years. This is a positive assessment: it means the 40 percent bond slice is expected to carry more of the return than it did during the near-zero yield era.
The Key Metrics: Sharpe Ratio, Volatility, and Drawdown
Three metrics explain why the 60/40 portfolio is often described as superior on a risk-adjusted basis to a 100 percent equity portfolio, even though it generates lower absolute returns over very long periods.Sharpe Ratio
The Sharpe ratio measures return per unit of risk (volatility). As of July 2026, the 60/40 portfolio's Sharpe ratio is 1.46, placing it between the 25th and 75th percentiles of broad market portfolios, according to PortfoliosLab. This indicates balanced, middle-of-the-road risk-adjusted performance — not exceptional, but consistent. A 100 percent equity portfolio would typically show a lower Sharpe ratio (more return volatility per unit of return) and a 100 percent bond portfolio would show a lower absolute return.Volatility Reduction
Alphaex Capital's analysis shows that a 60/40 allocation cuts volatility by roughly one-third compared to an all-stock portfolio. This means the swings in account value are meaningfully gentler, which is not just emotionally preferable: it reduces the probability of an investor panic-selling at a market trough, which is the single most common way investors destroy long-term returns.Maximum Drawdown
The worst single-month return for the 60/40 portfolio since 2007 was -11.4 percent in October 2008, according to PortfoliosLab. This compares to an S&P 500 decline of approximately 17 percent in the same month. The same protection applied in 2022: the 60/40 fell 17.5 percent while a 100 percent US equity portfolio fell approximately 20 percent. The reduction in maximum drawdown is what allows long-term investors to remain invested through crises.Is the 60/40 Portfolio Right for You?
The 60/40 portfolio is specifically suited to investors with a moderate risk tolerance, a medium-to-long investment time horizon (typically five or more years), and a goal of building wealth over time without the full volatility exposure of an all-equity portfolio. It is not appropriate for all investors:- Young investors with a 30-plus-year horizon may accept more risk for higher long-term returns: a 70/30 or 80/20 allocation tilts toward equity without abandoning the diversification benefit.
- Investors close to or in retirement may prefer a more conservative allocation: 50/50 or 40/60 reduces equity volatility and generates more income from the bond slice.
- Investors who cannot tolerate any significant drawdown — who would panic-sell in a 17 percent decline — should consider a more conservative portfolio or hold a larger cash allocation.
- Investors with a very short time horizon (less than three years) should hold a significantly higher bond and cash allocation than the 60/40 implies.
Modern Variations: When Investors Tweak the Split
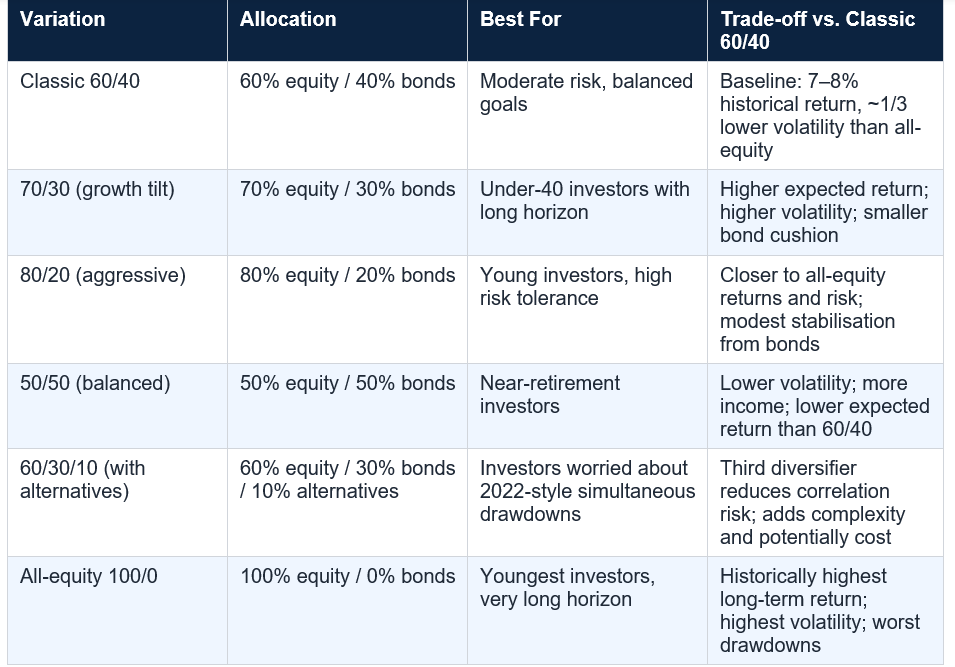
How to Build a 60/40 Portfolio Practically
Building a 60/40 portfolio does not require sophisticated expertise or large initial capital. The practical implementation for most individual investors:- Choose a brokerage with commission-free ETF trading and no account minimum. Fidelity, Schwab, and Vanguard are the three most commonly recommended for cost-conscious 60/40 investors.
- The simplest 60/40: one equity fund and one bond fund. Example: Vanguard VTI (total US market, 0.03% expense ratio) for the 60 percent, and Vanguard BND (total US bond market, 0.03% expense ratio) for the 40 percent.
- A more globally diversified version: Vanguard VT (total world equity) for the 60 percent, Vanguard BNDW (global bond market) for the 40 percent.
- Rebalance when the allocation drifts more than 5 percent from target: Alphaex Capital recommends quarterly checks and rebalancing when equity or bond weight drifts more than 5 percent from the 60/40 target.
- In a tax-advantaged account (Roth IRA, 401k, UK Stocks and Shares ISA), rebalancing has no tax implications. In a taxable account, rebalancing by selling appreciated assets triggers capital gains. Consider directing new contributions to the under-weighted asset class to rebalance without selling.
- Total annual cost of a two-ETF 60/40 portfolio using the funds above: approximately 0.03 to 0.06 percent per year. This is one of the lowest-cost investment strategies available to any investor.
Conclusion
Two centuries of market data, 9.47 percent annualised returns over the past decade, a recovery from the worst year since 1937, and a Sharpe ratio that puts it squarely in the middle of the market's risk-adjusted performance range: the 60/40 portfolio is not a relic. It is a resilient, well-understood, and well-documented investment framework that continues to deliver for the investors it is designed to serve.The 2022 crisis was a genuine test. Both stocks and bonds fell simultaneously, the correlation structure broke, and the portfolio declined 17.5 percent. The response proved the strategy's resilience: a 17.2 percent recovery in 2023, followed by two consecutive 15 percent years in 2024 and 2025, restored and exceeded the previous peak. The stock-bond correlation has normalised. Bond yields are meaningfully positive. The framework that was declared dead in 2022 is, in 2026, working exactly as its designers intended.
For investors with a moderate risk tolerance, a multi-year time horizon, and a goal of building wealth without the full volatility of an all-equity portfolio, the 60/40 remains the best-evidenced starting point available. It is not perfect for every investor or every market environment. But two hundred years of evidence suggests it is more durable than most of the alternatives.
Frequently Asked Questions
What is a 60/40 portfolio?A 60/40 portfolio is an investment portfolio that allocates 60 percent of its total value to equities (stocks) and 40 percent to fixed-income securities (bonds). The equity allocation provides long-term growth, while the bond allocation provides stability, income, and a counterweight to equity volatility. It is described by Morningstar as the portfolio investors with a moderate risk tolerance are typically going to end up in, and is the most commonly used benchmark for balanced investment strategies.
What returns has the 60/40 portfolio historically delivered?
Historically, a 60/40 portfolio has delivered an average annual return of approximately 7 to 8 percent over 200 years of market data. The 10-year average rolling return has been 7.8 percent and has rarely fallen below 5 percent annualised over any 10-year period. More recently: 2025 returned approximately 15%, 2024 approximately 15%, 2023 returned 17.2% (above the historical median), and 2022 was the worst year since 1937 at -17.5%. The annualised 10-year return to July 2026 was 9.47% according to PortfoliosLab.
Why do stocks and bonds work together in a 60/40 portfolio?
The 60/40 portfolio works because stocks and bonds historically tend to be negatively correlated: when stock prices fall (typically during economic downturns or market panics), investors move money into the relative safety of bonds, pushing bond prices up. This means the bond half of the portfolio cushions the decline of the equity half. This negative correlation is not guaranteed — as 2022 demonstrated, when both fell simultaneously — but the stock-bond 12-month correlation had normalised to just 0.16 by late 2025, suggesting bonds are again providing their traditional diversification benefit.
What happened to the 60/40 portfolio in 2022?
In 2022, the 60/40 portfolio declined 17.5 percent — its worst year since 1937 and the fourth worst in 200 years of data. This was caused by the Federal Reserve's aggressive interest rate hikes (from near zero to 4.5% in twelve months) in response to 40-year high inflation. The rate hikes caused both stocks (S&P 500 -18.1%) and bonds (US Aggregate Bond Index -13%) to fall simultaneously, breaking the negative correlation that normally cushions equity declines. The portfolio recovered strongly: +17.2% in 2023 and approximately +15% in each of 2024 and 2025.
How do I build a simple 60/40 portfolio?
The simplest 60/40 portfolio requires just two index funds: one broad equity fund for the 60 percent (such as Vanguard VTI for the total US market) and one broad bond fund for the 40 percent (such as Vanguard BND for the total US bond market). Both funds have expense ratios of approximately 0.03 percent per year. Most major brokerages including Fidelity, Schwab, and Vanguard offer these with no account minimum and no trading commissions. Rebalance when the allocation drifts more than 5 percent from the 60/40 target.
Is the 60/40 portfolio still a good strategy in 2026?
Yes, for investors with a moderate risk tolerance and a multi-year time horizon. The conditions that make the 60/40 work — meaningful bond yields and a normalising stock-bond correlation — are back in place in 2026. Bond yields are substantially higher than in the near-zero era of 2020-2021, meaning the 40% bond allocation provides real income as well as diversification. The stock-bond 12-month correlation had fallen to 0.16 by late 2025. The 10-year annualised return to July 2026 was 9.47%, above the long-term historical average.
What is the difference between a 60/40 and a 70/30 portfolio?
A 70/30 portfolio allocates 70 percent to equities and 30 percent to bonds, compared to the 60/40's 60 percent equity allocation. The higher equity weight means a 70/30 portfolio has a higher expected long-term return but also higher volatility — larger drawdowns in bad years. Alphaex Capital's March 2026 analysis describes the 70/30 as particularly appropriate for investors under 40 who have decades until retirement, can tolerate more short-term volatility, and want to capture more equity upside while still maintaining meaningful bond exposure.
What is the Sharpe ratio of a 60/40 portfolio?
As of July 2026, the Sharpe ratio of a standard 60/40 portfolio was 1.46, placing it between the 25th and 75th percentiles of broad market portfolios, according to PortfoliosLab. The Sharpe ratio measures return per unit of risk (volatility): a higher Sharpe ratio means more return for each unit of risk taken. The 60/40 portfolio's Sharpe ratio is typically higher than a 100 percent equity portfolio's because the bond allocation reduces volatility by approximately one-third, improving the return-to-risk ratio even though absolute returns are somewhat lower.
0 Comments
Be the first to share your thoughts on this article.