

AI for business
How to Measure AI Productivity Beyond Surveys
80% of companies are not actively measuring the ROI of AI. Most rely on surveys — and surveys are the least reliable signal available. A randomised controlled trial found that AI tools increased task completion time by 19% while developers perceived a 20% speedup. Self-report and reality moved in opposite directions. Here is how to measure what AI is actually doing to your productivity, with objective data, before/after baselines, and the five-link measurement chain that turns AI spend into a number a CFO can act on.

ActivTrak’s May 2026 research document makes the situation plain: 80% of companies are not actively measuring the ROI of AI. Not poorly measuring it. Not measuring it at all in any objective sense. 88% of organisations use AI in at least one function (McKinsey State of AI 2025), and 66% report productivity and efficiency gains from AI (Deloitte 2026). But as agility-at-scale.com (February 2026) notes precisely: ‘Reporting gains and proving them are different things.’
The specific evidence for why surveys fail as AI productivity measures comes from a randomised controlled trial that should reframe every conversation about AI self-assessment. The METR study, conducted February–June 2025 with 16 experienced developers, found that AI tools increased task completion time by 19% while developers simultaneously perceived a 20% speedup (blog.exceeds.ai, April 2026). Self-report and objective measurement moved in opposite directions. Workers thought they were faster. They were slower. If a survey had been the only measurement instrument, the conclusion would have been precisely wrong.
This guide documents the objective measurement methods that replace or supplement surveys: task-level time capture, throughput and cycle time tracking, output quality indicators, adoption depth proficiency scoring, behavioural workflow data, and function-level financial ROI. Together, they constitute what Larridin (March 2026) calls the five-link AI ROI measurement chain — the structure that turns AI spend from a faith-based budget line into a portfolio with measurable returns.
80% of companies not actively measuring AI ROI (ActivTrak May 2026). 88% use AI in at least one function; only 1 in 3 scaling enterprise-wide (McKinsey 2025). 66% report gains (Deloitte 2026) — but reporting is not proving. METR RCT (16 developers, Feb–Jun 2025): AI tools increased task completion by 19% while developers perceived a 20% speedup — self-report contradicted objective measurement (blog.exceeds.ai April 2026).
The METR randomised controlled trial is the clearest demonstration of this gap. The study is notable for its rigour: it was a proper randomised controlled trial with 16 experienced developers, conducted over five months, with actual task completion times measured against perceived task completion times. The finding — a 19% objective slowdown alongside a 20% perceived speedup — is not a small discrepancy. It is a sign reversal. The direction of the measured effect was opposite to the direction of the perceived effect.
Why does this happen? Several mechanisms create the gap between perceived and actual AI productivity:
If a customer research task now takes 40 minutes with AI and previously took 3 hours without it, that is a 78% time reduction and a compelling ROI number. But if you did not document that the task took 3 hours before deploying AI, you cannot make that claim with evidence. You can only make it with a survey, where the employee estimates the previous time from memory. That estimate is unreliable in the same way all retrospective self-report is unreliable.
Establishing baselines before deployment is the prerequisite for every objective measurement method in this guide. Practically, this means:
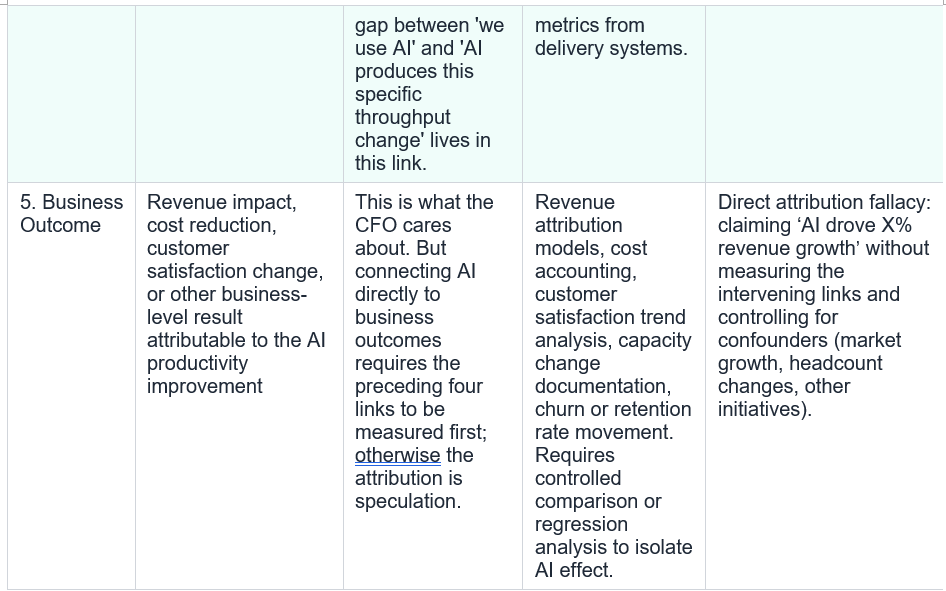
Larridin’s March 2026 analysis is direct about the structural problem: ‘Most enterprises skip the middle of this chain, which is exactly where the signal lives.’ Links 2, 3, and 4 — adoption depth, proficiency, and productivity signal — are where the actionable data lives. Skipping them produces a measurement gap that surveys cannot close.
How to implement task-level time measurement in practice:
The DX Q1 2026 data across 400+ companies provides the benchmark context: daily AI users averaged 2.4 pull requests per week, compared to approximately 1.3 for light users. Even as AI usage increased by 65%, median PR throughput grew by about 8% — most organisations were in the 5–15% range (getdx.com). These are meaningful but not transformative gains, and they are real precisely because they are measured from system telemetry rather than self-report.
The critical qualifier from blog.exceeds.ai (April 2026) applies directly here: ‘DORA metrics like lead time and deployment frequency often remain flat despite AI adoption, underscoring the need for code-level analytics.’ Throughput is necessary but not sufficient. The same team can produce more pull requests while those pull requests are lower quality, require more rework, or address lower-priority features. Throughput metrics must always be accompanied by quality metrics to avoid the activity-inflation trap.
How to track throughput without a survey: pull weekly and monthly output counts from your project management system (Jira, Linear, Asana, GitHub), CRM (Salesforce, HubSpot), or content management platform. Set a 12-week pre-AI baseline, then track the same metric post-deployment. Segment by AI user vs non-AI user and by daily active vs light user to isolate the AI effect from other variables.
Specific quality indicators by function:
Adoption depth is measured on a spectrum, not a binary:
ActivTrak’s fifth annual State of the Workplace report — drawing on 443 million hours of work activity across 1,111 organisations and 163,638 employees over three years — provides the most comprehensive behavioural picture of what AI is actually doing to work patterns (activtrak.com, May 2026). The findings are nuanced and would not have been visible from survey data alone:
The ROI formula itself is straightforward: (Net Return – Cost) ÷ Cost × 100. Applying it honestly at the function level requires:
GetDX.com’s implementation of this approach at a major financial services company is the clearest published example: ‘Using this methodology, one major financial services company found that engineers using AI tools showed a 30% increase in pull request throughput year-over-year, compared to just 5% among non-adopters. This same-engineer approach is the clearest way to isolate how AI tools directly affect developer productivity.’
The same-person methodology works for any measurable repeating task: a customer service agent’s ticket resolution rate before and after AI-assisted response tooling; a content creator’s draft-to-publication time before and after AI writing assistance; a finance analyst’s time to complete monthly close activities before and after AI data aggregation. The requirement is that the task type remains comparable across the measurement periods and that no other significant variables changed simultaneously.
The Larridin (March 2026) framework adds the proficiency dimension to the same-person methodology: tracking not just whether the same person is more productive with AI, but whether they are becoming more proficient over time. A new AI user producing 15% throughput gains in month one who produces 40% gains in month six is a different investment thesis than one who remains at 15% throughout. The trajectory of proficiency improvement is itself a measurement signal.
Larridin’s March 2026 analysis frames the competitive consequence: ‘The companies that win the 2026 budget cycle won’t be the ones with the best AI tools. They’ll be the ones who can prove their AI tools are working — with data, not surveys.’
The METR randomised controlled trial result — a 19% objective slowdown alongside a 20% perceived speedup — should be the empirical anchor for every AI productivity conversation. It establishes that worker self-report is not a reliable signal for AI impact. It does not mean AI cannot produce genuine productivity gains; the DX data showing 30% PR throughput increases for AI adopters in a controlled same-engineer comparison, and the ActivTrak data showing 5% more productive hours even in a compressed workday, demonstrate that genuine gains exist and are measurable. The gains are real, but they are smaller and more variable than surveys suggest, and they are unequally distributed between proficiency levels in ways that surveys cannot detect.
The measurement chain — spend, adoption depth, proficiency, productivity signal, business outcome — is not a research project. It is a five-to-eight metric dashboard, populated from systems that most organisations already have, updated weekly or monthly, segmented by function and proficiency level. The organisations that build it will make better AI investment decisions, identify where coaching can lift the 10–50× variation between power users and beginners, and prove to their CFOs that AI budget deserves expansion rather than scrutiny. That is a different conversation than ‘we asked people and they said it was helpful.’
Because self-reported AI productivity data is systematically unreliable — and not in a random, noise-like way but in a directionally misleading way. The METR randomised controlled trial (February–June 2025, 16 experienced developers) found that AI tools increased actual task completion time by 19% while developers simultaneously reported a perceived speedup of 20% (blog.exceeds.ai, April 2026). The direction of the measured effect was opposite to the direction of the self-reported effect. Other mechanisms that make surveys unreliable: effort mismatch (AI reduces cognitive effort, which feels like speed even when elapsed time increases); activity inflation (more drafts, more commits, more emails initiated does not equal more valuable output per hour); and comprehension displacement (developers using AI to learn libraries scored 17% lower on comprehension tests — they felt productive while losing capability). Surveys are useful for understanding adoption barriers and user experience, but they are not a reliable substitute for objective productivity measurement.
What is the missing baseline problem and how do we solve it?
The missing baseline problem is the failure to document process performance before deploying AI — making it impossible to calculate the genuine before/after difference after deployment. Agility-at-scale.com (February 2026) identifies it as the single most common AI measurement failure: 'Without pre-AI documentation of the processes AI will affect, every ROI claim is anecdotal.' To solve it prospectively: identify the specific tasks AI will be applied to, measure actual elapsed time for 10+ completions of each before deployment, record error and revision rates, pull throughput data from your delivery systems, and document all of this in a baseline measurement document. If you are post-deployment without baselines: conduct baseline measurement on the tasks AI has not yet been applied to in your organisation, then introduce AI to those tasks next and measure the delta. This gives you a controlled comparison even post-deployment.
What is the five-link AI ROI measurement chain?
Developed by Larridin (March 2026), the five-link chain is the structural framework that maps AI spend to business outcomes through the intervening steps that most organisations skip. The links are: (1) Spend — all costs of AI investment including licences, implementation, training, and support; (2) Adoption Depth — not just whether employees have access but how frequently and skillfully they use AI tools; (3) Proficiency — how effectively individual users apply AI tools, recognising that power users generate 10–50× more value than beginners from the same tools; (4) Productivity Signal — objective, task-level evidence of changed output volume, speed, or quality; and (5) Business Outcome — revenue impact, cost reduction, customer satisfaction change, or other business-level result. Most organisations measure only links 1 and 5 and try to connect them directly, which produces anecdotal ROI claims rather than defensible data.
What does 'same-person methodology' mean for AI measurement?
The same-person methodology compares an individual's output before and after AI adoption, rather than comparing AI users to non-AI users across teams or roles. This eliminates confounders that make cross-team comparison unreliable — seniority, tenure, team culture, project complexity, seasonal variation. GetDX implemented this approach at a major financial services company and found a 30% year-over-year increase in pull request throughput for AI-using engineers, compared to 5% for non-adopters. Comparing the same engineer to their own pre-AI baseline is the clearest available way to isolate AI's direct effect. For non-engineering functions, the same methodology applies: track a customer service agent's ticket resolution rate before and after AI assistance, a content creator's time to publication-ready draft before and after AI writing tools, or a finance analyst's time to complete monthly close activities before and after AI data aggregation. The requirement is comparable task types and no simultaneous confounding changes.
How do we translate AI time savings into a number the CFO will accept?
Three steps: (1) Measure the time saving on a specific, named, repeating task — not 'productivity is better' but 'customer research reports went from 3 hours to 40 minutes per completion.' (2) Calculate the annualised volume of that task type: '40 researchers each complete approximately 5 reports per month = 2,400 completions per year.' (3) Multiply time saving by volume and by loaded hourly cost: '2,400 × 2h20m saving × $75 loaded rate = $420,000 in annual capacity saved.' That is the format CFOs respond to — specific, auditable, based on timed measurement rather than survey estimate. The same methodology applies to quality savings: calculate the cost of rework or error correction per incident, then multiply by the reduction in incident rate. Function-level ROI in this format — with the cost of the AI investment clearly accounted for — is the basis for expanding, reducing, or redirecting AI budget.
What metrics should we avoid when measuring AI productivity?
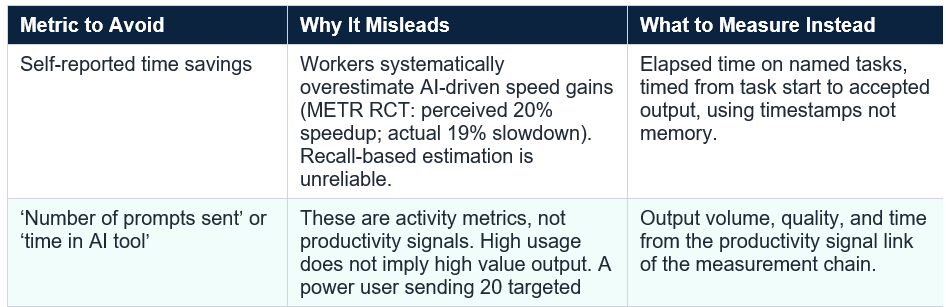
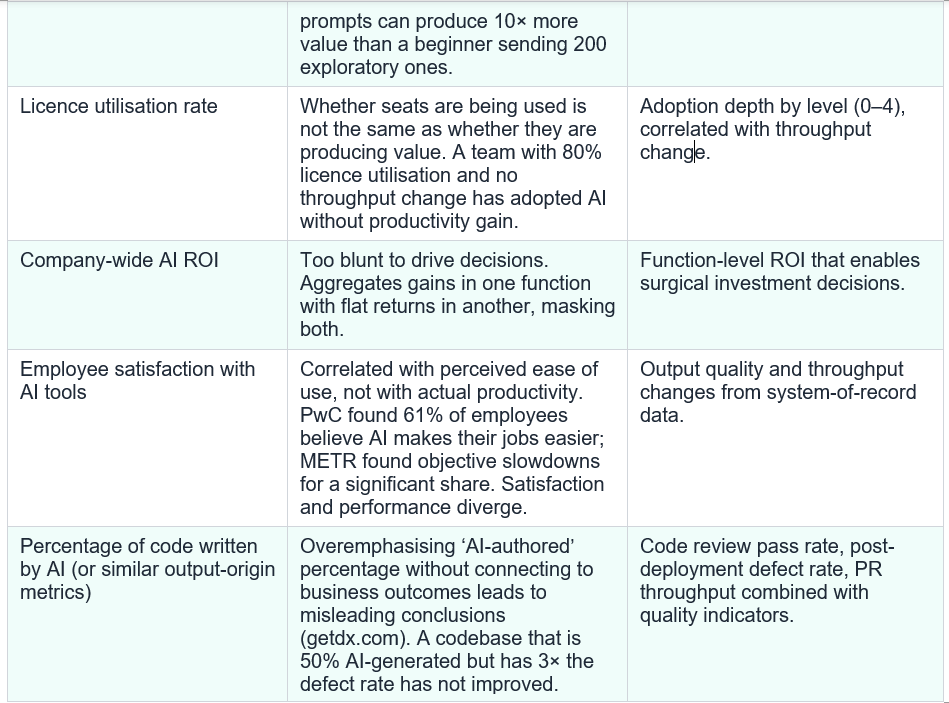
Six metrics that produce misleading conclusions: (1) Self-reported time savings — systematically overstated (METR RCT: perceived 20% speedup, actual 19% slowdown). (2) Prompts sent or time in AI tool — activity metrics, not productivity signals; high usage does not imply high-value output. (3) Licence utilisation rate — whether seats are used says nothing about whether they are producing value. (4) Company-wide AI ROI — too blunt; aggregates high-return functions with flat-return functions, masking both. (5) Employee satisfaction with AI tools — correlated with perceived ease, not actual productivity; 61% of employees feel AI makes their jobs easier (PwC) while objective data shows more varied results. (6) Percentage of code or content written by AI — overemphasising origin without connecting to quality metrics leads to misleading conclusions (getdx.com). Replace these with throughput from system-of-record data, quality gate pass rates, task-level elapsed time logs, and function-level financial ROI calculations.
Table of Contents
- The Survey Problem
- Why Self-Reported AI Productivity Data Is Unreliable
- The Missing Baseline Problem
- The Five-Link AI ROI Measurement Chain
- Metric 1: Task-Level Time Measurement
- Metric 2: Throughput and Cycle Time
- Metric 3: Output Quality Indicators
- Metric 4: Adoption Depth and Proficiency
- Metric 5: Workflow Behavioural Data
- Metric 6: Function-Level Financial ROI
- The Same-Person Methodology: Isolating AI’s True Effect
- What Not to Measure (and Why)
- Building Your AI Measurement Dashboard
- Conclusion: The Data That Changes the Budget Conversation
- Frequently Asked Questions
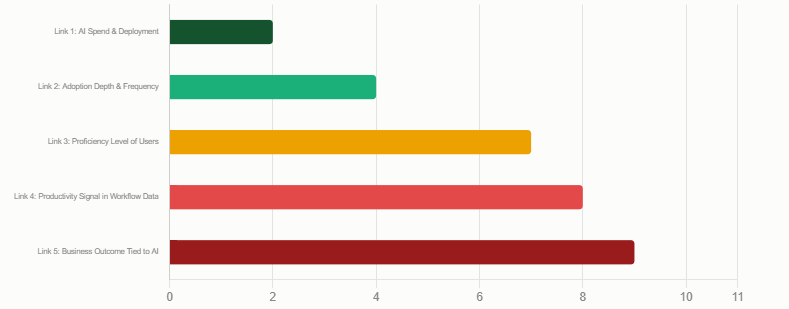
The 5 - Link Measurement Chain: From SPend To Outcome
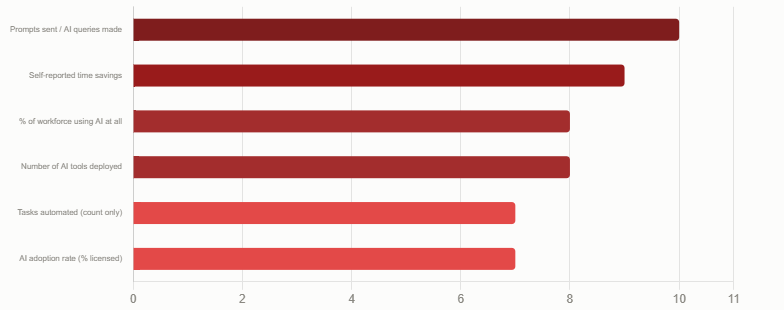
6 Misleading AI metrices And What To Measure Instead
The Survey Problem
Ask most organisations how they know AI is working and the answer is usually some version of: ‘We asked people, and they said it was helpful.’ This is a survey. It is also the least reliable signal available for measuring productivity. And yet it is the default.ActivTrak’s May 2026 research document makes the situation plain: 80% of companies are not actively measuring the ROI of AI. Not poorly measuring it. Not measuring it at all in any objective sense. 88% of organisations use AI in at least one function (McKinsey State of AI 2025), and 66% report productivity and efficiency gains from AI (Deloitte 2026). But as agility-at-scale.com (February 2026) notes precisely: ‘Reporting gains and proving them are different things.’
The specific evidence for why surveys fail as AI productivity measures comes from a randomised controlled trial that should reframe every conversation about AI self-assessment. The METR study, conducted February–June 2025 with 16 experienced developers, found that AI tools increased task completion time by 19% while developers simultaneously perceived a 20% speedup (blog.exceeds.ai, April 2026). Self-report and objective measurement moved in opposite directions. Workers thought they were faster. They were slower. If a survey had been the only measurement instrument, the conclusion would have been precisely wrong.
This guide documents the objective measurement methods that replace or supplement surveys: task-level time capture, throughput and cycle time tracking, output quality indicators, adoption depth proficiency scoring, behavioural workflow data, and function-level financial ROI. Together, they constitute what Larridin (March 2026) calls the five-link AI ROI measurement chain — the structure that turns AI spend from a faith-based budget line into a portfolio with measurable returns.
80% of companies not actively measuring AI ROI (ActivTrak May 2026). 88% use AI in at least one function; only 1 in 3 scaling enterprise-wide (McKinsey 2025). 66% report gains (Deloitte 2026) — but reporting is not proving. METR RCT (16 developers, Feb–Jun 2025): AI tools increased task completion by 19% while developers perceived a 20% speedup — self-report contradicted objective measurement (blog.exceeds.ai April 2026).
Why Self-Reported AI Productivity Data Is Unreliable
The reliability problem with surveys as the primary AI productivity measurement instrument is not just about social desirability bias (though that exists). It is more fundamental: the data that surveys capture — perceived helpfulness, felt time savings, reported satisfaction — does not measure the same thing as productivity.The METR randomised controlled trial is the clearest demonstration of this gap. The study is notable for its rigour: it was a proper randomised controlled trial with 16 experienced developers, conducted over five months, with actual task completion times measured against perceived task completion times. The finding — a 19% objective slowdown alongside a 20% perceived speedup — is not a small discrepancy. It is a sign reversal. The direction of the measured effect was opposite to the direction of the perceived effect.
Why does this happen? Several mechanisms create the gap between perceived and actual AI productivity:
- Effort mismatch: AI tools reduce the cognitive effort required for certain tasks, which feels like going faster even when calendar time is unchanged or longer. The mental work is easier; the actual output does not arrive sooner.
- Attention fragmentation: ActivTrak’s 443-million-hour behavioural dataset found that while productive hours increased 5% (to 6 hours 36 minutes daily), focus efficiency declined to a three-year low of 60% as collaboration surged 34% and multitasking rose 12% (activtrak.com May 2026). AI tools added capacity but also added context-switching overhead that workers do not perceive as a cost.
- Activity inflation: increased activity volume (more pull requests opened, more documents drafted, more emails initiated) is often mistaken for increased productivity. The blog.exceeds.ai April 2026 analysis found that DORA metrics — software delivery lead time and deployment frequency — often remain flat despite increased activity, ‘underscoring that increased activity volume does not equal increased throughput.’
- Comprehension displacement: the METR study found developers who used AI assistance to learn new coding libraries scored 17% lower on comprehension tests. AI produced the code; developers felt productive. But the learning that would have built future capability was displaced. Surveys capture the positive feeling; comprehension tests capture the cost.
The Missing Baseline Problem
Before discussing what to measure, the most important enabling condition: you cannot measure AI’s impact without knowing what the pre-AI state looked like. Agility-at-scale.com (February 2026) identifies this as ‘the single most common AI measurement failure’ — the Missing Baseline Problem. ‘Without pre-AI documentation of the processes AI will affect, every ROI claim is anecdotal.’If a customer research task now takes 40 minutes with AI and previously took 3 hours without it, that is a 78% time reduction and a compelling ROI number. But if you did not document that the task took 3 hours before deploying AI, you cannot make that claim with evidence. You can only make it with a survey, where the employee estimates the previous time from memory. That estimate is unreliable in the same way all retrospective self-report is unreliable.
Establishing baselines before deployment is the prerequisite for every objective measurement method in this guide. Practically, this means:
- Document the current time required for a representative sample of the tasks AI will affect. Time-box at least 5–10 repetitions of each task type before deployment.
- Record error rates, revision rates, or rework cycles for outputs AI will touch — before AI touches them.
- Pull throughput data from existing systems: pull request volumes, tickets closed, documents processed, emails handled, decisions made per period. This is your pre-AI throughput baseline.
- Capture focus time and deep work periods using existing productivity analytics (calendar data, time-tracking tools, activity analytics platforms) before deploying AI tools that will change those patterns.
The Five-Link AI ROI Measurement Chain
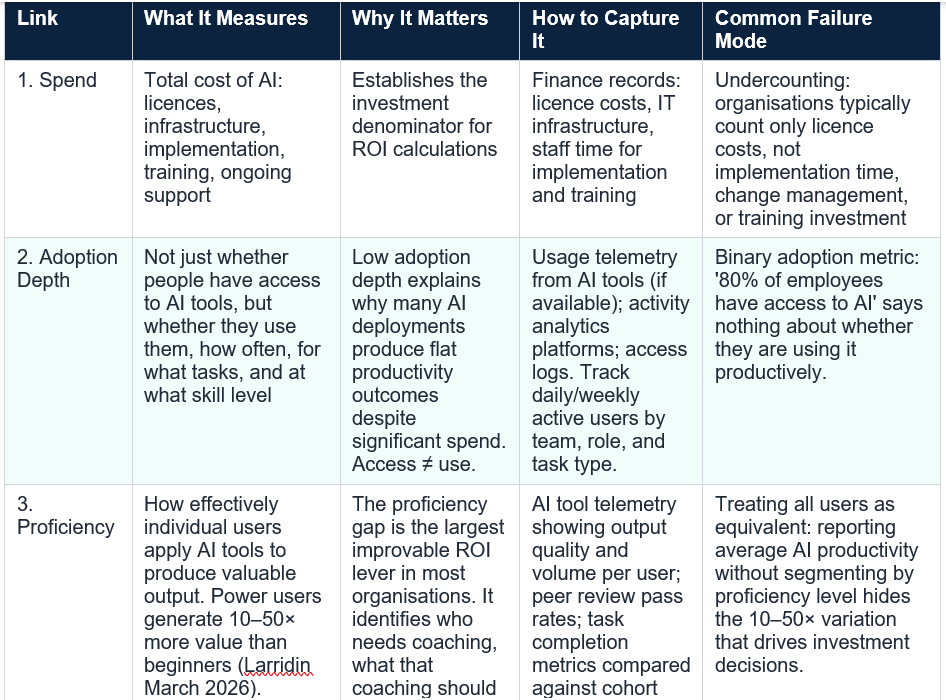
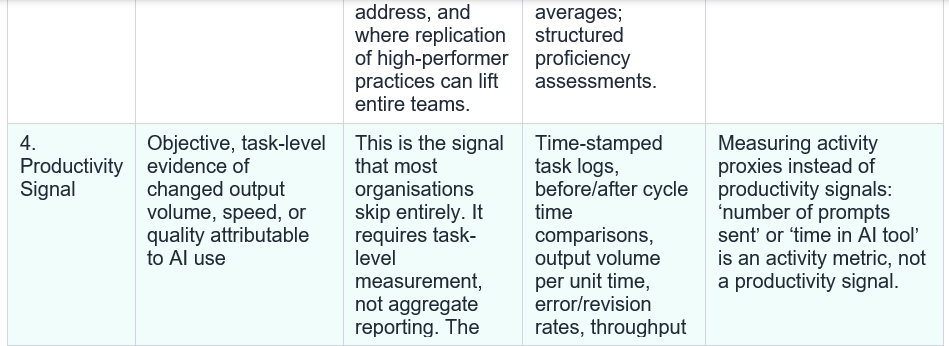
Larridin (March 2026) provides the most useful structural framework for AI productivity measurement: a five-link chain that maps from input to outcome. The problem in most organisations is that they measure only the first link (spend) and the last link (business outcome), and try to connect them directly — which does not work because the chain is too long and too many confounders lie between them.Larridin’s March 2026 analysis is direct about the structural problem: ‘Most enterprises skip the middle of this chain, which is exactly where the signal lives.’ Links 2, 3, and 4 — adoption depth, proficiency, and productivity signal — are where the actionable data lives. Skipping them produces a measurement gap that surveys cannot close.
Metric 1: Task-Level Time Measurement
Metric 1: Before/After Time-to-Complete on Named, Repeatable Tasks The highest-fidelity AI productivity signal available — and the one most CFOs will respond to. Identify the specific tasks AI is supposed to accelerate, measure how long they take without AI (before deployment), and measure how long the same tasks take with AI (after deployment). 'Customer research went from 3 hours to 40 minutes' is a number a CFO can act on (Larridin March 2026). It converts AI investment into a per-task time saving that multiplies across volume to produce capacity hours or cost equivalent.How to implement task-level time measurement in practice:
- Step 1: List the specific recurring task types that AI tools will be applied to. Be granular: not ‘writing’ but ‘drafting a 500-word client proposal section’; not ‘research’ but ‘compiling competitive intelligence for a new account’.
- Step 2: Measure actual elapsed time for at least 10 completions of each task type before deploying AI. Use time-logging tools, calendar entries, or task management timestamps — not self-report estimation.
- Step 3: After deploying AI, measure the same tasks with the same methodology. Elapsed time, not perceived time.
- Step 4: Calculate time delta per task type. Multiply by the weekly or monthly volume of that task type to calculate the total capacity hours recovered per team or function.
- Step 5: Translate capacity hours to cost equivalent (hours × average loaded hourly rate) or to value equivalent (what did those hours produce when reallocated to higher-value work?).
Metric 2: Throughput and Cycle Time
Metric 2: Output Volume and Delivery Speed From Systems of Record Pull the data that already exists in your delivery systems — before and after AI deployment. For engineering teams: pull request volume, merge frequency, deployment frequency, lead time from commit to production. For content teams: articles published per month, average time from brief to draft. For sales: proposals generated per rep per week, time from lead to first contact. For customer service: tickets resolved per agent per day, average resolution time. These numbers live in your project management, CRM, and delivery systems. They do not require anyone to estimate anything.The DX Q1 2026 data across 400+ companies provides the benchmark context: daily AI users averaged 2.4 pull requests per week, compared to approximately 1.3 for light users. Even as AI usage increased by 65%, median PR throughput grew by about 8% — most organisations were in the 5–15% range (getdx.com). These are meaningful but not transformative gains, and they are real precisely because they are measured from system telemetry rather than self-report.
The critical qualifier from blog.exceeds.ai (April 2026) applies directly here: ‘DORA metrics like lead time and deployment frequency often remain flat despite AI adoption, underscoring the need for code-level analytics.’ Throughput is necessary but not sufficient. The same team can produce more pull requests while those pull requests are lower quality, require more rework, or address lower-priority features. Throughput metrics must always be accompanied by quality metrics to avoid the activity-inflation trap.
How to track throughput without a survey: pull weekly and monthly output counts from your project management system (Jira, Linear, Asana, GitHub), CRM (Salesforce, HubSpot), or content management platform. Set a 12-week pre-AI baseline, then track the same metric post-deployment. Segment by AI user vs non-AI user and by daily active vs light user to isolate the AI effect from other variables.
Metric 3: Output Quality Indicators
Metric 3: Error Rates, Revision Rates, and Acceptance Rates Quantity without quality is a trap. More pull requests that fail code review, more first drafts that require heavy editing, more customer service responses that escalate — these are not productivity gains. They are activity inflation. Quality metrics prevent this error by measuring not just what was produced but how much of it passed the next gate.Specific quality indicators by function:
- Engineering: code review pass rate (percentage of PRs approved without revision requests), bug rate in AI-authored code vs baseline, post-deployment defect rate.
- Content / marketing: editor revision rate on AI-assisted first drafts (the percentage of text changed before publication); fact-check failure rate; time from first draft to publication-ready.
- Customer service: first-contact resolution rate (did AI-assisted responses resolve the issue without escalation or follow-up?); customer satisfaction score on AI-assisted interactions vs non-AI interactions.
- Sales: proposal acceptance rate (did AI-generated proposals convert at the same or higher rate than hand-crafted ones?); time-to-response on AI-drafted emails vs manually written ones; deal velocity.
- Legal and compliance: review cycle count (how many rounds of revision before sign-off?); error rate in AI-drafted contracts or summaries vs baseline.
Metric 4: Adoption Depth and Proficiency
Metric 4: How Skilled Are Your AI Users, Not Just Whether They Have Access The proficiency gap is the largest improvable ROI lever in most AI deployments. Larridin (March 2026) documents that power users generate 10–50× more value than beginners from the same AI tools. This is not a fixed property of individuals — it is directly improvable through targeted coaching. But you cannot coach the right people or in the right areas without measuring proficiency, not just access.Adoption depth is measured on a spectrum, not a binary:
- Level 0: Has access to AI tool but has not used it in the measurement period.
- Level 1: Occasional user — uses AI for simple, isolated tasks less than once per week.
- Level 2: Regular user — uses AI daily for a defined set of tasks.
- Level 3: Integrated user — AI is embedded in their primary workflow; significant share of work product involves AI at some stage.
- Level 4: Power user — uses AI across multiple task types, customises prompts, chains AI tasks, and produces output that demonstrably outperforms non-AI baseline.
Metric 5: Workflow Behavioural Data
Metric 5: Objective Signals From How Work Actually Happens — Not How People Report It Workplace analytics platforms (including ActivTrak, Microsoft Viva, and others) capture how work patterns change after AI deployment — without asking anyone. They measure collaboration patterns, focus time duration, application switching frequency, context-switching rate, and time allocation across task categories. This is the closest thing to an objective productivity audit at the workflow level.ActivTrak’s fifth annual State of the Workplace report — drawing on 443 million hours of work activity across 1,111 organisations and 163,638 employees over three years — provides the most comprehensive behavioural picture of what AI is actually doing to work patterns (activtrak.com, May 2026). The findings are nuanced and would not have been visible from survey data alone:
- Productive hours increased 5% (to 6 hours 36 minutes daily) even as the average workday shrank 2%. The workday compressed; the density increased.
- Collaboration surged 34%, and multitasking rose 12%. AI is adding to coordination overhead, not eliminating it.
- Focus efficiency declined to 60% — a three-year low. Workers are doing more in less time, but with more interruptions and less deep work. The AI tools that were supposed to reduce cognitive load may be adding to fragmentation.
- Average time spent in AI tools increased 8× across the research population.
Metric 6: Function-Level Financial ROI
Metric 6: ROI Calculated at the Team or Function Level — Not Company-Wide Company-wide AI ROI is too blunt an instrument to drive decisions. The most actionable financial measurement is function-level: this team's AI investment is producing this return; that team's is not. This enables surgical decisions — expand here, retrain there, cut this tool, double down on that one (Larridin March 2026).The ROI formula itself is straightforward: (Net Return – Cost) ÷ Cost × 100. Applying it honestly at the function level requires:
- Net Return components: time saved (hours × loaded hourly rate); capacity converted to output (additional work completed with existing headcount); quality improvement value (reduced rework cost, reduced error cost, improved conversion rates); revenue attribution where measurable.
- Cost components: all licence costs for the function’s AI tools; IT and infrastructure costs allocated to the function; implementation and training time (hours × rate); ongoing support and maintenance; change management cost.
- Measurement period: a minimum of 90 days post-deployment for early signal; 12–18 months for business-outcome-level ROI. The DX data shows meaningful throughput gains in the 5–15% range across 400+ companies; the same-engineer methodology at a major financial services company showed a 30% PR throughput increase year-over-year for AI adopters vs 5% for non-adopters (getdx.com).
The Same-Person Methodology: Isolating AI’s True Effect
The most rigorous approach to measuring AI ROI is comparing an individual’s output before and after AI adoption — rather than comparing AI users to non-AI users across teams. The same-person methodology eliminates the confounding variables that plague cross-team comparisons: tenure, seniority, team culture, project complexity, seasonal variation.GetDX.com’s implementation of this approach at a major financial services company is the clearest published example: ‘Using this methodology, one major financial services company found that engineers using AI tools showed a 30% increase in pull request throughput year-over-year, compared to just 5% among non-adopters. This same-engineer approach is the clearest way to isolate how AI tools directly affect developer productivity.’
The same-person methodology works for any measurable repeating task: a customer service agent’s ticket resolution rate before and after AI-assisted response tooling; a content creator’s draft-to-publication time before and after AI writing assistance; a finance analyst’s time to complete monthly close activities before and after AI data aggregation. The requirement is that the task type remains comparable across the measurement periods and that no other significant variables changed simultaneously.
The Larridin (March 2026) framework adds the proficiency dimension to the same-person methodology: tracking not just whether the same person is more productive with AI, but whether they are becoming more proficient over time. A new AI user producing 15% throughput gains in month one who produces 40% gains in month six is a different investment thesis than one who remains at 15% throughout. The trajectory of proficiency improvement is itself a measurement signal.
What Not to Measure (and Why)
Several commonly tracked AI metrics produce misleading signals and should be replaced or contextualised with the objective measures above:
Building Your AI Measurement Dashboard
The practical implementation of the measurement framework above for most organisations is a dashboard that combines four data streams:- Stream 1 — System-of-record throughput data: pull from project management (Jira, Linear, GitHub, Salesforce, etc.) on a weekly cadence. Track output volume, cycle time, and acceptance rate by team and function. This is your primary throughput signal.
- Stream 2 — Task-level time logs: for the 5–10 highest-volume AI-supported task types in each function, maintain a time log (not survey-estimated) of elapsed time per completion. Update monthly. This is your primary task productivity signal.
- Stream 3 — Behavioural analytics: if your organisation uses a workplace analytics platform, pull weekly focus time, collaboration time, and AI tool usage duration. Segment by function, seniority, and AI proficiency level. This is your workflow quality signal.
- Stream 4 — Quality indicators: error rates, revision rates, first-contact resolution rates, or equivalent quality gates from your delivery process. Update monthly. This is your output quality signal.
Larridin’s March 2026 analysis frames the competitive consequence: ‘The companies that win the 2026 budget cycle won’t be the ones with the best AI tools. They’ll be the ones who can prove their AI tools are working — with data, not surveys.’
Conclusion
The measurement gap in AI productivity is not primarily a technical problem. The data exists — in delivery systems, in time logs, in activity analytics, in quality gates — or it can be created by documenting tasks before deployment. The gap is an organisational priority problem: most companies track AI adoption because adoption is easy to track. Impact is not. And so they measure the thing they can measure rather than the thing that matters.The METR randomised controlled trial result — a 19% objective slowdown alongside a 20% perceived speedup — should be the empirical anchor for every AI productivity conversation. It establishes that worker self-report is not a reliable signal for AI impact. It does not mean AI cannot produce genuine productivity gains; the DX data showing 30% PR throughput increases for AI adopters in a controlled same-engineer comparison, and the ActivTrak data showing 5% more productive hours even in a compressed workday, demonstrate that genuine gains exist and are measurable. The gains are real, but they are smaller and more variable than surveys suggest, and they are unequally distributed between proficiency levels in ways that surveys cannot detect.
The measurement chain — spend, adoption depth, proficiency, productivity signal, business outcome — is not a research project. It is a five-to-eight metric dashboard, populated from systems that most organisations already have, updated weekly or monthly, segmented by function and proficiency level. The organisations that build it will make better AI investment decisions, identify where coaching can lift the 10–50× variation between power users and beginners, and prove to their CFOs that AI budget deserves expansion rather than scrutiny. That is a different conversation than ‘we asked people and they said it was helpful.’
Frequently Asked Questions
Why can't we just ask employees how much AI has helped them?Because self-reported AI productivity data is systematically unreliable — and not in a random, noise-like way but in a directionally misleading way. The METR randomised controlled trial (February–June 2025, 16 experienced developers) found that AI tools increased actual task completion time by 19% while developers simultaneously reported a perceived speedup of 20% (blog.exceeds.ai, April 2026). The direction of the measured effect was opposite to the direction of the self-reported effect. Other mechanisms that make surveys unreliable: effort mismatch (AI reduces cognitive effort, which feels like speed even when elapsed time increases); activity inflation (more drafts, more commits, more emails initiated does not equal more valuable output per hour); and comprehension displacement (developers using AI to learn libraries scored 17% lower on comprehension tests — they felt productive while losing capability). Surveys are useful for understanding adoption barriers and user experience, but they are not a reliable substitute for objective productivity measurement.
What is the missing baseline problem and how do we solve it?
The missing baseline problem is the failure to document process performance before deploying AI — making it impossible to calculate the genuine before/after difference after deployment. Agility-at-scale.com (February 2026) identifies it as the single most common AI measurement failure: 'Without pre-AI documentation of the processes AI will affect, every ROI claim is anecdotal.' To solve it prospectively: identify the specific tasks AI will be applied to, measure actual elapsed time for 10+ completions of each before deployment, record error and revision rates, pull throughput data from your delivery systems, and document all of this in a baseline measurement document. If you are post-deployment without baselines: conduct baseline measurement on the tasks AI has not yet been applied to in your organisation, then introduce AI to those tasks next and measure the delta. This gives you a controlled comparison even post-deployment.
What is the five-link AI ROI measurement chain?
Developed by Larridin (March 2026), the five-link chain is the structural framework that maps AI spend to business outcomes through the intervening steps that most organisations skip. The links are: (1) Spend — all costs of AI investment including licences, implementation, training, and support; (2) Adoption Depth — not just whether employees have access but how frequently and skillfully they use AI tools; (3) Proficiency — how effectively individual users apply AI tools, recognising that power users generate 10–50× more value than beginners from the same tools; (4) Productivity Signal — objective, task-level evidence of changed output volume, speed, or quality; and (5) Business Outcome — revenue impact, cost reduction, customer satisfaction change, or other business-level result. Most organisations measure only links 1 and 5 and try to connect them directly, which produces anecdotal ROI claims rather than defensible data.
What does 'same-person methodology' mean for AI measurement?
The same-person methodology compares an individual's output before and after AI adoption, rather than comparing AI users to non-AI users across teams or roles. This eliminates confounders that make cross-team comparison unreliable — seniority, tenure, team culture, project complexity, seasonal variation. GetDX implemented this approach at a major financial services company and found a 30% year-over-year increase in pull request throughput for AI-using engineers, compared to 5% for non-adopters. Comparing the same engineer to their own pre-AI baseline is the clearest available way to isolate AI's direct effect. For non-engineering functions, the same methodology applies: track a customer service agent's ticket resolution rate before and after AI assistance, a content creator's time to publication-ready draft before and after AI writing tools, or a finance analyst's time to complete monthly close activities before and after AI data aggregation. The requirement is comparable task types and no simultaneous confounding changes.
How do we translate AI time savings into a number the CFO will accept?
Three steps: (1) Measure the time saving on a specific, named, repeating task — not 'productivity is better' but 'customer research reports went from 3 hours to 40 minutes per completion.' (2) Calculate the annualised volume of that task type: '40 researchers each complete approximately 5 reports per month = 2,400 completions per year.' (3) Multiply time saving by volume and by loaded hourly cost: '2,400 × 2h20m saving × $75 loaded rate = $420,000 in annual capacity saved.' That is the format CFOs respond to — specific, auditable, based on timed measurement rather than survey estimate. The same methodology applies to quality savings: calculate the cost of rework or error correction per incident, then multiply by the reduction in incident rate. Function-level ROI in this format — with the cost of the AI investment clearly accounted for — is the basis for expanding, reducing, or redirecting AI budget.
What metrics should we avoid when measuring AI productivity?
Six metrics that produce misleading conclusions: (1) Self-reported time savings — systematically overstated (METR RCT: perceived 20% speedup, actual 19% slowdown). (2) Prompts sent or time in AI tool — activity metrics, not productivity signals; high usage does not imply high-value output. (3) Licence utilisation rate — whether seats are used says nothing about whether they are producing value. (4) Company-wide AI ROI — too blunt; aggregates high-return functions with flat-return functions, masking both. (5) Employee satisfaction with AI tools — correlated with perceived ease, not actual productivity; 61% of employees feel AI makes their jobs easier (PwC) while objective data shows more varied results. (6) Percentage of code or content written by AI — overemphasising origin without connecting to quality metrics leads to misleading conclusions (getdx.com). Replace these with throughput from system-of-record data, quality gate pass rates, task-level elapsed time logs, and function-level financial ROI calculations.

0 Comments Comments