

Business
Renting vs Buying a Home: The 8.71% Rule Explained

In 2026, renting is cheaper than buying on a monthly basis in all 50 major US metropolitan areas. In the UK, mortgage costs exceed comparable rents for larger homes across the South East, East of England, and London. Yet the question of whether to rent or buy is almost never answered correctly by looking at the monthly payment alone. The 8.71% Rule is the formula that captures what homeownership actually costs — not just the mortgage, but the property tax, the maintenance, and the opportunity cost of the capital you have committed. Run the number first. Then decide.
The rent versus buy debate is one of the most consequential financial decisions most people will ever make, and it is almost universally framed incorrectly. The most common version of the comparison is: ‘my rent is £1,400 per month, but a mortgage on this house would be £1,100 per month, so buying is £300 per month cheaper.’ This analysis is wrong. Not slightly wrong, not missing some details — fundamentally wrong, because it omits the three largest true costs of homeownership.
The 8.71% Rule exists to fix this error. It is a simple formula for calculating what owning a home actually costs each year as a percentage of its value — including property tax, maintenance, and the opportunity cost of the capital committed. Applied correctly, it transforms the rent versus buy decision from an emotional debate about ‘building equity’ and ‘throwing money away on rent’ into a precise, comparable calculation that can be run on any property in any market. The answer is not always rent; and it is not always buy. But it is always calculable once you know the rule.
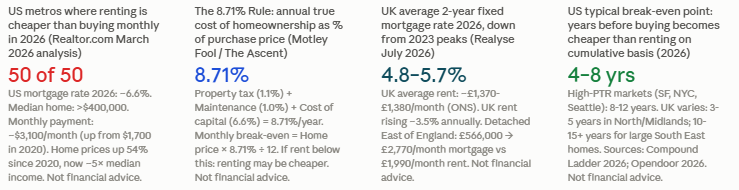
This matters especially in 2026. Ramona Maior, CFP, writing for Domain Money (June 25, 2026): ‘For years, the common understanding in the rent vs buy debate was that buying was “building wealth.” Renting was “throwing money away.” In 2026, that script no longer matches the numbers.’ Mortgage rates sit near 6.6% in the US. The median home costs more than $400,000. And on a monthly basis, renting is cheaper than buying in all 50 major US metropolitan areas, per a March 2026 analysis from Realtor.com. Not financial advice.
Renting cheaper than buying in ALL 50 major US metros in 2026 (Realtor.com March 2026 analysis, cited by Domain Money June 2026). US mortgage rate 2026: ~6.6% (Freddie Mac). Median US home price 2026: >$400,000. Monthly payment on median US home: ~$3,100/month (up from $1,700/month in early 2020). Down payment required: >$120,000 (up from ~$66,000 in 2020). Home prices up 54% since 2020 -- now ~5× median income vs 3× in the 1990s (Domain Money). UK average 2-year fixed rate: 4.8-5.7% (Realyse July 2026). UK average rent: ~£1,370-£1,380/month (ONS). UK rent rising ~3.5% annually (ONS). Sources: Domain Money June 2026; Realtor.com; Realyse July 2026; ONS. Not financial advice.
First, the mortgage payment includes interest — not equity. In the early years of a mortgage, the overwhelming majority of every monthly payment is interest, not principal. On a 25-year repayment mortgage of £250,000 at 5%, the first monthly payment is approximately £1,462 — of which approximately £1,042 is interest and only £420 is principal repayment. The ‘equity being built’ in Month 1 is £420. The remaining £1,042 is indeed gone, just like rent. Over the first five years, the principal repaid on this mortgage is approximately £25,000 — on total payments of approximately £87,700. More than 71% of the payments in the first five years are interest, not equity.
Second, the comparison omits property tax and maintenance, which together typically add 2% of the property’s value per year in ongoing costs. On a £300,000 UK property: 1% property tax equivalent (Council Tax, buildings insurance, ground rent for leasehold) plus 1% annual maintenance = approximately £6,000 per year = £500 per month in additional costs that the renter does not pay. These are real, recurring, unavoidable costs of ownership that vanish from the analysis when people compare mortgage payment to rent.
Third, the comparison ignores the opportunity cost of the down payment — the return that the deposit could have earned if invested rather than committed to a property. A £60,000 UK deposit invested at 7% annual return for 25 years produces approximately £325,000 in compound wealth. That forgone return is a real cost of buying that renters do not pay. Not financial advice.
The monthly payment trap: the mortgage payment vs rent comparison omits: (1) the interest component of the mortgage (most of the payment in early years); (2) property tax / Council Tax / insurance / ground rent (~1% of value annually); (3) maintenance costs (~1% of value annually); (4) the opportunity cost of the down payment (~4-6% annually at market returns). Only when all four are included does the true monthly cost of ownership become comparable to rent. The 8.71% Rule captures all four in a single calculation. Not financial or property advice.
The formula: Property tax (1.1%) + Maintenance costs (1.0%) + Cost of capital (6.6%) = 8.71% per year.
The decision rule: if you can rent a comparable home for less than (home price × 8.71% ÷ 12), renting may be the financially superior choice. If the monthly rent for a comparable home is higher than this figure, buying may be superior. The comparison must be made against a truly comparable property — same size, same location, same quality. Comparing the mortgage on a three-bedroom house to the rent of a studio flat produces a meaningless result.
The 8.71% Rule: THE 8.71% RULE: Annual cost of homeownership = Home price × 8.71%. Monthly break-even = Home price × 8.71% ÷ 12. Components: Property tax (1.1%) + Maintenance (1.0%) + Cost of capital (6.6%) = 8.71%. Decision: if comparable rent < (Home price × 8.71% ÷ 12): renting may be better. If comparable rent > (Home price × 8.71% ÷ 12): buying may be better. Source: The Motley Fool / The Ascent (fool.com/the-ascent). Not financial or property advice. Results depend on local tax rates, maintenance experience, and opportunity cost assumptions.
Property tax (1.1%): In the US, property taxes average approximately 1.1% of assessed value annually, ranging from approximately 0.3% in Hawaii to over 2% in New Jersey and Texas. In the UK, the equivalent is Council Tax (a fixed charge per property band rather than a percentage of value), buildings insurance, and, for leaseholders, service charges and ground rent. The 1.1% figure is a US average; UK equivalents vary significantly.
Maintenance costs (1.0%): Properties require ongoing maintenance: boiler replacements, roof repairs, damp treatment, kitchen and bathroom refurbishments, decorating, plumbing, electrical work. The 1% annual maintenance rule of thumb reflects the average across a property’s life. In any given year, the cost may be £0 or £15,000; the 1% average is what financial planners use to reserve against the inevitable. A renter pays none of these directly — they are the landlord’s obligation.
Cost of capital (6.6%): This is the most complex and most important component. It has two parts: the mortgage interest rate on the money borrowed (approximately 6.6% in the US in 2026; 4.8–5.7% in the UK) and the opportunity cost of the equity invested in the property (the return foregone on the down payment that could have been invested in stocks or bonds). Combined, these produce the cost of capital figure. In the 8.71% Rule as published, 6.6% represents both components combined, calibrated for current (2026) US mortgage rates. In the UK, the mortgage rate component is lower (4.8–5.7%), which reduces the cost of capital slightly. Not financial advice.
The Calculation: UK example at 5.2% mortgage rate (rough adaptation): property tax equivalent ~0.5% (Council Tax at approx £1,500/year on a £300,000 property = 0.5%) + maintenance 1.0% + cost of capital 5.2% (approximate UK mortgage rate 2026) = 6.7% per year. Monthly break-even on £300,000 property: £300,000 × 6.7% ÷ 12 = £1,675/month. If comparable property rents for <£1,675/month: renting may be cheaper. If rent >£1,675/month: buying may be cheaper. Note: the UK calculation uses lower Council Tax assumption than the US property tax figure, reflecting different local tax systems. Not financial or property advice. Adapt to your specific local Council Tax band and mortgage rate.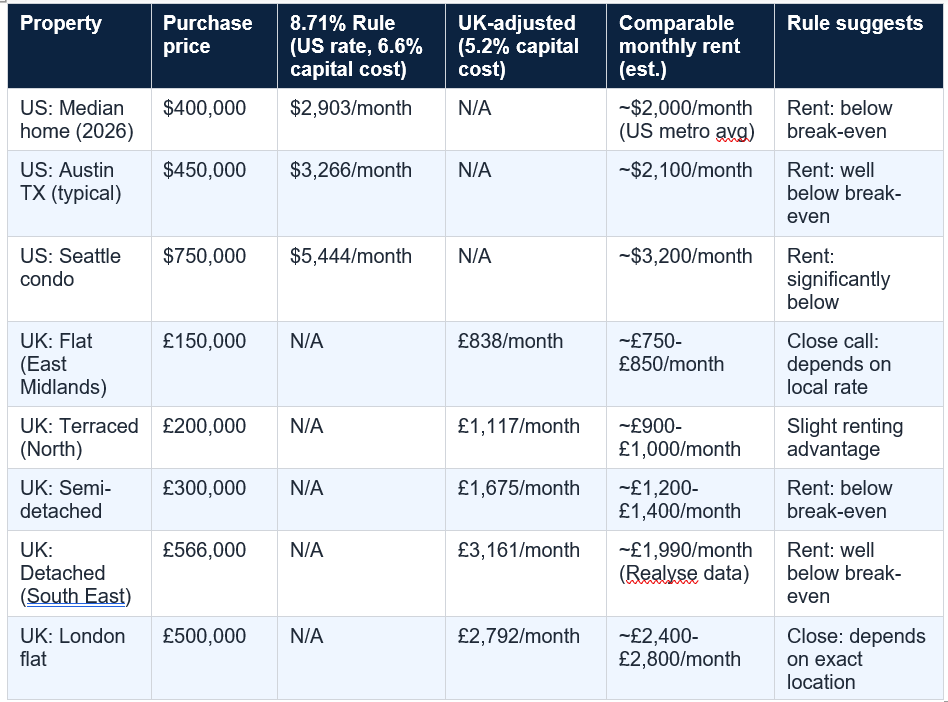
UK figures use approximate 6.7% total annual cost (0.5% Council Tax equivalent + 1.0% maintenance + 5.2% mortgage rate). All figures are illustrative only. Actual Council Tax, maintenance experience, mortgage rates, and local rents vary. The UK detached home example (£566,000) uses Realyse July 2026 data for the East of England. Not financial or property advice.
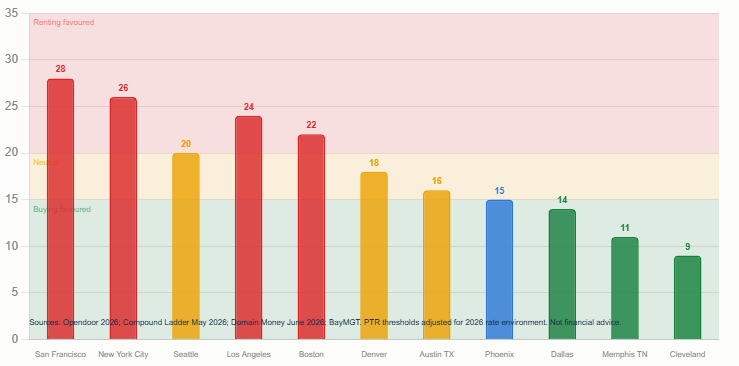
The standard interpretation (BayMGT/Motley Fool): PTR of 1–15 favours buying; 16–20 is neutral to moderate; 21+ favours renting. These thresholds were established in lower-rate environments and should be adjusted downward slightly in 2026’s higher-rate world: what was a ‘15’ (favour buying) in a 3% rate environment may now lean toward neutral at the same multiple, because the carrying cost of the mortgage is higher.
The 8.71% Rule and the price-to-rent ratio are related: a property with an 8.71% Rule break-even equal to its market rent has a price-to-rent ratio of approximately 11.5 (100% / 8.71% = 11.5 times annual rent). Any PTR above 11.5 implies that the monthly rent for the property is below the 8.71% Rule break-even, suggesting renting is cheaper. A PTR of 20 means rent represents only 5% of value per year — well below the 8.71% break-even, clearly favouring renting.
Applying this to 2026 data: the Compound Ladder calculator (May 2026) noted Seattle’s price-to-rent ratio at approximately 19.5 — in the borderline range. At that multiple, the monthly ownership cost (>$5,200) substantially exceeds the comparable rent ($3,200), requiring a very long holding period to justify buying. Not financial advice.
The mechanism is straightforward. Home prices rose 54% between 2020 and 2026 (Domain Money). Mortgage rates rose from under 3% in 2021 to approximately 6.6% in 2026. The combination of higher prices and higher rates has driven the monthly cost of ownership to levels far above the equivalent rental cost in almost every market. The Opendoor guide (2026) notes that in high price-to-rent ratio markets (San Francisco, New York, Seattle), the break-even point — the number of years after which buying becomes financially superior to renting on a cumulative basis — stretches to 8–12 years.
The Domain Money analysis (Ramona Maior, CFP, June 2026) provides the important context: ‘Financially, homes are a harder sell than they have been in recent memory — both literally and figuratively. But that isn’t the whole story.’ The monthly payment comparison favours renting in 2026; the long-term wealth-building comparison, for people who stay for 7+ years in a market with steady appreciation, can still favour buying. Not financial advice.
The result: for flats and terraced houses in lower-priced regions (North of England, Midlands, Scotland, Wales), mortgage costs have in some cases become competitive with or even cheaper than equivalent rents. The ‘buying beats renting’ story in 2026 in the UK is, as Realyse puts it, ‘largely a flats-and-terraces story, concentrated in regions with lower average prices relative to rent — not a universal shift across all property types and locations.’
For larger properties in higher-value regions, the arithmetic runs strongly in the other direction. A detached home in the East of England averaging approximately £566,000 implies a 90% LTV mortgage of roughly £2,770 per month — well above the average asking rent of approximately £1,990 for the same property type. The mortgage excess over rent on this property is £780 per month, or £9,360 per year, before the maintenance and Council Tax costs that the rule captures. Not financial advice.
When you buy a £400,000 property with a 10% deposit (£40,000) and a £360,000 mortgage, the £40,000 deposit is committed to the property. It is no longer available to earn returns elsewhere. At 7% annual investment return, £40,000 grows to approximately £109,000 in 15 years and £152,000 in 20 years — the compound growth you do not receive because the capital is in bricks rather than in a diversified investment portfolio. In the US, where the required down payment has risen above $120,000, this opportunity cost is more than $100,000 over 20 years in foregone investment returns at 7%.
The Compound Ladder calculator (May 2026) illustrates this with the Seattle example: Marcus has $150,000 saved. If he buys a $750,000 condo (20% down, 6.5% mortgage), he faces monthly ownership costs of over $5,200. If he rents the same property for $3,200/month and invests the $150,000 down payment plus the $2,000/month monthly saving at 7%, the renting-plus-investing path rivals or exceeds homeownership over 10 years. This is the fundamental insight that the 8.71% Rule makes visible: buying is not a clear financial win when the opportunity cost of capital is high relative to rental yields. Not financial advice.
At 2026 mortgage rates of approximately 6.6% in the US and 4.8–5.7% in the UK, the cost of capital component needs updating. Using 6.6% (US 2026): 1.1% + 1.0% + 6.6% = 8.71%. Using 5.2% (UK 2026 mid-range): 0.5% (Council Tax equiv) + 1.0% + 5.2% = 6.7%. The 5% Rule applied in today’s environment understates the true cost of ownership by approximately 3–4 percentage points, making the break-even rental figure approximately 60–80% lower than it should be — making buying look more attractive than it actually is.
Which to use: use the 8.71% Rule (or the UK-adapted equivalent) for current decisions in 2026. If mortgage rates fall significantly (below 4% in the US, below 3% in the UK), the 5% Rule becomes appropriate again. The rule should always use the prevailing mortgage rate plus 1% for property tax and 1% for maintenance, updated to reflect current conditions. Not financial advice.
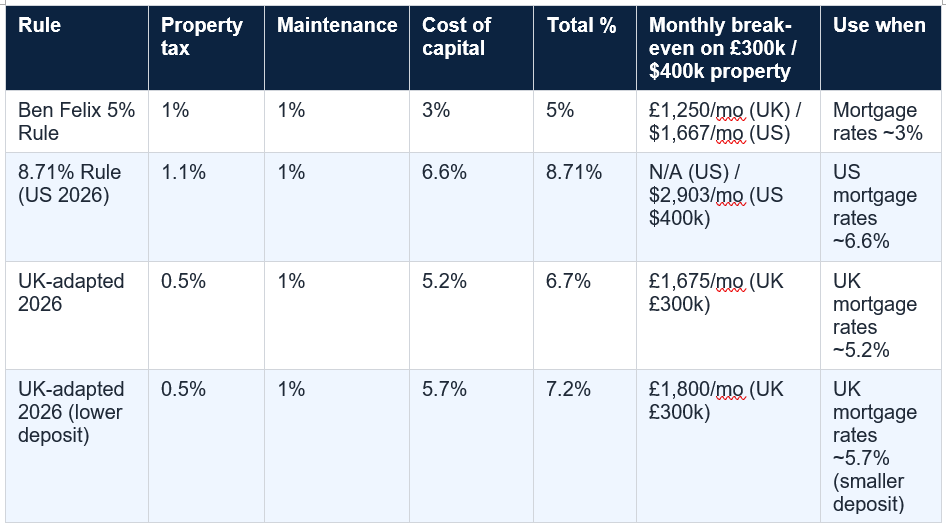
Note: the 5% Rule monthly break-even on a £300,000 UK property (£1,250/month) is below average UK rent (£1,370-£1,380/month, ONS), which would suggest buying is generally better. The UK-adapted 2026 rule (£1,675/month) is above average UK rent, which suggests renting is generally cheaper nationally on average. The truth is local: compare to the rent for a comparable property in the same area. Not financial advice.
Flexibility is the primary argument. Buying and selling within two to three years almost never makes financial sense once you factor in the 2–5% transaction cost of buying (stamp duty, solicitor, survey, lender arrangement fee in the UK; closing costs in the US) and the 5–8% cost of selling (agent fees, legal costs). If your career, relationship, or life plans might require you to move within three years, renting preserves the optionality that buying destroys. Opendoor (2026): ‘If you need geographic flexibility for career opportunities, or if the local market looks overheated, the financial edge of buying may not outweigh the optionality of renting.’
The career opportunity argument is real and underweighted. A renter who receives an unexpected job offer in a different city can accept it within weeks. A homeowner in the same situation faces months of selling, potential price concessions, transaction costs, and emotional disruption. The financial value of the option to relocate without financial penalty is difficult to quantify but can be enormous in a dynamic career. Not financial advice.
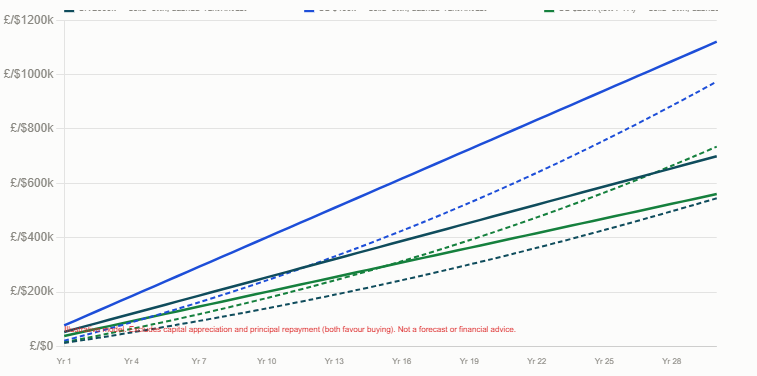
The standard US break-even falls between 4 and 8 years in most markets (amcalc.onrender.com calculator). In high price-to-rent ratio markets (San Francisco, Seattle, New York), the break-even extends to 8–12 years. Three forces shift the balance toward buying over time: rent typically rises 3–5% per year while the mortgage payment stays fixed; the property gains value; and the proportion of each mortgage payment that is principal (rather than interest) increases over the loan’s life.
In the UK, the break-even depends enormously on location and property type. For a flat in a northern city, it may be 3–5 years. For a detached home in the South East, where mortgage costs substantially exceed comparable rents, the break-even could extend to 12–15+ years in the current rate environment. The Compound Ladder calculator (2026) provides property-specific break-even calculations; the amcalc.onrender.com rent versus buy calculator does similarly for US users. Not financial advice.
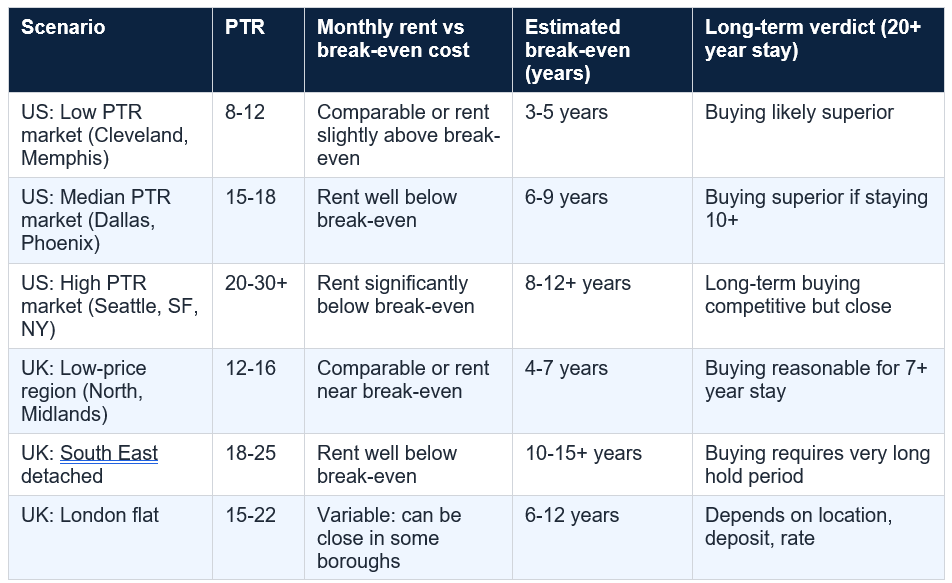
Price-to-rent ratios and break-even estimates are approximate and vary by specific property, location, mortgage rate, deposit size, and local appreciation rates. Sources: amcalc.onrender.com (2026); Compound Ladder calculator (May 2026); Opendoor 2026; Realyse July 2026. Not financial or property advice. Always use a property-specific calculator with your actual numbers.
In 2026, applying the rule honestly produces a striking result: in most major US markets, and in most mid-to-high-price UK markets, renting is cheaper than buying on a true cost basis. Renting is not ‘throwing money away.’ It is paying for housing at a price that is, in many current markets, lower than the true cost of owning equivalent housing. The money saved by renting, invested consistently in a diversified portfolio, can produce wealth outcomes that rival or match the wealth built through homeownership — especially over time horizons of less than ten years.
But the rule also identifies markets and circumstances where buying wins: low price-to-rent ratio markets, long time horizons, stable personal circumstances, and declining mortgage rates. The rule is a calculator, not a conclusion. Run the numbers on your specific property in your specific market. Not financial, mortgage, property, or legal advice. Consult a qualified independent financial adviser, FCA-authorised mortgage broker, and solicitor before making any property decision.
The 8.71% Rule is a formula for calculating the true annual cost of homeownership as a percentage of a property's purchase price. It was published by The Motley Fool (The Ascent). The formula: property tax (1.1%) + maintenance costs (1.0%) + cost of capital (6.6%) = 8.71%. To apply it: multiply the home price by 8.71% and divide by 12 to get the monthly break-even cost. If you can rent a comparable property for less than this monthly break-even figure, renting may be the financially superior choice. If the comparable monthly rent exceeds the break-even, buying may be superior. Example: $400,000 US home × 8.71% ÷ 12 = $2,903/month break-even. If a comparable property rents for less than $2,903/month, renting is worth considering. Source: The Motley Fool/The Ascent. Not financial or property advice.
Is it better to rent or buy in 2026?
On a monthly payment basis, renting is cheaper than buying in all 50 major US metropolitan areas in 2026, according to a March 2026 Realtor.com analysis cited by Domain Money (June 2026). US mortgage rates of approximately 6.6% and median home prices above $400,000 mean monthly ownership costs (~$3,100/month on the median home) substantially exceed typical rents. In the UK, the picture varies significantly: for flats and terraced homes in lower-priced regions (North of England, Midlands), the monthly mortgage cost in 2026 has become competitive with comparable rents. For larger homes in the South East, East of England, and London, mortgage costs typically exceed comparable rents by wide margins (Realyse, July 2026). The answer depends on your specific property, location, time horizon, and personal circumstances. Apply the 8.71% Rule to your specific situation. Not financial or property advice.
What is the difference between the 5% rule and the 8.71% rule?
Both rules calculate the annual cost of homeownership as a percentage of the property's value, using three components: property tax, maintenance, and cost of capital. Ben Felix's 5% Rule uses 3% for the cost of capital component, reflecting the low-rate environment (approximately 3% mortgage rates) at the time of the rule's creation: 1% + 1% + 3% = 5%. The 8.71% Rule updates the cost of capital to 6.6%, reflecting 2026 US mortgage rates: 1.1% + 1.0% + 6.6% = 8.71%. Using the 5% Rule in 2026's higher-rate environment understates the true cost of ownership by approximately 3.71 percentage points, making buying appear more attractive than it actually is. For UK users in 2026, a rate of approximately 5.2% for the cost of capital component is more appropriate: 0.5% (Council Tax equivalent) + 1.0% + 5.2% = 6.7% total. Not financial or property advice.
How do I calculate the break-even point for buying vs renting?
The break-even point is the number of years after which buying becomes financially superior to renting on a cumulative net cost basis. It accounts for closing costs (stamp duty, legal fees, survey), mortgage interest, property tax, maintenance, and the opportunity cost of the down payment, against cumulative rent payments and investment returns on the down payment. The typical US break-even falls between 4 and 8 years in most markets (amcalc.onrender.com; Compound Ladder, 2026). High price-to-rent ratio markets (San Francisco, Seattle, New York) have break-even periods of 8-12 years. UK break-even varies by location and property type: 3-5 years in lower-price northern markets; 10-15+ years for larger homes in the South East. Free online tools: amcalc.onrender.com (US-focused); compoundladder.com/calculators/rent-vs-buy-calculator (US). For UK calculations: use a mortgage broker or independent financial adviser's modelling. Not financial or property advice.
Is paying rent throwing money away?
No. The phrase 'throwing money away on rent' is one of the most persistent and most damaging myths in personal finance. Rent pays for housing — the same basic function as a mortgage payment. The portion of a mortgage payment that is NOT 'throwing money away' is the principal repayment (equity building). But in the early years of a mortgage, the overwhelming majority of each payment is interest, not principal — interest that is indeed 'thrown away' in the same sense as rent. A mortgage at 5% on £250,000: in Month 1, approximately £1,042 is interest (gone forever) and £420 is principal (equity). The £1,042 in interest is as 'thrown away' as an equivalent month's rent. Furthermore, renters avoid property tax, maintenance costs, and the opportunity cost of the down payment — costs that are invisible in the 'throwing money away' framing. The 8.71% Rule makes these costs visible and comparable. Not financial or property advice.
Table of Contents
- The Question Everyone Gets Wrong
- Why the Monthly Payment Comparison Lies
- The 8.71% Rule: What It Is and Where It Comes From
- The Three Components of the 8.71%
- How to Apply the 8.71% Rule: Step-by-Step
- The 8.71% Rule in Practice: UK and US Examples
- The Price-to-Rent Ratio: The Market-Level Version
- 2026 Market Reality: Renting Cheaper in Every US Metro
- The UK Picture: A Postcode-by-Postcode Decision
- The Opportunity Cost Nobody Talks About
- The 5% Rule vs the 8.71% Rule: Which to Use
- When Buying Still Makes Undeniable Sense
- The Non-Financial Case for Renting
- The Break-Even Point: How Long Before Buying Wins?
- Conclusion: The Rule Is the Starting Point, Not the Answer
- Frequently Asked Questions
Price-to-rent ratios — US metros 2026
Break-even timeline — when buying wins over renting
The Question Everyone Gets Wrong
The rent versus buy debate is one of the most consequential financial decisions most people will ever make, and it is almost universally framed incorrectly. The most common version of the comparison is: ‘my rent is £1,400 per month, but a mortgage on this house would be £1,100 per month, so buying is £300 per month cheaper.’ This analysis is wrong. Not slightly wrong, not missing some details — fundamentally wrong, because it omits the three largest true costs of homeownership.The 8.71% Rule exists to fix this error. It is a simple formula for calculating what owning a home actually costs each year as a percentage of its value — including property tax, maintenance, and the opportunity cost of the capital committed. Applied correctly, it transforms the rent versus buy decision from an emotional debate about ‘building equity’ and ‘throwing money away on rent’ into a precise, comparable calculation that can be run on any property in any market. The answer is not always rent; and it is not always buy. But it is always calculable once you know the rule.
This matters especially in 2026. Ramona Maior, CFP, writing for Domain Money (June 25, 2026): ‘For years, the common understanding in the rent vs buy debate was that buying was “building wealth.” Renting was “throwing money away.” In 2026, that script no longer matches the numbers.’ Mortgage rates sit near 6.6% in the US. The median home costs more than $400,000. And on a monthly basis, renting is cheaper than buying in all 50 major US metropolitan areas, per a March 2026 analysis from Realtor.com. Not financial advice.
Renting cheaper than buying in ALL 50 major US metros in 2026 (Realtor.com March 2026 analysis, cited by Domain Money June 2026). US mortgage rate 2026: ~6.6% (Freddie Mac). Median US home price 2026: >$400,000. Monthly payment on median US home: ~$3,100/month (up from $1,700/month in early 2020). Down payment required: >$120,000 (up from ~$66,000 in 2020). Home prices up 54% since 2020 -- now ~5× median income vs 3× in the 1990s (Domain Money). UK average 2-year fixed rate: 4.8-5.7% (Realyse July 2026). UK average rent: ~£1,370-£1,380/month (ONS). UK rent rising ~3.5% annually (ONS). Sources: Domain Money June 2026; Realtor.com; Realyse July 2026; ONS. Not financial advice.
Why the Monthly Payment Comparison Lies
The mortgage payment versus rent payment comparison is the most cited and most misleading version of the rent versus buy analysis. It is misleading for three reasons, each of which the 8.71% Rule directly addresses.First, the mortgage payment includes interest — not equity. In the early years of a mortgage, the overwhelming majority of every monthly payment is interest, not principal. On a 25-year repayment mortgage of £250,000 at 5%, the first monthly payment is approximately £1,462 — of which approximately £1,042 is interest and only £420 is principal repayment. The ‘equity being built’ in Month 1 is £420. The remaining £1,042 is indeed gone, just like rent. Over the first five years, the principal repaid on this mortgage is approximately £25,000 — on total payments of approximately £87,700. More than 71% of the payments in the first five years are interest, not equity.
Second, the comparison omits property tax and maintenance, which together typically add 2% of the property’s value per year in ongoing costs. On a £300,000 UK property: 1% property tax equivalent (Council Tax, buildings insurance, ground rent for leasehold) plus 1% annual maintenance = approximately £6,000 per year = £500 per month in additional costs that the renter does not pay. These are real, recurring, unavoidable costs of ownership that vanish from the analysis when people compare mortgage payment to rent.
Third, the comparison ignores the opportunity cost of the down payment — the return that the deposit could have earned if invested rather than committed to a property. A £60,000 UK deposit invested at 7% annual return for 25 years produces approximately £325,000 in compound wealth. That forgone return is a real cost of buying that renters do not pay. Not financial advice.
The monthly payment trap: the mortgage payment vs rent comparison omits: (1) the interest component of the mortgage (most of the payment in early years); (2) property tax / Council Tax / insurance / ground rent (~1% of value annually); (3) maintenance costs (~1% of value annually); (4) the opportunity cost of the down payment (~4-6% annually at market returns). Only when all four are included does the true monthly cost of ownership become comparable to rent. The 8.71% Rule captures all four in a single calculation. Not financial or property advice.
The 8.71% Rule: What It Is and Where It Comes From
The 8.71% Rule is a rule of thumb for calculating the true annual cost of homeownership as a percentage of the home’s purchase price, published by The Motley Fool (The Ascent). The rule states that the annual cost of owning a home — expressed as a percentage of its value — is approximately 8.71%. To find the monthly break-even cost of owning a specific property, multiply the purchase price by 8.71% and divide by 12.The formula: Property tax (1.1%) + Maintenance costs (1.0%) + Cost of capital (6.6%) = 8.71% per year.
The decision rule: if you can rent a comparable home for less than (home price × 8.71% ÷ 12), renting may be the financially superior choice. If the monthly rent for a comparable home is higher than this figure, buying may be superior. The comparison must be made against a truly comparable property — same size, same location, same quality. Comparing the mortgage on a three-bedroom house to the rent of a studio flat produces a meaningless result.
The 8.71% Rule: THE 8.71% RULE: Annual cost of homeownership = Home price × 8.71%. Monthly break-even = Home price × 8.71% ÷ 12. Components: Property tax (1.1%) + Maintenance (1.0%) + Cost of capital (6.6%) = 8.71%. Decision: if comparable rent < (Home price × 8.71% ÷ 12): renting may be better. If comparable rent > (Home price × 8.71% ÷ 12): buying may be better. Source: The Motley Fool / The Ascent (fool.com/the-ascent). Not financial or property advice. Results depend on local tax rates, maintenance experience, and opportunity cost assumptions.
The Three Components of the 8.71%
Each of the three components of the 8.71% represents a real annual cost of homeownership that renters either do not pay or pay in a lower form.Property tax (1.1%): In the US, property taxes average approximately 1.1% of assessed value annually, ranging from approximately 0.3% in Hawaii to over 2% in New Jersey and Texas. In the UK, the equivalent is Council Tax (a fixed charge per property band rather than a percentage of value), buildings insurance, and, for leaseholders, service charges and ground rent. The 1.1% figure is a US average; UK equivalents vary significantly.
Maintenance costs (1.0%): Properties require ongoing maintenance: boiler replacements, roof repairs, damp treatment, kitchen and bathroom refurbishments, decorating, plumbing, electrical work. The 1% annual maintenance rule of thumb reflects the average across a property’s life. In any given year, the cost may be £0 or £15,000; the 1% average is what financial planners use to reserve against the inevitable. A renter pays none of these directly — they are the landlord’s obligation.
Cost of capital (6.6%): This is the most complex and most important component. It has two parts: the mortgage interest rate on the money borrowed (approximately 6.6% in the US in 2026; 4.8–5.7% in the UK) and the opportunity cost of the equity invested in the property (the return foregone on the down payment that could have been invested in stocks or bonds). Combined, these produce the cost of capital figure. In the 8.71% Rule as published, 6.6% represents both components combined, calibrated for current (2026) US mortgage rates. In the UK, the mortgage rate component is lower (4.8–5.7%), which reduces the cost of capital slightly. Not financial advice.
How to Apply the 8.71% Rule: Step-by-Step
Applying the 8.71% Rule to a specific property decision takes five minutes and three numbers: the purchase price, the monthly mortgage rate equivalent (if adapting to the UK), and the monthly rent for a comparable property.- Step 1: Identify the property you are considering buying and its purchase price.
- Step 2: Multiply the purchase price by 8.71% (or use the UK-adjusted version: 1.1% [replace with your local Council Tax + insurance estimate] + 1.0% maintenance + your current mortgage rate for the cost of capital).
- Step 3: Divide the result by 12 to get the monthly break-even cost.
- Step 4: Find the current monthly rent for a truly comparable property in the same location.
- Step 5: Compare. If Step 4 (rent) < Step 3 (break-even): renting may be cheaper. If Step 4 (rent) > Step 3 (break-even): buying may be cheaper on the true cost basis.
The Calculation: UK example at 5.2% mortgage rate (rough adaptation): property tax equivalent ~0.5% (Council Tax at approx £1,500/year on a £300,000 property = 0.5%) + maintenance 1.0% + cost of capital 5.2% (approximate UK mortgage rate 2026) = 6.7% per year. Monthly break-even on £300,000 property: £300,000 × 6.7% ÷ 12 = £1,675/month. If comparable property rents for <£1,675/month: renting may be cheaper. If rent >£1,675/month: buying may be cheaper. Note: the UK calculation uses lower Council Tax assumption than the US property tax figure, reflecting different local tax systems. Not financial or property advice. Adapt to your specific local Council Tax band and mortgage rate.
The 8.71% Rule in Practice: UK and US Examples
UK figures use approximate 6.7% total annual cost (0.5% Council Tax equivalent + 1.0% maintenance + 5.2% mortgage rate). All figures are illustrative only. Actual Council Tax, maintenance experience, mortgage rates, and local rents vary. The UK detached home example (£566,000) uses Realyse July 2026 data for the East of England. Not financial or property advice.
The Price-to-Rent Ratio: The Market-Level Version
The price-to-rent ratio (PTR) is the market-level counterpart of the 8.71% Rule. It compares a property’s purchase price to its annual rent, expressed as a multiple. A PTR of 20 means the property costs 20 times the annual rent it could generate.The standard interpretation (BayMGT/Motley Fool): PTR of 1–15 favours buying; 16–20 is neutral to moderate; 21+ favours renting. These thresholds were established in lower-rate environments and should be adjusted downward slightly in 2026’s higher-rate world: what was a ‘15’ (favour buying) in a 3% rate environment may now lean toward neutral at the same multiple, because the carrying cost of the mortgage is higher.
The 8.71% Rule and the price-to-rent ratio are related: a property with an 8.71% Rule break-even equal to its market rent has a price-to-rent ratio of approximately 11.5 (100% / 8.71% = 11.5 times annual rent). Any PTR above 11.5 implies that the monthly rent for the property is below the 8.71% Rule break-even, suggesting renting is cheaper. A PTR of 20 means rent represents only 5% of value per year — well below the 8.71% break-even, clearly favouring renting.
Applying this to 2026 data: the Compound Ladder calculator (May 2026) noted Seattle’s price-to-rent ratio at approximately 19.5 — in the borderline range. At that multiple, the monthly ownership cost (>$5,200) substantially exceeds the comparable rent ($3,200), requiring a very long holding period to justify buying. Not financial advice.
2026 Market Reality: Renting Cheaper in Every US Metro
The conclusion of the Realtor.com March 2026 analysis — cited by Domain Money, KEYT, WSBTV, WPXI, and other outlets in June 2026 — is one of the most significant findings in recent US housing market research: for the first time in modern housing history, renting is cheaper than buying on a monthly basis in all 50 of the largest US metropolitan areas. This is not a close call in most markets. The monthly payment on the median US home ($3,100/month) exceeds the typical rent for a comparable property by a margin that, in cities like San Francisco, Seattle, and New York, can exceed $2,000 per month.The mechanism is straightforward. Home prices rose 54% between 2020 and 2026 (Domain Money). Mortgage rates rose from under 3% in 2021 to approximately 6.6% in 2026. The combination of higher prices and higher rates has driven the monthly cost of ownership to levels far above the equivalent rental cost in almost every market. The Opendoor guide (2026) notes that in high price-to-rent ratio markets (San Francisco, New York, Seattle), the break-even point — the number of years after which buying becomes financially superior to renting on a cumulative basis — stretches to 8–12 years.
The Domain Money analysis (Ramona Maior, CFP, June 2026) provides the important context: ‘Financially, homes are a harder sell than they have been in recent memory — both literally and figuratively. But that isn’t the whole story.’ The monthly payment comparison favours renting in 2026; the long-term wealth-building comparison, for people who stay for 7+ years in a market with steady appreciation, can still favour buying. Not financial advice.
The UK Picture: A Postcode-by-Postcode Decision
In the UK, the rent versus buy picture in 2026 is significantly more nuanced than the US — and significantly more dependent on property type and location. Realyse (July 25, 2026) provides the clearest current analysis: average two-year fixed mortgage rates now sit in the 4.8%–5.7% range (down from 2023 peaks), while UK private rents have continued rising at approximately 3.5% annually, reaching an average of approximately £1,370–£1,380 per month nationally (ONS).The result: for flats and terraced houses in lower-priced regions (North of England, Midlands, Scotland, Wales), mortgage costs have in some cases become competitive with or even cheaper than equivalent rents. The ‘buying beats renting’ story in 2026 in the UK is, as Realyse puts it, ‘largely a flats-and-terraces story, concentrated in regions with lower average prices relative to rent — not a universal shift across all property types and locations.’
For larger properties in higher-value regions, the arithmetic runs strongly in the other direction. A detached home in the East of England averaging approximately £566,000 implies a 90% LTV mortgage of roughly £2,770 per month — well above the average asking rent of approximately £1,990 for the same property type. The mortgage excess over rent on this property is £780 per month, or £9,360 per year, before the maintenance and Council Tax costs that the rule captures. Not financial advice.
The Opportunity Cost Nobody Talks About
The opportunity cost of the down payment is the component of the 8.71% Rule that receives the least attention in popular rent versus buy discussions, and it is the component that most dramatically changes the calculation in high-price markets.When you buy a £400,000 property with a 10% deposit (£40,000) and a £360,000 mortgage, the £40,000 deposit is committed to the property. It is no longer available to earn returns elsewhere. At 7% annual investment return, £40,000 grows to approximately £109,000 in 15 years and £152,000 in 20 years — the compound growth you do not receive because the capital is in bricks rather than in a diversified investment portfolio. In the US, where the required down payment has risen above $120,000, this opportunity cost is more than $100,000 over 20 years in foregone investment returns at 7%.
The Compound Ladder calculator (May 2026) illustrates this with the Seattle example: Marcus has $150,000 saved. If he buys a $750,000 condo (20% down, 6.5% mortgage), he faces monthly ownership costs of over $5,200. If he rents the same property for $3,200/month and invests the $150,000 down payment plus the $2,000/month monthly saving at 7%, the renting-plus-investing path rivals or exceeds homeownership over 10 years. This is the fundamental insight that the 8.71% Rule makes visible: buying is not a clear financial win when the opportunity cost of capital is high relative to rental yields. Not financial advice.
The 5% Rule vs the 8.71% Rule: Which to Use
The 8.71% Rule is a direct descendant of the 5% Rule created by Ben Felix, a portfolio manager based in Ottawa, Canada. Felix’s 5% Rule uses the same three-component structure (property tax + maintenance + cost of capital) but with a 3% cost of capital assumption, reflecting the mortgage rate environment at the time of the rule’s creation. At 3% capital cost: 1% property tax + 1% maintenance + 3% = 5%.At 2026 mortgage rates of approximately 6.6% in the US and 4.8–5.7% in the UK, the cost of capital component needs updating. Using 6.6% (US 2026): 1.1% + 1.0% + 6.6% = 8.71%. Using 5.2% (UK 2026 mid-range): 0.5% (Council Tax equiv) + 1.0% + 5.2% = 6.7%. The 5% Rule applied in today’s environment understates the true cost of ownership by approximately 3–4 percentage points, making the break-even rental figure approximately 60–80% lower than it should be — making buying look more attractive than it actually is.
Which to use: use the 8.71% Rule (or the UK-adapted equivalent) for current decisions in 2026. If mortgage rates fall significantly (below 4% in the US, below 3% in the UK), the 5% Rule becomes appropriate again. The rule should always use the prevailing mortgage rate plus 1% for property tax and 1% for maintenance, updated to reflect current conditions. Not financial advice.
Note: the 5% Rule monthly break-even on a £300,000 UK property (£1,250/month) is below average UK rent (£1,370-£1,380/month, ONS), which would suggest buying is generally better. The UK-adapted 2026 rule (£1,675/month) is above average UK rent, which suggests renting is generally cheaper nationally on average. The truth is local: compare to the rent for a comparable property in the same area. Not financial advice.
When Buying Still Makes Undeniable Sense
The 8.71% Rule does not always favour renting. It is a decision framework, not a verdict. There are specific circumstances in which buying is clearly the superior financial and personal decision, even in a high-rate, high-price environment.- Long time horizon in an appreciating market: The break-even point in most US markets falls between 4 and 8 years (amcalc.onrender.com; Compound Ladder, 2026). In most UK markets, it is similar. If you are confident of staying in a location for 10+ years, the cumulative benefits of fixed housing costs (the mortgage does not rise while rents can increase 3-5% annually), forced equity accumulation through principal repayment, and potential capital appreciation typically outweigh the monthly cost premium. A fixed-rate mortgage that feels expensive today becomes relatively affordable as rents rise around it. Not financial advice.
- Strong rental yield market: In markets where the price-to-rent ratio is low (below 15), buying produces positive rental yield and the 8.71% Rule break-even is competitive with or below local rents. In the UK, this applies to parts of the North of England, Midlands, Scotland, and Wales where yields can reach 5-7% gross.
- Personal circumstances: stability, family plans, desire to modify the property, children in a specific school catchment area, preference for security of tenure. The financial case for renting may be strong in some markets; the personal case for owning may be stronger still. The rule gives you the financial reality; the decision incorporates both.
- Leveraged wealth building over decades: homeownership uses leverage (the mortgage) to control an appreciating asset. Over 25-30 years, in markets with consistent price growth, this leverage produces wealth outcomes that a purely investment-based approach must work harder to match. The mechanism: a 3% annual appreciation on a £300,000 property is £9,000 per year of value gain on an initial £30,000 deposit — a 30% annual return on the equity invested, in a rising market. Not financial advice.
The Non-Financial Case for Renting
The financial case for renting in high-cost, high-rate markets is compelling in 2026. But there are also structural, lifestyle, and life-stage arguments for renting that the 8.71% Rule does not capture.Flexibility is the primary argument. Buying and selling within two to three years almost never makes financial sense once you factor in the 2–5% transaction cost of buying (stamp duty, solicitor, survey, lender arrangement fee in the UK; closing costs in the US) and the 5–8% cost of selling (agent fees, legal costs). If your career, relationship, or life plans might require you to move within three years, renting preserves the optionality that buying destroys. Opendoor (2026): ‘If you need geographic flexibility for career opportunities, or if the local market looks overheated, the financial edge of buying may not outweigh the optionality of renting.’
The career opportunity argument is real and underweighted. A renter who receives an unexpected job offer in a different city can accept it within weeks. A homeowner in the same situation faces months of selling, potential price concessions, transaction costs, and emotional disruption. The financial value of the option to relocate without financial penalty is difficult to quantify but can be enormous in a dynamic career. Not financial advice.
The Break-Even Point: How Long Before Buying Wins?
The break-even point is the number of years after which buying becomes financially superior to renting on a cumulative net cost basis — accounting for closing costs, mortgage interest, property tax, maintenance, and the opportunity cost of capital, against cumulative rent payments and investment returns on the diverted down payment.The standard US break-even falls between 4 and 8 years in most markets (amcalc.onrender.com calculator). In high price-to-rent ratio markets (San Francisco, Seattle, New York), the break-even extends to 8–12 years. Three forces shift the balance toward buying over time: rent typically rises 3–5% per year while the mortgage payment stays fixed; the property gains value; and the proportion of each mortgage payment that is principal (rather than interest) increases over the loan’s life.
In the UK, the break-even depends enormously on location and property type. For a flat in a northern city, it may be 3–5 years. For a detached home in the South East, where mortgage costs substantially exceed comparable rents, the break-even could extend to 12–15+ years in the current rate environment. The Compound Ladder calculator (2026) provides property-specific break-even calculations; the amcalc.onrender.com rent versus buy calculator does similarly for US users. Not financial advice.
Price-to-rent ratios and break-even estimates are approximate and vary by specific property, location, mortgage rate, deposit size, and local appreciation rates. Sources: amcalc.onrender.com (2026); Compound Ladder calculator (May 2026); Opendoor 2026; Realyse July 2026. Not financial or property advice. Always use a property-specific calculator with your actual numbers.
Conclusion
The 8.71% Rule does not tell you whether to rent or buy your next home. No formula can. The decision is shaped by your time horizon, your financial position, your personal priorities, the specific property, and the specific market. What the rule does is eliminate the most common and most damaging error in the rent versus buy analysis: the comparison of the mortgage payment to the rent without accounting for property tax, maintenance, and the opportunity cost of capital.In 2026, applying the rule honestly produces a striking result: in most major US markets, and in most mid-to-high-price UK markets, renting is cheaper than buying on a true cost basis. Renting is not ‘throwing money away.’ It is paying for housing at a price that is, in many current markets, lower than the true cost of owning equivalent housing. The money saved by renting, invested consistently in a diversified portfolio, can produce wealth outcomes that rival or match the wealth built through homeownership — especially over time horizons of less than ten years.
But the rule also identifies markets and circumstances where buying wins: low price-to-rent ratio markets, long time horizons, stable personal circumstances, and declining mortgage rates. The rule is a calculator, not a conclusion. Run the numbers on your specific property in your specific market. Not financial, mortgage, property, or legal advice. Consult a qualified independent financial adviser, FCA-authorised mortgage broker, and solicitor before making any property decision.
Frequently Asked Questions
What is the 8.71% rule for renting vs buying?The 8.71% Rule is a formula for calculating the true annual cost of homeownership as a percentage of a property's purchase price. It was published by The Motley Fool (The Ascent). The formula: property tax (1.1%) + maintenance costs (1.0%) + cost of capital (6.6%) = 8.71%. To apply it: multiply the home price by 8.71% and divide by 12 to get the monthly break-even cost. If you can rent a comparable property for less than this monthly break-even figure, renting may be the financially superior choice. If the comparable monthly rent exceeds the break-even, buying may be superior. Example: $400,000 US home × 8.71% ÷ 12 = $2,903/month break-even. If a comparable property rents for less than $2,903/month, renting is worth considering. Source: The Motley Fool/The Ascent. Not financial or property advice.
Is it better to rent or buy in 2026?
On a monthly payment basis, renting is cheaper than buying in all 50 major US metropolitan areas in 2026, according to a March 2026 Realtor.com analysis cited by Domain Money (June 2026). US mortgage rates of approximately 6.6% and median home prices above $400,000 mean monthly ownership costs (~$3,100/month on the median home) substantially exceed typical rents. In the UK, the picture varies significantly: for flats and terraced homes in lower-priced regions (North of England, Midlands), the monthly mortgage cost in 2026 has become competitive with comparable rents. For larger homes in the South East, East of England, and London, mortgage costs typically exceed comparable rents by wide margins (Realyse, July 2026). The answer depends on your specific property, location, time horizon, and personal circumstances. Apply the 8.71% Rule to your specific situation. Not financial or property advice.
What is the difference between the 5% rule and the 8.71% rule?
Both rules calculate the annual cost of homeownership as a percentage of the property's value, using three components: property tax, maintenance, and cost of capital. Ben Felix's 5% Rule uses 3% for the cost of capital component, reflecting the low-rate environment (approximately 3% mortgage rates) at the time of the rule's creation: 1% + 1% + 3% = 5%. The 8.71% Rule updates the cost of capital to 6.6%, reflecting 2026 US mortgage rates: 1.1% + 1.0% + 6.6% = 8.71%. Using the 5% Rule in 2026's higher-rate environment understates the true cost of ownership by approximately 3.71 percentage points, making buying appear more attractive than it actually is. For UK users in 2026, a rate of approximately 5.2% for the cost of capital component is more appropriate: 0.5% (Council Tax equivalent) + 1.0% + 5.2% = 6.7% total. Not financial or property advice.
How do I calculate the break-even point for buying vs renting?
The break-even point is the number of years after which buying becomes financially superior to renting on a cumulative net cost basis. It accounts for closing costs (stamp duty, legal fees, survey), mortgage interest, property tax, maintenance, and the opportunity cost of the down payment, against cumulative rent payments and investment returns on the down payment. The typical US break-even falls between 4 and 8 years in most markets (amcalc.onrender.com; Compound Ladder, 2026). High price-to-rent ratio markets (San Francisco, Seattle, New York) have break-even periods of 8-12 years. UK break-even varies by location and property type: 3-5 years in lower-price northern markets; 10-15+ years for larger homes in the South East. Free online tools: amcalc.onrender.com (US-focused); compoundladder.com/calculators/rent-vs-buy-calculator (US). For UK calculations: use a mortgage broker or independent financial adviser's modelling. Not financial or property advice.
Is paying rent throwing money away?
No. The phrase 'throwing money away on rent' is one of the most persistent and most damaging myths in personal finance. Rent pays for housing — the same basic function as a mortgage payment. The portion of a mortgage payment that is NOT 'throwing money away' is the principal repayment (equity building). But in the early years of a mortgage, the overwhelming majority of each payment is interest, not principal — interest that is indeed 'thrown away' in the same sense as rent. A mortgage at 5% on £250,000: in Month 1, approximately £1,042 is interest (gone forever) and £420 is principal (equity). The £1,042 in interest is as 'thrown away' as an equivalent month's rent. Furthermore, renters avoid property tax, maintenance costs, and the opportunity cost of the down payment — costs that are invisible in the 'throwing money away' framing. The 8.71% Rule makes these costs visible and comparable. Not financial or property advice.
0 Comments
Be the first to share your thoughts on this article.