

Real Estate
US Housing Market Is Broken: Causes, Data & What To Do

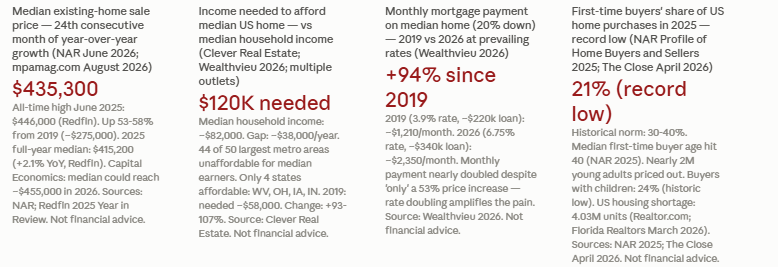
The median American home now costs $435,300. You need a household income of $120,000 to afford it — and the median household earns $82,000. Monthly mortgage payments have nearly doubled since 2019, from approximately $1,210 to $2,350. First-time buyers now have a median age of 40. Nearly 2 million young adults are entirely priced out. The housing shortage stands at 4.03 million units. And the homeowners sitting on 3% mortgages aren’t moving. This article explains exactly how the US housing market got here, what each problem is, and what your real options are as a buyer, renter, or investor in 2025–26. Not financial or real estate advice.
That gap — approximately $38,000 per year between what the median household earns and what the median home requires — is the housing crisis in one number. Morningstar’s Q1 2026 Housing Market Pulse report puts it directly: ‘Housing affordability remains the central obstacle for the US housing market in 2026. The median existing-home price rose 50% between 2019 and 2024, while household income grew far more slowly.’ The income that grew far more slowly? Approximately 19%. Prices up 50%. Incomes up 19%. That is the compounding structural failure behind every frustrated would-be homebuyer in America right now.
This article is not doom-scrolling for its own sake. The purpose is to explain the specific, distinct problems that have produced this crisis, show you where the data comes from, and then provide real, specific options for navigating it. Not financial or real estate advice.
State of the US housing market (2025-2026): median existing home sale price June 2026: $435,300 (NAR; 24th consecutive month of YoY growth; mpamag.com August 2026). All-time high June 2025: $446,000 (Redfin 2025 Year in Review). Income needed to afford median home: ~$120,000/year (Clever Real Estate). Median US household income: ~$82,000/year. Affordability gap: ~$38,000/year. Monthly mortgage payment increase 2019 vs 2026: $1,210 → $2,350 (+94%) (Wealthvieu 2026). Median home price up 50% from 2019-2024 vs household income up ~19% (Morningstar Q1 2026). Not financial advice.
The pandemic-era price surge was driven by a specific combination that is unlikely to repeat but also unlikely to fully unwind: historically low mortgage rates (the 30-year fixed rate dropped to approximately 2.65% in January 2021), massive fiscal stimulus, remote work migration to previously affordable markets, and a rush of buyers who all wanted more space at the same time. The result was a 25–30% price surge in 2021 alone in many markets. Those gains have not reversed.
In 2025, the full-year median sale price across all US markets averaged 1.7% higher than 2024 — modest growth, but still growth, on top of already-record levels (Redfin 2025 Year in Review). Every single month in 2025 surpassed its corresponding 2024 median. As John Burns, housing analyst and founder of John Burns Research and Consulting, noted in December 2025: ‘The only way to fix affordability is through income growth, falling home prices or declining mortgage rates.’ He was blunt about the first option: ‘I don’t know many people getting 56% raises this year.’ Not financial advice.
Rates have since fallen from their peak. By early 2026, the 30-year fixed rate was in the 6.5–7.0% range, with Freddie Mac citing approximately 6.7% in August 2025 (mpamag.com). Redfin predicts an average of 6.3% for 2026. But even 6.3% is dramatically higher than the 3.9% rate of 2019. On a $350,000 loan (80% of a $437,500 purchase), the difference between a 3.9% rate and a 6.5% rate is approximately $495 per month — $5,940 per year — $178,200 over the life of the loan. That is not noise. That is the difference between affording a home and not.
Morningstar’s Q1 2026 report states: ‘Mortgage rates are the biggest lever on housing demand right now, with the average 30-year fixed mortgage rate more than doubling from its 2021 low.’ The Wealthvieu 2026 affordability data confirms the payment impact: the monthly payment on the median US home (20% down) went from approximately $1,210 in 2019 to approximately $2,350 in 2026 — a 94% increase. Not financial advice.
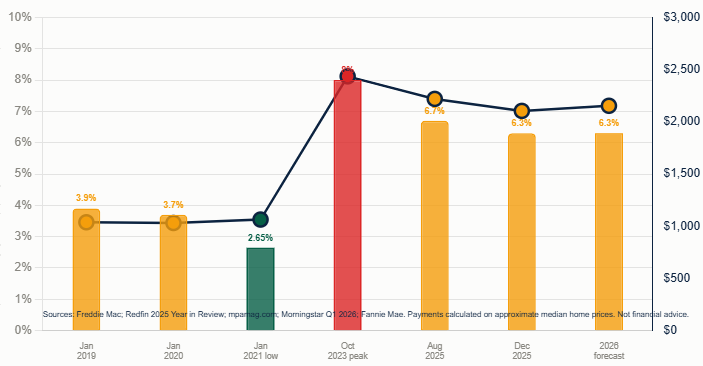
Mortgage rate history: 30-yr fixed rate January 2021: ~2.65% (historic low); October 2023: ~8% (peak); early 2026: ~6.5-7.0%. Freddie Mac August 2025: ~6.7%. Redfin forecast 2026: ~6.3% average. Fannie Mae: ~6.0% by end of 2026. Pre-pandemic 2019: ~3.9%. Monthly payment on median-priced home (20% down): 2019 at 3.9% = ~$1,210/month; 2026 at 6.75% = ~$2,350/month = +94%. Sources: Redfin 2025 Year in Review; mpamag.com; Morningstar Q1 2026; Wealthvieu 2026. Not financial advice.
This is the lock-in effect, and it is one of the primary reasons why existing home sales have collapsed to levels not seen since the early 1990s. NAR data (cited mpamag.com August 2026) shows existing-home sales running at an annual pace of just 3.91–3.93 million — far below the historical average of approximately 5–6 million per year. The Close (April 2026) reports that active listings rose 10% year-over-year in January 2026 — encouraging, but still well below pre-pandemic norms.
The lock-in effect creates a vicious cycle: fewer listings mean fewer choices for buyers, which keeps prices elevated despite the affordability crisis, which pushes buyers to the sidelines, which further reduces transaction volume. Housing analyst John Burns described the market as ‘drifting toward balance by way of more resale listings, more new home supply, and a much smaller shortage than previously speculated’ — but cautioned that affordability remains the dominant barrier regardless of inventory direction. Not financial advice.
The wide gap between current mortgage rates and effective mortgage rates means most homeowners are unwilling to move unless forced.' (Bank of America economists, cited IBTimes/BusinessInsider.) Housing economist Lawrence Yun: rates expected to settle near 6% by early 2026. Redfin economic research lead Chen Zhao: 'My advice for serious buyers who can afford today's costs is to shop for your dream home and accept that this year is probably not the time to find a dream deal.' Not financial advice.
This shortage is not new. It has been building for over a decade, accelerating after the 2008 financial crisis cratered the homebuilding industry. Many of the small and mid-size homebuilders that went bankrupt or exited the market after 2008 never came back. The industry consolidated, labour costs rose, regulatory and zoning barriers proliferated, and the pace of new construction never returned to pre-crisis levels in most markets. The pandemic demand surge collided with this structural undersupply in 2020–21, producing the price explosion that created the current crisis.
In 2026, Morningstar reports that new home inventory sits at 10.3 months of supply — well above the historical average of 6.2 months. This sounds like good news for buyers, and in the new-home market it partially is. But the overall existing-home market remains far below pre-pandemic inventory. The Close (April 2026): ‘Home prices remain high because two forces are working together: a structural housing shortage and a lock-in effect that discourages existing owners from selling.’ Not financial advice.
US housing shortage: 4.03 million units in 2025 (Realtor.com, cited Florida Realtors March 2026). New construction 2025: ~1.36 million starts; new household formation: ~1.4 million = shortfall of ~50,000 per year. Nearly 2 million young adults priced out in 2025 (same source). New home months of supply Q1 2026: 10.3 months vs historical average 6.2 months (Morningstar Q1 2026). Existing-home sales annual rate June 2026: 3.93 million (NAR, mpamag.com) -- vs historical average ~5-6 million. Housing supply up 33% year-over-year but still below pre-pandemic norms (CJ Patrick Company, cited mpamag.com). Not financial advice.
To understand why first-time buyers have nearly vanished, look at the math. Clever Real Estate found that buyers need a household income of nearly $120,000 to afford the median-priced home in America. The income needed just to buy a starter home — not the median home but an entry-level property — reached approximately $86,000/year in 2025 (Realtor.com, cited Florida Realtors March 2026). The typical down payment averaged 14.4% — on a $420,000 home, that is $60,480 in cash.
The demographic consequences are becoming visible. The median age of a first-time buyer hit 40 years old in 2025 (NAR 2025), up from a historic norm in the late 20s to early 30s. The share of buyers with children dropped to a historic low of 24%. Nearly 2 million young adults remain with family members or in shared housing arrangements because homeownership is financially out of reach. Redfin’s year-in-review noted that the affordability crisis ‘is accelerating fastest in rural America, where buyers need to earn nearly twice as much as they did before the pandemic to afford a typical home.’ Not financial advice.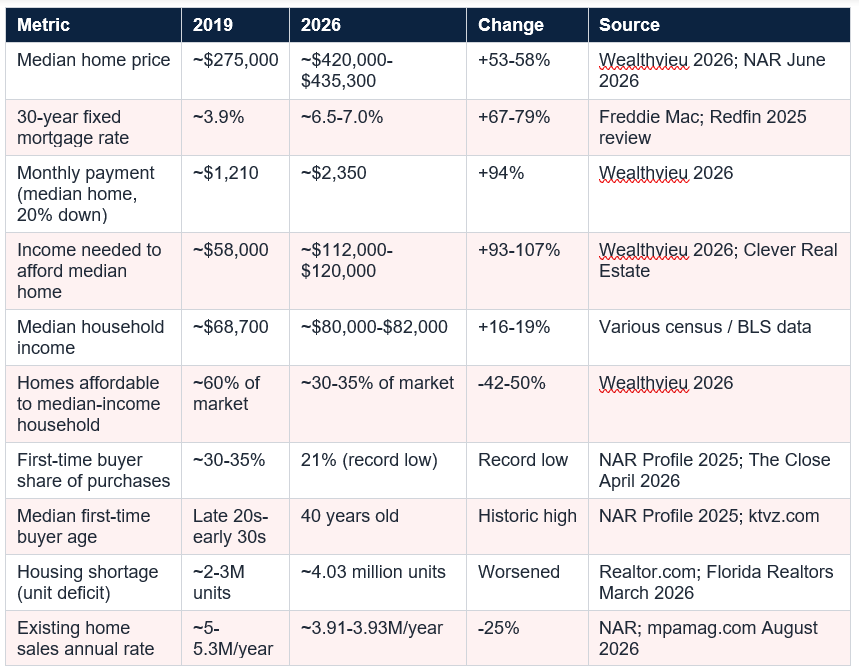
December 2025 Case-Shiller data (cited cuny.edu/issuenumberone) showed Sun Belt cities — Tampa and Miami specifically — with the steepest price declines of any major market, attributable to excess housing development during the pandemic. Meanwhile, Midwest markets in cities like Indianapolis, Columbus, and Kansas City remained significantly more affordable than coastal and Sun Belt markets. Only four states have housing markets affordable for median-income earners: West Virginia, Ohio, Iowa, and Indiana (Clever Real Estate).
For prospective buyers priced out of high-cost markets, the regional disparity creates a genuine option: relocation to affordable markets is one of the few practical near-term solutions available. The Wealthvieu housing affordability crisis 2026 analysis specifically identifies the Midwest and South as offering 40–60% lower home prices relative to high-cost coastal and Sun Belt markets. This option requires a willingness to move, but it is one of the few genuine affordability solutions available to median-income households in 2026. Not financial or real estate advice.
Morningstar’s Q1 2026 outlook: ‘If mortgage rates decline further, Morningstar expects existing-home sales to recover and turnover to increase.’ The base case for most housing economists is a gradual correction rather than a crash: prices flat to modestly declining in oversupplied Sun Belt markets; prices flat to modestly rising in supply-constrained Midwest and Northeast markets; mortgage rates slowly declining toward the mid-5% range over the next 2–3 years as the Fed continues its easing cycle. Redfin describes 2026 as potentially ‘the year of the Great Housing Reset’ — not a crash, but a rebalancing.
Capital Economics economist Thomas Ryan takes a somewhat more pessimistic view: ‘the combination of steadily rising home prices and higher mortgage rates will result in the continuation of strained affordability for would-be homebuyers over the next two years.’ The most bearish scenario is concentrated in specific markets: pandemic-boom cities with excess new construction supply (parts of Florida, Arizona, Nevada) where price declines are more likely. But a national 2008-style crash — driven by credit defaults and forced selling — is not in the base case of most mainstream forecasters. Not financial or real estate advice.
The structural forces — the lock-in effect, the decade-long housing supply deficit, the post-2008 collapse of homebuilding capacity — will take years to unwind. There is no quick fix. Redfin’s description of 2026 as a potential ‘Great Housing Reset’ is optimistic, and there are regional pockets where genuine rebalancing is occurring (Sun Belt oversupply markets, new construction inventory in Texas and Florida). But for the median would-be buyer in most major US metro areas, the crisis is real and ongoing.
Hopeless it is not. The options — geographic flexibility, FHA loans, house hacking, down payment assistance, the rent-and-invest strategy — are real. The Midwest and parts of the South remain genuinely affordable. Rates will eventually fall further. New construction, however slowly, is adding supply. And for the 23.8 million Americans who already own a home with substantial equity, the same market that froze first-time buyers has been an extraordinary wealth-building machine. The housing market is broken. But it is broken in specific, understandable ways. Understanding those ways is the starting point for navigating it. Not financial or real estate advice.
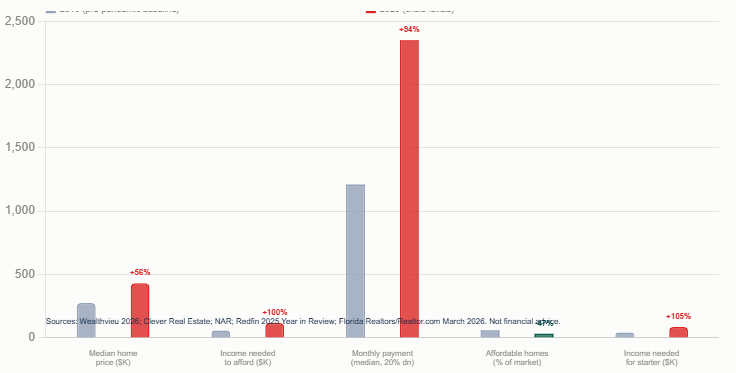
According to Clever Real Estate (cited by multiple outlets including ABC News): first-time buyers need a household income of nearly $120,000 to afford the median-priced home in America, using the standard affordability threshold of 28% of annual income. The Wealthvieu 2026 housing affordability analysis shows the income needed at $112,000-$120,000, compared to approximately $58,000 in 2019 — an increase of 93-107%. The median US household income is approximately $80,000-$82,000, leaving a gap of approximately $30,000-$40,000 per year. For a starter home (below the median), the income needed is approximately $86,000/year (Realtor.com, cited Florida Realtors March 2026). However, these figures vary enormously by region: only West Virginia, Ohio, Iowa, and Indiana have housing markets affordable for median-income earners nationally (Clever Real Estate). Not financial or real estate advice.
Why are US home prices still so high if affordability is so bad?
There are three main structural reasons home prices remain elevated despite the affordability crisis: (1) The lock-in effect: millions of homeowners with 3% mortgages from 2020-2021 are unwilling to sell and take on a new mortgage at 6.5-7%, drastically limiting the supply of existing homes for sale. NAR data shows existing home sales running at just 3.91-3.93 million annually (mpamag.com August 2026; The Close April 2026) versus a historical average of 5-6 million. (2) Structural housing shortage: the US has a deficit of approximately 4.03 million housing units (Realtor.com, cited Florida Realtors March 2026). This supply floor prevents price collapse even when demand weakens. (3) New construction cost pressure: the cost to build a new home has risen significantly due to labour, land, and materials costs, establishing a floor below which builders cannot profitably operate. Housing analyst John Burns (December 2025): 'Home prices remain high because two forces are working together: a structural housing shortage and a lock-in effect.' Not financial advice.
What is the mortgage rate lock-in effect?
The lock-in effect refers to the reluctance of existing homeowners to sell their homes because doing so would require them to give up their current low mortgage rate (typically 2.5-4% from 2020-2021) and take on a new mortgage at the current higher rate (6.5-7%). On a $400,000 mortgage, the difference between 3% and 6.75% is approximately $700/month — $8,400/year — a compelling reason to stay put. Bank of America economists: 'The wide gap between current mortgage rates and effective mortgage rates means most homeowners are unwilling to move unless forced.' The result is dramatically reduced existing home inventory, which helps keep prices high despite the affordability crisis. Active listings in January 2026 rose 10% year-over-year but remained well below pre-pandemic norms (The Close April 2026). Not financial advice.
Will the US housing market crash in 2026?
Most mainstream housing economists do not forecast a broad national housing crash in 2026. The primary reason: a crash requires forced selling, and the lock-in effect actively prevents it. Homeowners with 3% mortgages are not distressed sellers. Redfin's 2026 forecast describes the year as potentially 'the Great Housing Reset' — a rebalancing rather than a crash. Morningstar Q1 2026: if rates decline, existing home sales should recover. The most bearish scenarios are concentrated in specific oversupplied markets: pandemic-boom Sun Belt cities (parts of Florida, Arizona, Nevada) where excess new construction supply is driving price declines. December 2025 Case-Shiller data showed Tampa and Miami with the steepest price declines in the country. A 2008-style national crash — driven by subprime mortgage defaults and forced liquidation — is not in the base case, because current homeowners generally have strong equity positions and fixed-rate mortgages. Capital Economics: 'strained affordability will continue for would-be buyers through 2026.' Not financial advice.
What is the US housing shortage and how does it affect buyers?
The US housing shortage refers to the estimated 4.03 million unit deficit between the number of homes that exist and the number needed to meet demand (Realtor.com, cited Florida Realtors March 2026). This shortage has been building for over a decade, accelerating after the 2008 financial crisis devastated the homebuilding industry. It means that even if mortgage rates fell and demand increased significantly, there would not be enough homes to meet demand without a substantial increase in new construction. For buyers, the shortage acts as a price floor: because supply is structurally limited, prices cannot fall to the level that demand would otherwise dictate. New construction in 2025 fell approximately 50,000 units short of even new household formation, let alone the backlog. Morningstar Q1 2026: new home inventory now sits at 10.3 months of supply vs 6.2 months historical average — meaning new home supply has improved, but the overall market remains constrained. Not financial advice.
Table of Contents
- The State of Play: How Bad Is It Really?
- Problem 1: Prices That Have Run Away From Wages
- Problem 2: Mortgage Rates That Doubled
- Problem 3: The Lock-In Effect — Why Nobody Is Selling
- Problem 4: The 4 Million Unit Housing Shortage
- Problem 5: First-Time Buyers Are Being Erased
- The Affordability Breakdown: 2019 vs 2026
- The Regional Picture: Where It’s Worst (and Where It’s Not)
- Is a Housing Crash Coming? What the Experts Say
- What You Can Actually Do: Practical Options for 2025–26
- Conclusion: Broken, But Not Hopeless
- Frequently Asked Questions
The affordability collapse — 2019 vs 2026 side by side
Mortgage rates and payment impact — the doubling effect
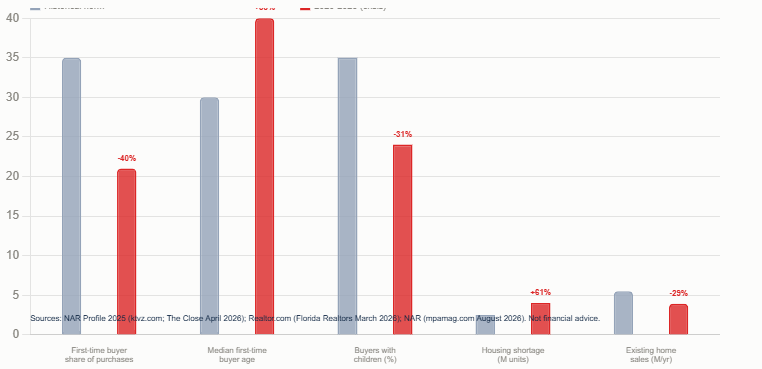
First-time buyers — being erased from the market
The State of Play: How Bad Is It Really?
The US housing market is experiencing its worst affordability crisis in recorded history. That is not hyperbole — it is what the data shows when you compare the relationship between home prices, mortgage rates, and household incomes. The median existing home sale price hit $435,300 in June 2026, marking the 24th consecutive month of year-over-year price growth (NAR, cited mpamag.com). To afford that home at the standard 28%-of-income affordability threshold with a 20% down payment and a 6.75% mortgage rate, you need a household income of approximately $120,000. The median US household income is approximately $82,000.That gap — approximately $38,000 per year between what the median household earns and what the median home requires — is the housing crisis in one number. Morningstar’s Q1 2026 Housing Market Pulse report puts it directly: ‘Housing affordability remains the central obstacle for the US housing market in 2026. The median existing-home price rose 50% between 2019 and 2024, while household income grew far more slowly.’ The income that grew far more slowly? Approximately 19%. Prices up 50%. Incomes up 19%. That is the compounding structural failure behind every frustrated would-be homebuyer in America right now.
This article is not doom-scrolling for its own sake. The purpose is to explain the specific, distinct problems that have produced this crisis, show you where the data comes from, and then provide real, specific options for navigating it. Not financial or real estate advice.
State of the US housing market (2025-2026): median existing home sale price June 2026: $435,300 (NAR; 24th consecutive month of YoY growth; mpamag.com August 2026). All-time high June 2025: $446,000 (Redfin 2025 Year in Review). Income needed to afford median home: ~$120,000/year (Clever Real Estate). Median US household income: ~$82,000/year. Affordability gap: ~$38,000/year. Monthly mortgage payment increase 2019 vs 2026: $1,210 → $2,350 (+94%) (Wealthvieu 2026). Median home price up 50% from 2019-2024 vs household income up ~19% (Morningstar Q1 2026). Not financial advice.
Problem 1: Prices That Have Run Away From Wages
Between 2019 and 2024, the median US home price rose from approximately $275,000 to approximately $420,000 — a 53% increase (Wealthvieu 2026). Over the same period, household income grew approximately 19%. The divergence between those two numbers is the engine of the affordability crisis. When prices rise at nearly three times the rate of incomes, a market that was already stretched becomes structurally inaccessible for a growing share of the population.The pandemic-era price surge was driven by a specific combination that is unlikely to repeat but also unlikely to fully unwind: historically low mortgage rates (the 30-year fixed rate dropped to approximately 2.65% in January 2021), massive fiscal stimulus, remote work migration to previously affordable markets, and a rush of buyers who all wanted more space at the same time. The result was a 25–30% price surge in 2021 alone in many markets. Those gains have not reversed.
In 2025, the full-year median sale price across all US markets averaged 1.7% higher than 2024 — modest growth, but still growth, on top of already-record levels (Redfin 2025 Year in Review). Every single month in 2025 surpassed its corresponding 2024 median. As John Burns, housing analyst and founder of John Burns Research and Consulting, noted in December 2025: ‘The only way to fix affordability is through income growth, falling home prices or declining mortgage rates.’ He was blunt about the first option: ‘I don’t know many people getting 56% raises this year.’ Not financial advice.
Problem 2: Mortgage Rates That Doubled
The single biggest lever on monthly housing affordability is the mortgage rate. In January 2021, the 30-year fixed rate fell to approximately 2.65% — the lowest in US history. By October 2023, the Federal Reserve’s aggressive tightening cycle had pushed the same rate to approximately 8%. That is a near-tripling of the cost of borrowing money to buy a house in less than three years.Rates have since fallen from their peak. By early 2026, the 30-year fixed rate was in the 6.5–7.0% range, with Freddie Mac citing approximately 6.7% in August 2025 (mpamag.com). Redfin predicts an average of 6.3% for 2026. But even 6.3% is dramatically higher than the 3.9% rate of 2019. On a $350,000 loan (80% of a $437,500 purchase), the difference between a 3.9% rate and a 6.5% rate is approximately $495 per month — $5,940 per year — $178,200 over the life of the loan. That is not noise. That is the difference between affording a home and not.
Morningstar’s Q1 2026 report states: ‘Mortgage rates are the biggest lever on housing demand right now, with the average 30-year fixed mortgage rate more than doubling from its 2021 low.’ The Wealthvieu 2026 affordability data confirms the payment impact: the monthly payment on the median US home (20% down) went from approximately $1,210 in 2019 to approximately $2,350 in 2026 — a 94% increase. Not financial advice.
Mortgage rate history: 30-yr fixed rate January 2021: ~2.65% (historic low); October 2023: ~8% (peak); early 2026: ~6.5-7.0%. Freddie Mac August 2025: ~6.7%. Redfin forecast 2026: ~6.3% average. Fannie Mae: ~6.0% by end of 2026. Pre-pandemic 2019: ~3.9%. Monthly payment on median-priced home (20% down): 2019 at 3.9% = ~$1,210/month; 2026 at 6.75% = ~$2,350/month = +94%. Sources: Redfin 2025 Year in Review; mpamag.com; Morningstar Q1 2026; Wealthvieu 2026. Not financial advice.
Problem 3: The Lock-In Effect — Why Nobody Is Selling
Here is the invisible hand squeezing the housing market from the supply side. During 2020 and 2021, millions of American homeowners either bought or refinanced their homes at mortgage rates of 3% or below. Those rates are now gone. The current 30-year fixed rate is more than double the rate many existing homeowners carry. The result is an almost complete paralysis of the existing home market: nobody with a 2.75% mortgage wants to give it up to buy a new home at 6.5% or 7%.This is the lock-in effect, and it is one of the primary reasons why existing home sales have collapsed to levels not seen since the early 1990s. NAR data (cited mpamag.com August 2026) shows existing-home sales running at an annual pace of just 3.91–3.93 million — far below the historical average of approximately 5–6 million per year. The Close (April 2026) reports that active listings rose 10% year-over-year in January 2026 — encouraging, but still well below pre-pandemic norms.
The lock-in effect creates a vicious cycle: fewer listings mean fewer choices for buyers, which keeps prices elevated despite the affordability crisis, which pushes buyers to the sidelines, which further reduces transaction volume. Housing analyst John Burns described the market as ‘drifting toward balance by way of more resale listings, more new home supply, and a much smaller shortage than previously speculated’ — but cautioned that affordability remains the dominant barrier regardless of inventory direction. Not financial advice.
The wide gap between current mortgage rates and effective mortgage rates means most homeowners are unwilling to move unless forced.' (Bank of America economists, cited IBTimes/BusinessInsider.) Housing economist Lawrence Yun: rates expected to settle near 6% by early 2026. Redfin economic research lead Chen Zhao: 'My advice for serious buyers who can afford today's costs is to shop for your dream home and accept that this year is probably not the time to find a dream deal.' Not financial advice.
Problem 4: The 4 Million Unit Housing Shortage
Even if mortgage rates fell tomorrow, even if prices corrected 10%, there would still be a fundamental structural problem in US housing: there are not enough homes. According to Realtor.com’s housing supply gap analysis cited by Florida Realtors (March 2026), the US faced a deficit of approximately 4.03 million homes in 2025. New construction started approximately 1.36 million homes in 2025, while approximately 1.4 million new households were formed — meaning construction fell 50,000 units short of new household formation, let alone addressing the existing backlog.This shortage is not new. It has been building for over a decade, accelerating after the 2008 financial crisis cratered the homebuilding industry. Many of the small and mid-size homebuilders that went bankrupt or exited the market after 2008 never came back. The industry consolidated, labour costs rose, regulatory and zoning barriers proliferated, and the pace of new construction never returned to pre-crisis levels in most markets. The pandemic demand surge collided with this structural undersupply in 2020–21, producing the price explosion that created the current crisis.
In 2026, Morningstar reports that new home inventory sits at 10.3 months of supply — well above the historical average of 6.2 months. This sounds like good news for buyers, and in the new-home market it partially is. But the overall existing-home market remains far below pre-pandemic inventory. The Close (April 2026): ‘Home prices remain high because two forces are working together: a structural housing shortage and a lock-in effect that discourages existing owners from selling.’ Not financial advice.
US housing shortage: 4.03 million units in 2025 (Realtor.com, cited Florida Realtors March 2026). New construction 2025: ~1.36 million starts; new household formation: ~1.4 million = shortfall of ~50,000 per year. Nearly 2 million young adults priced out in 2025 (same source). New home months of supply Q1 2026: 10.3 months vs historical average 6.2 months (Morningstar Q1 2026). Existing-home sales annual rate June 2026: 3.93 million (NAR, mpamag.com) -- vs historical average ~5-6 million. Housing supply up 33% year-over-year but still below pre-pandemic norms (CJ Patrick Company, cited mpamag.com). Not financial advice.
Problem 5: First-Time Buyers Are Being Erased
The most revealing statistic in the current US housing market is this: in 2025, first-time buyers accounted for just 21% of home purchases — a record low (NAR Profile of Home Buyers and Sellers 2025, cited The Close April 2026 and ktvz.com). In a healthy housing market, first-time buyers typically represent 30–40% of transactions. They are the engine of the market: they buy starter homes, which frees up those sellers to buy mid-range homes, which enables those sellers to buy larger homes. When first-time buyers disappear from the bottom rung, the entire ladder seizes up.To understand why first-time buyers have nearly vanished, look at the math. Clever Real Estate found that buyers need a household income of nearly $120,000 to afford the median-priced home in America. The income needed just to buy a starter home — not the median home but an entry-level property — reached approximately $86,000/year in 2025 (Realtor.com, cited Florida Realtors March 2026). The typical down payment averaged 14.4% — on a $420,000 home, that is $60,480 in cash.
The demographic consequences are becoming visible. The median age of a first-time buyer hit 40 years old in 2025 (NAR 2025), up from a historic norm in the late 20s to early 30s. The share of buyers with children dropped to a historic low of 24%. Nearly 2 million young adults remain with family members or in shared housing arrangements because homeownership is financially out of reach. Redfin’s year-in-review noted that the affordability crisis ‘is accelerating fastest in rural America, where buyers need to earn nearly twice as much as they did before the pandemic to afford a typical home.’ Not financial advice.
The Affordability Breakdown: 2019 vs 2026
The Regional Picture: Where It’s Worst (and Where It’s Not)
The national median conceals significant regional variation. Redfin’s 2025 year-in-review and forecast for 2026 projects that New York and Midwest markets will heat up, while Florida, Texas, and Tennessee will cool further. The pattern reflects the aftermath of pandemic-era migration: Sun Belt cities that absorbed huge inflows of buyers from 2020 to 2022 now have oversupply (especially of new construction) and softening prices. Markets that were largely bypassed by the pandemic rush are now seeing renewed demand from affordability-driven migration.December 2025 Case-Shiller data (cited cuny.edu/issuenumberone) showed Sun Belt cities — Tampa and Miami specifically — with the steepest price declines of any major market, attributable to excess housing development during the pandemic. Meanwhile, Midwest markets in cities like Indianapolis, Columbus, and Kansas City remained significantly more affordable than coastal and Sun Belt markets. Only four states have housing markets affordable for median-income earners: West Virginia, Ohio, Iowa, and Indiana (Clever Real Estate).
For prospective buyers priced out of high-cost markets, the regional disparity creates a genuine option: relocation to affordable markets is one of the few practical near-term solutions available. The Wealthvieu housing affordability crisis 2026 analysis specifically identifies the Midwest and South as offering 40–60% lower home prices relative to high-cost coastal and Sun Belt markets. This option requires a willingness to move, but it is one of the few genuine affordability solutions available to median-income households in 2026. Not financial or real estate advice.
Is a Housing Crash Coming? What the Experts Say
The question on every frustrated buyer’s mind is whether to wait for prices to collapse. The expert consensus, while not unanimous, generally does not support a broad national price crash in the near term. The reason: a crash requires forced selling, and the lock-in effect is actively preventing it. Homeowners with 3% mortgages are not distressed sellers. They are sitting tight, which limits supply and puts a floor under prices regardless of the affordability crisis.Morningstar’s Q1 2026 outlook: ‘If mortgage rates decline further, Morningstar expects existing-home sales to recover and turnover to increase.’ The base case for most housing economists is a gradual correction rather than a crash: prices flat to modestly declining in oversupplied Sun Belt markets; prices flat to modestly rising in supply-constrained Midwest and Northeast markets; mortgage rates slowly declining toward the mid-5% range over the next 2–3 years as the Fed continues its easing cycle. Redfin describes 2026 as potentially ‘the year of the Great Housing Reset’ — not a crash, but a rebalancing.
Capital Economics economist Thomas Ryan takes a somewhat more pessimistic view: ‘the combination of steadily rising home prices and higher mortgage rates will result in the continuation of strained affordability for would-be homebuyers over the next two years.’ The most bearish scenario is concentrated in specific markets: pandemic-boom cities with excess new construction supply (parts of Florida, Arizona, Nevada) where price declines are more likely. But a national 2008-style crash — driven by credit defaults and forced selling — is not in the base case of most mainstream forecasters. Not financial or real estate advice.
What You Can Actually Do: Practical Options for 2025–26
The housing crisis is structural and real. But there are specific, concrete strategies available to different types of participants in this market. These are not feel-good platitudes — they are the options that the data supports. Not financial or real estate advice.For Aspiring First-Time Buyers
- Target affordable markets in the Midwest and South: Wealthvieu 2026 identifies cities in Ohio, Indiana, Iowa, West Virginia, and parts of the Midwest South where homes remain affordable for median-income households. Remote work makes geographic flexibility more viable than at any previous point.
- 'Date the rate, marry the house': buy at today's prices, accept the current rate, and refinance when rates fall. The calculation: if rates fall to 5.5% from 6.75% on a $350,000 loan, monthly payments drop by approximately $280/month, saving $3,360/year. You keep the appreciated value of the home.
- FHA loans: Federal Housing Administration loans require as little as 3.5% down (vs the typical 14.4% average down payment in 2025). The trade-off is mortgage insurance premiums. For buyers with limited savings, FHA is the primary tool.
- Down payment assistance programmes: most states offer DPA programmes for first-time buyers with income below certain thresholds. These are generally under-utilised and can provide $10,000-$25,000 in grants or low-interest loans. Check your state housing finance agency.
- House hacking: buy a multi-family property (duplex, triplex), live in one unit, rent the others. Rental income offsets 50-100% of the mortgage, dramatically improving the affordability math. This is the most powerful affordability tool available and almost never discussed in mainstream coverage.
For Renters Waiting It Out
- Invest the difference: if renting costs less than buying in your market, the monthly savings are an investment opportunity. Investing $500-$1,000/month in an S&P 500 index fund while renting can build wealth even without homeownership.
- Build your down payment aggressively in a high-yield savings account (HYSA) or Series I savings bond. As of October 2026, the best US HYSAs offer approximately 4.0-4.5% APY.
- Track your target market closely. Redfin and Zillow provide real-time data on price trends, days on market, and price cuts in any zip code. When you see days-on-market rising and price cuts increasing, your market is softening.
For Existing Homeowners
- Stay put if you have a sub-4% mortgage, unless there is a compelling life reason to move. The financial penalty of giving up a 3% rate for a 6.5% rate on even a $300,000 mortgage is approximately $370/month = $4,440/year = $133,200 over 30 years.
- If you must move, consider renting out your current home and renting at your destination rather than selling. This allows you to keep the low-rate mortgage as a rental asset while avoiding the need for a new high-rate mortgage.
Conclusion
The US housing market in 2025–26 is broken by most conventional affordability measures. The data is unambiguous: prices up 53% since 2019; wages up 19%; monthly payments nearly doubled; first-time buyer share at a record low 21%; median first-time buyer age now 40; 4.03 million unit housing shortage; existing-home sales at their lowest level since the early 1990s. Morningstar’s verdict: ‘Housing affordability remains the central obstacle.’ John Burns’ diagnosis: affordability requires income growth, price falls, or rate declines — and none of the three is imminent.The structural forces — the lock-in effect, the decade-long housing supply deficit, the post-2008 collapse of homebuilding capacity — will take years to unwind. There is no quick fix. Redfin’s description of 2026 as a potential ‘Great Housing Reset’ is optimistic, and there are regional pockets where genuine rebalancing is occurring (Sun Belt oversupply markets, new construction inventory in Texas and Florida). But for the median would-be buyer in most major US metro areas, the crisis is real and ongoing.
Hopeless it is not. The options — geographic flexibility, FHA loans, house hacking, down payment assistance, the rent-and-invest strategy — are real. The Midwest and parts of the South remain genuinely affordable. Rates will eventually fall further. New construction, however slowly, is adding supply. And for the 23.8 million Americans who already own a home with substantial equity, the same market that froze first-time buyers has been an extraordinary wealth-building machine. The housing market is broken. But it is broken in specific, understandable ways. Understanding those ways is the starting point for navigating it. Not financial or real estate advice.
Frequently Asked Questions
How much income do you need to buy a house in 2026?According to Clever Real Estate (cited by multiple outlets including ABC News): first-time buyers need a household income of nearly $120,000 to afford the median-priced home in America, using the standard affordability threshold of 28% of annual income. The Wealthvieu 2026 housing affordability analysis shows the income needed at $112,000-$120,000, compared to approximately $58,000 in 2019 — an increase of 93-107%. The median US household income is approximately $80,000-$82,000, leaving a gap of approximately $30,000-$40,000 per year. For a starter home (below the median), the income needed is approximately $86,000/year (Realtor.com, cited Florida Realtors March 2026). However, these figures vary enormously by region: only West Virginia, Ohio, Iowa, and Indiana have housing markets affordable for median-income earners nationally (Clever Real Estate). Not financial or real estate advice.
Why are US home prices still so high if affordability is so bad?
There are three main structural reasons home prices remain elevated despite the affordability crisis: (1) The lock-in effect: millions of homeowners with 3% mortgages from 2020-2021 are unwilling to sell and take on a new mortgage at 6.5-7%, drastically limiting the supply of existing homes for sale. NAR data shows existing home sales running at just 3.91-3.93 million annually (mpamag.com August 2026; The Close April 2026) versus a historical average of 5-6 million. (2) Structural housing shortage: the US has a deficit of approximately 4.03 million housing units (Realtor.com, cited Florida Realtors March 2026). This supply floor prevents price collapse even when demand weakens. (3) New construction cost pressure: the cost to build a new home has risen significantly due to labour, land, and materials costs, establishing a floor below which builders cannot profitably operate. Housing analyst John Burns (December 2025): 'Home prices remain high because two forces are working together: a structural housing shortage and a lock-in effect.' Not financial advice.
What is the mortgage rate lock-in effect?
The lock-in effect refers to the reluctance of existing homeowners to sell their homes because doing so would require them to give up their current low mortgage rate (typically 2.5-4% from 2020-2021) and take on a new mortgage at the current higher rate (6.5-7%). On a $400,000 mortgage, the difference between 3% and 6.75% is approximately $700/month — $8,400/year — a compelling reason to stay put. Bank of America economists: 'The wide gap between current mortgage rates and effective mortgage rates means most homeowners are unwilling to move unless forced.' The result is dramatically reduced existing home inventory, which helps keep prices high despite the affordability crisis. Active listings in January 2026 rose 10% year-over-year but remained well below pre-pandemic norms (The Close April 2026). Not financial advice.
Will the US housing market crash in 2026?
Most mainstream housing economists do not forecast a broad national housing crash in 2026. The primary reason: a crash requires forced selling, and the lock-in effect actively prevents it. Homeowners with 3% mortgages are not distressed sellers. Redfin's 2026 forecast describes the year as potentially 'the Great Housing Reset' — a rebalancing rather than a crash. Morningstar Q1 2026: if rates decline, existing home sales should recover. The most bearish scenarios are concentrated in specific oversupplied markets: pandemic-boom Sun Belt cities (parts of Florida, Arizona, Nevada) where excess new construction supply is driving price declines. December 2025 Case-Shiller data showed Tampa and Miami with the steepest price declines in the country. A 2008-style national crash — driven by subprime mortgage defaults and forced liquidation — is not in the base case, because current homeowners generally have strong equity positions and fixed-rate mortgages. Capital Economics: 'strained affordability will continue for would-be buyers through 2026.' Not financial advice.
What is the US housing shortage and how does it affect buyers?
The US housing shortage refers to the estimated 4.03 million unit deficit between the number of homes that exist and the number needed to meet demand (Realtor.com, cited Florida Realtors March 2026). This shortage has been building for over a decade, accelerating after the 2008 financial crisis devastated the homebuilding industry. It means that even if mortgage rates fell and demand increased significantly, there would not be enough homes to meet demand without a substantial increase in new construction. For buyers, the shortage acts as a price floor: because supply is structurally limited, prices cannot fall to the level that demand would otherwise dictate. New construction in 2025 fell approximately 50,000 units short of even new household formation, let alone the backlog. Morningstar Q1 2026: new home inventory now sits at 10.3 months of supply vs 6.2 months historical average — meaning new home supply has improved, but the overall market remains constrained. Not financial advice.
0 Comments
Be the first to share your thoughts on this article.