

Knowledge
Why Is the US Economy Pulling Ahead of Europe?
In 2008 the European Union's economy was fractionally larger than America's. By 2024, US GDP had reached $29.2 trillion — almost double the Eurozone's $16.4 trillion. The gap is real, significant, and has accelerated since the Covid pandemic. This guide examines the key drivers — from productivity and technology to energy, capital markets, and defence — and honestly weighs the counter-arguments that challenge the simplest version of the story.
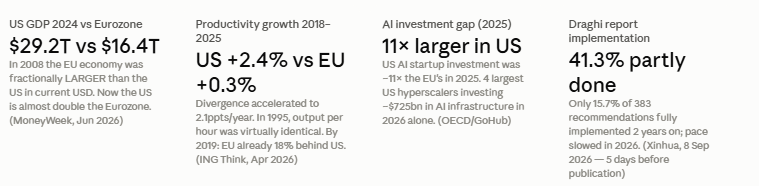
By 2024, US GDP had reached $29.2 trillion — approximately 27.5% of global GDP. The Eurozone stood at $16.4 trillion, or 14.7%, and the UK at $4 trillion (MoneyWeek, June 2026). The US economy is now almost double the Eurozone's. EU GDP per capita as a percentage of US GDP per capita fell from 76.5% in 2008 to approximately 50% in 2023 (Econofact, citing World Bank). US workers have experienced 73% productivity growth since 1990 — a figure with few parallels in the developed world.
This article examines seven structural drivers of the divergence, from technology investment and energy costs to capital markets and demographics. It also honestly engages with the counter-arguments: distinguished economists including Paul Krugman and Bruegel's Zsolt Darvas have argued that parts of the gap are statistical artefacts rather than economic reality. Understanding the genuine drivers and the genuine measurement debates is essential for any honest assessment.
US GDP 2024: $29.2T (27.5% of global GDP). Eurozone: $16.4T (14.7%). UK: $4T. EU GDP per capita as % of US: fell from 76.5% (2008) to ~50% (2023, World Bank). US productivity growth since 1990: 73%. EU productivity grew ~0.7ppts/year 2000–2019 vs US ~1.2ppts/year. 2018–2025: acceleration — US +2.4%/year vs Europe +0.3%/year (ING Think, April 2026). Of 50 largest tech firms globally: 4 are European (Draghi report).
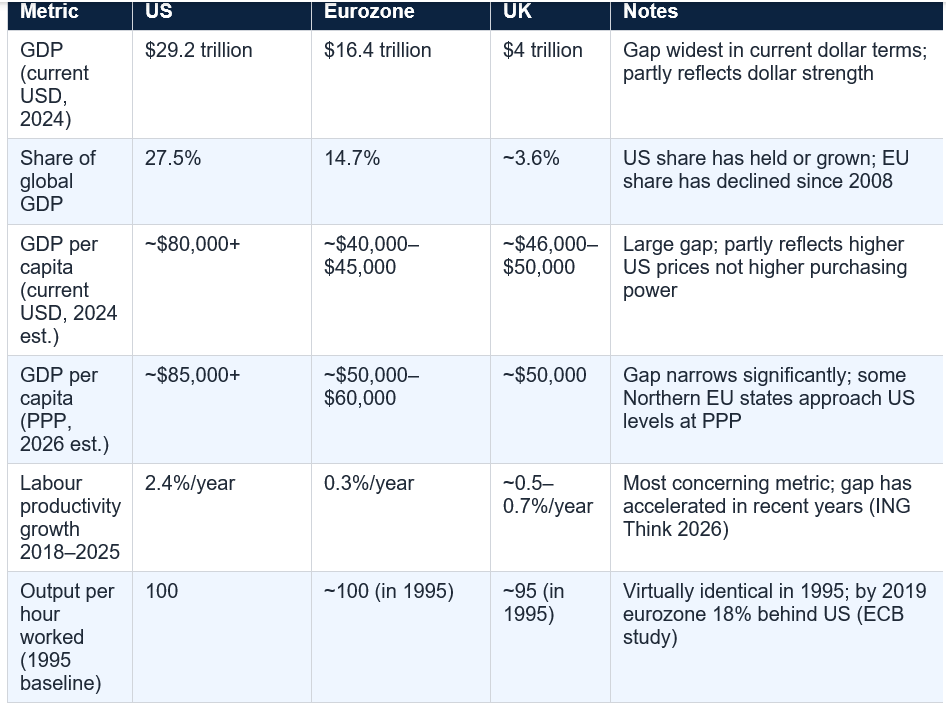
Between 2018 and 2025, the divergence reached an estimated 2.1 percentage points per year — with productivity growing 2.4% annually in the US compared to just 0.3% in Europe. ING economists describe these as 'sobering numbers.' The MoneyWeek analysis (June 2026) captures the long-run picture: 'There's been 73% productivity growth for US workers since 1990.'
The source of the productivity gap is heavily concentrated in one sector: information and communications technology (ICT). The Draghi report on EU competitiveness — the most comprehensive European self-assessment of the problem — notes that when the ICT sector is stripped out, the annual productivity growth gap for 2000–2019 falls from 0.5 percentage points to just 0.2 percentage points. As ING's analysis shows, approximately 45% of US total factor productivity growth between 1988 and 2023 can be traced to the IT sector.
The US-Europe productivity gap is overwhelmingly a technology sector story. Outside ICT, the two economies are much closer in performance than headline numbers suggest. This creates both a diagnosis and an implication: Europe's productivity problem is primarily a failure to create, scale, and retain technology companies at the frontier of innovation — not a broad-based failure of European workers, businesses, or institutions. The prescription is therefore more targeted than the diagnosis sometimes implies.
The counter-argument: Bruegel's Zsolt Darvas argues that in terms of output per capita growth, the EU has in fact outperformed the US since 2000, and some EU countries are as productive as the US in output per hour worked. The divergence in total GDP is partly driven by the fact that Americans work longer hours than Europeans — not that they produce more per hour worked. Productivity per hour (which adjusts for leisure preferences) is a more welfare-relevant comparison than GDP per hour.
Of the 50 largest technology firms in the world, only four are European (Draghi report, cited Econofact). The US is home to the seven largest companies in the world by market capitalisation — Apple, Microsoft, Nvidia, Alphabet, Amazon, Meta, and Tesla — all of which are technology companies. Europe's largest companies, by contrast, are concentrated in pharmaceuticals, energy, luxury goods, and financial services: sectors with meaningful but bounded productivity growth potential.
The AI investment gap is even starker. AI startup investments in the US were approximately 11 times larger than those in the EU in 2025 (OECD AI Observatory, cited ING Think, April 2026). The four largest US hyperscalers — Google, Meta, Microsoft, and Amazon — are on track to invest approximately $725 billion in AI infrastructure in 2026 alone (GoHub Ventures, July 2026). To put this in context, the entire Draghi competitiveness programme estimated Europe needed EUR 750–800 billion in additional annual investment across its entire economy to close the gap.
US business investment is projected to rise 40% in real terms between 2021 and the end of 2027, driven by AI infrastructure spending. The euro area: just 12%. German business investment — from what was considered Europe's industrial engine — has nearly stagnated over the same period (Oxford Economics, cited Kalkine, August 2026). Tech spend in North America is projected to grow 9% in 2026 versus 6.3% for Europe (Forrester, February 2026). US AI research investment now exceeds $109 billion per year.
Data point: The Draghi report identifies a central cause of this investment deficit: EU companies spent EUR 270 billion less on R&D than their US counterparts in 2021. The top three R&D investors in Europe have been dominated by automotive companies for the past twenty years. In the US, the top three R&D investors are now all in technology. The European problem is not a lack of researchers or ideas — it is a failure to translate innovation into commercialisation at scale.
The US venture capital market dwarfs Europe's. In 2025, US AI startup investments were 11 times larger than EU equivalents. But the gap goes beyond AI: across all technology sectors, US venture capital as a proportion of GDP is significantly larger than Europe's. More importantly, the US has a deep pool of institutional investors — pension funds, endowments, sovereign wealth-adjacent structures — that are willing to take technology risk in pursuit of returns. European institutional capital, by contrast, is more risk-averse and more heavily regulated in its investment mandate.
The CEPR/Draghi analysis of European capital markets identifies a self-reinforcing cycle. Technology companies need venture capital to scale; venture capital funds need large exits (via IPO or acquisition) to generate returns; large exits require deep, liquid public equity markets; and the deepest, most liquid public equity markets are in the US. European technology companies that reach a certain scale frequently relocate to the US — or list there — because that is where capital, talent, and customers are most readily available. This is not a failure of European ambition; it is a structural feature of a fragmented capital market with 27 separate national regulatory frameworks.
The CERRE paper from January 2026 emphasises this: 'The growth of US tech giants is likely to be a result, rather than a cause, of the US's ability to achieve higher productivity growth — which implies that Europe should not simply emulate the US model without addressing underlying causes such as the lack of a single market.' The absence of a genuine single European capital market is one of the Draghi report's central diagnoses.
US businesses benefit from abundant domestic energy supply through natural gas (including shale gas), a large domestic grid, and — increasingly — solar and wind at competitive prices. Industrial electricity prices in the US are broadly 40–60% lower than in Germany, Europe's largest economy. For energy-intensive industries — chemicals, steel, aluminium, paper, ceramics — this is a direct competitiveness disadvantage that cannot be easily managed through efficiency gains.
The Xinhua analysis published five days before this article (September 8, 2026) notes that two years after the Draghi report: 'The latest Middle East conflict has once again exposed Europe's vulnerability to high energy costs.' A new round of energy price volatility in 2026, driven by the geopolitical conflict that began in February, has renewed pressure on European industry. This is not a short-term problem — it reflects decades of underinvestment in domestic energy production and an energy transition that has been uneven across EU member states.
The European Energy Agency's data shows that industrial electricity prices in Germany and France in 2025 were approximately 2–3× those in the US. For a manufacturing company choosing where to site a new facility, this differential — applied to multi-year operational costs — makes Europe systematically less attractive than North America or even parts of Asia.
The counter-argument: The green transition argument runs the other way: Europe's earlier and more comprehensive investment in renewable energy means it is better positioned for a world of cheap solar and wind. By 2030, European renewable electricity is expected to be extremely cheap on a marginal basis. But the transition costs — borne now — are real; the benefits are future.
MoneyWeek (June 2026) identifies this clearly: 'Others point to America's growing population and the fact that it's getting younger compared with Europe.' The US fertility rate, while below replacement level, is higher than most European countries. More significantly, the US has historically attracted large numbers of highly skilled immigrants, including from Europe. Silicon Valley's technology ecosystem was built substantially on immigrant talent — a disproportionate share of the founders of the largest US technology companies were born outside the US.
Europe faces a more acute demographic challenge. Germany, Italy, Spain, and Portugal have fertility rates well below replacement level. Ageing populations mean higher dependency ratios — more retirees relative to workers — which pressures both government finances and labour supply. Immigration to Europe has been substantial but has generated significant political friction, limiting its contribution to economic growth relative to the US model.
The demographic divergence also affects investment: younger populations require more housing, education, and consumer goods; ageing populations shift resources toward healthcare and pensions. For GDP growth, younger is generally better — and the US is younger than Europe.
Where it has merit: European digital market regulation has been more restrictive on the activities of large technology platforms (GDPR, Digital Markets Act, Digital Services Act, AI Act). While these regulations have important consumer and democratic benefits, they have also imposed compliance costs and created legal uncertainty that has deterred some technology investment and slowed some product launches in Europe. European competition law has been more aggressive against large technology firms.
The deeper problem, however, is not that Europe over-regulates — it is that it under-integrates. The EU single market is still far from complete. Financial services, capital markets, energy networks, telecommunications, and digital services all face significant remaining national fragmentation. A technology startup in the US operates in a single market of 340 million consumers with one language, one set of securities laws, one currency, and one court system for most commercial purposes. A European startup faces 27 different regulatory regimes, multiple languages, fragmented capital markets, and different consumer protection laws. This is a structural disadvantage that regulation reform at the EU level has so far failed to adequately address.
The CERRE paper (January 2026) frames this precisely: Europe should 'address underlying causes such as the lack of a single market.' The Draghi report listed completion of the Capital Markets Union and Banking Union as among the most urgent structural reforms. As of September 2026, progress on these reforms remains limited.
This defence spending surge creates a significant fiscal challenge for economies that are simultaneously trying to invest in digital infrastructure, energy transition, and social protection. The European Central Bank has estimated annual public funding requirements for defence, the green transition, and the digital transition at approximately EUR 510 billion — at a time when fiscal space is limited in many member states. The OECD has noted that the economic effects of higher defence spending are uncertain.
The US, meanwhile, has historically benefited from defence spending as an economic stimulus through its defence-industrial complex: major contractors, research laboratories (DARPA), and technology spillovers. The internet, GPS, semiconductors, and much early artificial intelligence research all emerged from or were substantially funded by the US defence establishment. Europe's defence industrial base is more fragmented — the Draghi report notes that twelve different types of battle tanks are operated in Europe, versus one in the US.
The fiscal pressure from defence spending is not a simple negative — it provides some demand stimulus. But it competes directly with the productive investment in education, research, and infrastructure that drives long-run growth. For Europe in 2026, the two demands are arriving simultaneously and the fiscal resources are limited.
Paul Krugman — the US Nobel laureate — has argued that the alleged America-Europe productivity growth gap is 'really a California-everyone else productivity gap.' Strip out California's technology sector, and the rest of the US looks much more like Europe. The divergence is driven by a handful of technology companies in a specific geography — not by broad-based American economic superiority.
The CEPR's February 2026 analysis goes further, arguing that 'the differences in growth, and especially productivity growth (GDP per hour of work), are driven almost entirely by differences in measurement, not differences in economic performance.' The key measurement issue: US statistical agencies use more aggressive quality adjustment for technology goods — when a new iPhone is more capable than its predecessor, US statistics count this as a real output increase even if the nominal price is unchanged. European statistical agencies use less aggressive quality adjustment. This difference in methodology can produce substantial differences in measured productivity growth even when the underlying economic reality is similar.
Bruegel's Zsolt Darvas provides a third challenge: measured in PPP terms and adjusted for population, the EU has actually outperformed the US on per-capita GDP growth since 2000. The headline dollar gap is substantially driven by dollar strength and different price levels — not purely by economic performance.
The counter-argument: The counter-arguments are serious and deserve weight. But they do not fully resolve the divergence. The technology sector gap is real regardless of whether it is concentrated in California. The measurement argument, while valid, does not explain why US technology companies dominate global markets while European ones do not — if US productivity data were simply overestimating real output, US companies would still be producing the products that the entire world buys. And the PPP adjustment, while analytically important, does not change the lived experience of European businesses competing for global capital, talent, and market share against US counterparts.
Two years on, the Xinhua analysis published on 8 September 2026 — five days before this article — provides a sobering status report: only 15.7% of the 383 recommendations have been fully implemented, and only 41.3% have been fully or partially implemented. Implementation pace slowed sharply in the first half of 2026: the index rose by just 0.6 percentage points (for fully implemented) and 2.4 points (for fully or partially implemented) in the six months following January 2026, versus 3.9 and 7.5 points respectively in the preceding period.
The Xinhua analysis identifies three new headwinds since the Draghi report: energy costs (the Middle East conflict reignited vulnerability), strategic financing (defence spending competing with productive investment), and industrial scale-up (the gap between recognising problems and actually building new industrial capacity). The CERRE paper from January 2026 adds a fourth: the question of whether European regulation needs to be fundamentally rethought for a world of growing geopolitical competition and protectionism.
The Draghi report is not just a list of policy recommendations — it is a recognition by Europe's own economic establishment that the divergence with the US is real, serious, and structural. The implementation gap two years on is itself revealing: the political will to execute the necessary reforms — completing the single market, creating a genuine Capital Markets Union, rationalising defence procurement, reforming energy markets — has not matched the scale of the diagnosis. This is not primarily an economic failure; it is a political one.
The counter-arguments matter and deserve respect. The gap is smaller in PPP terms and per-capita terms than the headline dollar figures suggest. Much of the productivity divergence is concentrated in a single sector (technology) in a single state (California). Some of the measurement differences are statistical rather than economic. European workers trade some GDP for leisure, equality, and social protection — arguably a rational preference.
But none of this changes the structural reality that Europe's technology sector is small, its capital markets are fragmented, its energy costs are high, its defence spending is rising fast, and implementation of the Draghi agenda has been painfully slow. These are solvable problems — but they require political will that has so far been insufficient. The window for catching up is not closed: the renewable energy transition, the next wave of AI applications, and the expansion of deep-tech sectors all offer genuine opportunities for European leadership. What they require is the investment, the regulatory reform, and the single-market depth that would allow European companies to scale the way their US counterparts have.
The US lead is real. But the story of the next twenty years has not been written. Europe's relative performance will be determined not by the factors that drove the past two decades — where the US has already won — but by what happens next in AI applications, green technology, and geopolitical repositioning. On those fronts, the contest is still open.
By 2024, US GDP had reached approximately $29.2 trillion, while Eurozone GDP stood at $16.4 trillion and the UK at $4 trillion (MoneyWeek, June 2026). In current US dollar terms, the US economy is now almost double the Eurozone's — a dramatic reversal from 2008, when the EU economy was fractionally larger. However, measured in purchasing power parity (PPP) terms, which adjusts for different price levels across countries, the gap is meaningfully smaller. Some Northern European countries approach or match US GDP per capita levels at PPP. The most significant divergence is in productivity growth — particularly in the technology sector — rather than in overall living standards, which in many European countries remain broadly comparable to the US when factors like working hours, equality, and access to public services are considered.
Why is the US so much better at producing technology companies than Europe?
Several structural factors: the US has a single national market of 340 million consumers with one language, one regulatory framework, and one capital market — making it far easier to scale a technology company than in Europe's 27-country, multi-language, multi-regulatory environment. US venture capital markets are significantly larger and more willing to fund loss-making growth companies at large scale. US universities (particularly in California, Massachusetts, and New York) have stronger links to industry and produce more commercialisable research. And the US defence and government research ecosystem (DARPA, NASA, NIH) has historically funded basic research that generated commercial technology — the internet, GPS, and early AI research all have roots in this. The Draghi report identifies the lack of a single European capital market as one of the most important structural disadvantages Europe must address.
What is the Draghi report and what has it achieved?
Mario Draghi — former President of the European Central Bank and former Italian Prime Minister — published a landmark report on European competitiveness in September 2024. It was Europe's most comprehensive self-assessment of the productivity and technology gap with the US. The report identified 383 specific policy recommendations and estimated that Europe needed EUR 750–800 billion in additional annual investment to close the competitiveness gap. Two years on (as of September 2026), only 15.7% of recommendations have been fully implemented and 41.3% fully or partially implemented, with implementation pace slowing in the first half of 2026 (Xinhua, September 8, 2026). The report's diagnosis is widely accepted — its prescriptions have been much harder to implement due to the political complexity of coordinating 27 member states.
Is the US-Europe economic gap partly a statistical illusion?
Yes — partly. Paul Krugman has argued the gap is 'really a California-everyone else productivity gap,' driven by a handful of technology companies in one US state rather than broad-based American superiority. The CEPR's February 2026 analysis argues that differences in productivity growth measurement — particularly how US statistical agencies handle quality improvements in technology goods — could account for a significant portion of the apparent divergence. Bruegel's Zsolt Darvas shows that in PPP per-capita terms, the EU has actually outperformed the US on GDP growth since 2000. However, these counter-arguments do not fully resolve the divergence: US technology companies dominate global markets regardless of how their output is measured, and the investment gap (US firms investing 40% more in real terms than European counterparts over 2021–2027) is a real difference in economic activity, not a statistical artefact.
Will Europe catch up with the US economically?
The medium-term forecasts do not predict catching up — they predict continued moderate divergence in technology-driven productivity. However, there are reasons for cautious optimism on specific fronts: Europe's renewable energy transition could become a significant competitive advantage if the green economy develops as expected; European deep-tech sectors (biotech, quantum computing, semiconductors, robotics) are globally competitive and growing; and the completion of the EU Capital Markets Union and single digital market — if achieved — would be transformative for European technology companies. The Draghi agenda, if implemented, could meaningfully narrow the gap by 2030. The risk is that implementation remains slow while the US continues to accelerate in AI and frontier technology investment.
How does the US-Europe gap affect UK investors?
For UK investors (who are outside the EU but trade extensively with both the US and Europe), the divergence has several implications: US equity markets — particularly technology-heavy indices like the S&P 500 and Nasdaq — have significantly outperformed European indices over the past decade. UK investors with diversified global portfolios will have benefited from US equity exposure. The UK economy faces some of the same structural challenges as Europe (productivity stagnation, energy costs, limited technology giants) while also managing the trade friction of Brexit. Sterling's performance relative to the dollar reflects some of these structural differences. For long-term investors, the question is not just whether to be invested in the US today, but whether the next twenty years of technology-driven growth will replicate the pattern of the last twenty — or whether Europe's green-tech and deep-tech strengths, combined with improving regulatory integration, could generate a period of catch-up.
Table of Contents
- From Near-Parity to a Vast and Widening Gulf
- The GDP Scorecard: How Big Is the Gap?
- Driver 1: The Productivity Divergence
- Driver 2: The Technology and AI Investment Chasm
- Driver 3: Capital Markets — Why US Firms Scale, European Ones Don't
- Driver 4: Energy — Europe's Structural Handicap
- Driver 5: Demographics and the Labour Supply Advantage
- Driver 6: The Regulatory Environment and the Single Market Paradox
- Driver 7: Defence Spending — A New Fiscal Burden
- The Counter-Arguments: Is the Gap Partly an Illusion?
- What Europe Has Done Right
- The Draghi Report: Europe's Own Diagnosis — and Its Implementation Problem
- Conclusion: A Structural Gap with Structural Solutions
- Frequently Asked Questions
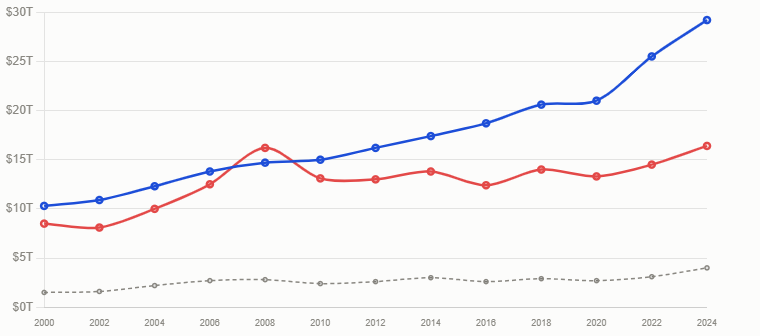
GDP & Productivity Divergence Since 2000 (US= Blue EU= Red)
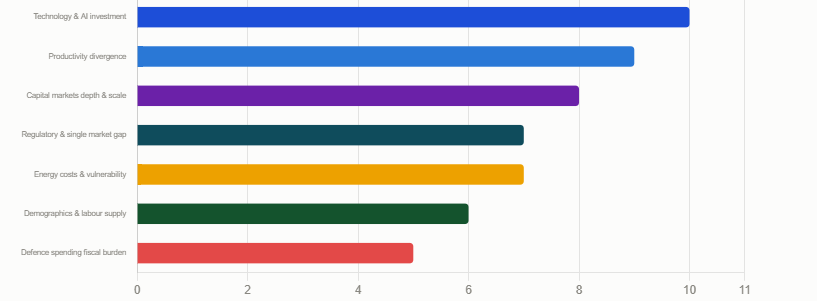
7 Drivers of Divergence: Strenght of Each Factor
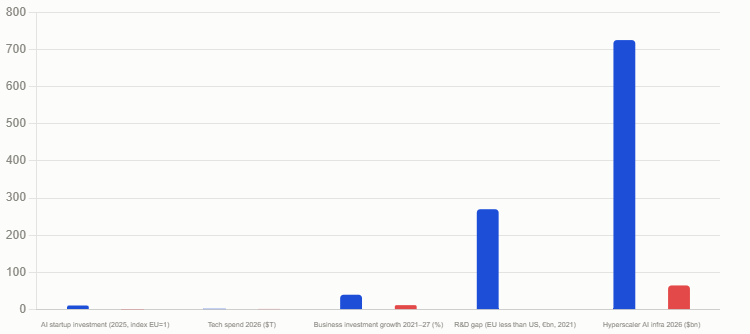
Investment Gap: US vs EU Across Key Sectors
From Near-Parity to a Vast and Widening Gulf
Twenty years ago, the question 'is the US economy bigger than Europe's?' would have had a complicated answer. In 2008, the GDP of the European Union, measured in current US dollars, was in fact fractionally larger than the United States. The two blocs were broadly comparable in size, share of global output, and standard of living. Today that comparison is not even close.By 2024, US GDP had reached $29.2 trillion — approximately 27.5% of global GDP. The Eurozone stood at $16.4 trillion, or 14.7%, and the UK at $4 trillion (MoneyWeek, June 2026). The US economy is now almost double the Eurozone's. EU GDP per capita as a percentage of US GDP per capita fell from 76.5% in 2008 to approximately 50% in 2023 (Econofact, citing World Bank). US workers have experienced 73% productivity growth since 1990 — a figure with few parallels in the developed world.
This article examines seven structural drivers of the divergence, from technology investment and energy costs to capital markets and demographics. It also honestly engages with the counter-arguments: distinguished economists including Paul Krugman and Bruegel's Zsolt Darvas have argued that parts of the gap are statistical artefacts rather than economic reality. Understanding the genuine drivers and the genuine measurement debates is essential for any honest assessment.
US GDP 2024: $29.2T (27.5% of global GDP). Eurozone: $16.4T (14.7%). UK: $4T. EU GDP per capita as % of US: fell from 76.5% (2008) to ~50% (2023, World Bank). US productivity growth since 1990: 73%. EU productivity grew ~0.7ppts/year 2000–2019 vs US ~1.2ppts/year. 2018–2025: acceleration — US +2.4%/year vs Europe +0.3%/year (ING Think, April 2026). Of 50 largest tech firms globally: 4 are European (Draghi report).
The GDP Scorecard: How Big Is the Gap?
The comparison depends critically on the metric used. Measured in current US dollars, the divergence since 2008 is stark: the EU economy has gone from fractionally larger than the US to roughly 60% of its size. Measured in purchasing power parity (PPP) — which adjusts for the different price levels of goods and services in each economy — the gap is smaller but still substantial. And measured in per-capita terms adjusted for PPP, some EU countries come much closer to, and a few even exceed, US levels of output per person.
Driver 1: The Productivity Divergence
If there is a single number that captures the US-Europe divergence most accurately, it is productivity — specifically, output per hour worked. In 1995, this metric was virtually identical on both sides of the Atlantic. By 2019, the Eurozone was already 18% behind the US (ECB study, cited ING Think). Since the pandemic, the gap has widened further: eurozone productivity decelerated sharply relative to its pre-pandemic trend at the end of 2025, while US productivity growth has been accelerating (ING Think, April 2026).Between 2018 and 2025, the divergence reached an estimated 2.1 percentage points per year — with productivity growing 2.4% annually in the US compared to just 0.3% in Europe. ING economists describe these as 'sobering numbers.' The MoneyWeek analysis (June 2026) captures the long-run picture: 'There's been 73% productivity growth for US workers since 1990.'
The source of the productivity gap is heavily concentrated in one sector: information and communications technology (ICT). The Draghi report on EU competitiveness — the most comprehensive European self-assessment of the problem — notes that when the ICT sector is stripped out, the annual productivity growth gap for 2000–2019 falls from 0.5 percentage points to just 0.2 percentage points. As ING's analysis shows, approximately 45% of US total factor productivity growth between 1988 and 2023 can be traced to the IT sector.
The US-Europe productivity gap is overwhelmingly a technology sector story. Outside ICT, the two economies are much closer in performance than headline numbers suggest. This creates both a diagnosis and an implication: Europe's productivity problem is primarily a failure to create, scale, and retain technology companies at the frontier of innovation — not a broad-based failure of European workers, businesses, or institutions. The prescription is therefore more targeted than the diagnosis sometimes implies.
The counter-argument: Bruegel's Zsolt Darvas argues that in terms of output per capita growth, the EU has in fact outperformed the US since 2000, and some EU countries are as productive as the US in output per hour worked. The divergence in total GDP is partly driven by the fact that Americans work longer hours than Europeans — not that they produce more per hour worked. Productivity per hour (which adjusts for leisure preferences) is a more welfare-relevant comparison than GDP per hour.
Driver 2: The Technology and AI Investment Chasm
The most visible and arguably most consequential driver of the US-Europe gap in 2026 is the scale of technology and artificial intelligence investment. The numbers are extraordinary.Of the 50 largest technology firms in the world, only four are European (Draghi report, cited Econofact). The US is home to the seven largest companies in the world by market capitalisation — Apple, Microsoft, Nvidia, Alphabet, Amazon, Meta, and Tesla — all of which are technology companies. Europe's largest companies, by contrast, are concentrated in pharmaceuticals, energy, luxury goods, and financial services: sectors with meaningful but bounded productivity growth potential.
The AI investment gap is even starker. AI startup investments in the US were approximately 11 times larger than those in the EU in 2025 (OECD AI Observatory, cited ING Think, April 2026). The four largest US hyperscalers — Google, Meta, Microsoft, and Amazon — are on track to invest approximately $725 billion in AI infrastructure in 2026 alone (GoHub Ventures, July 2026). To put this in context, the entire Draghi competitiveness programme estimated Europe needed EUR 750–800 billion in additional annual investment across its entire economy to close the gap.
US business investment is projected to rise 40% in real terms between 2021 and the end of 2027, driven by AI infrastructure spending. The euro area: just 12%. German business investment — from what was considered Europe's industrial engine — has nearly stagnated over the same period (Oxford Economics, cited Kalkine, August 2026). Tech spend in North America is projected to grow 9% in 2026 versus 6.3% for Europe (Forrester, February 2026). US AI research investment now exceeds $109 billion per year.
Data point: The Draghi report identifies a central cause of this investment deficit: EU companies spent EUR 270 billion less on R&D than their US counterparts in 2021. The top three R&D investors in Europe have been dominated by automotive companies for the past twenty years. In the US, the top three R&D investors are now all in technology. The European problem is not a lack of researchers or ideas — it is a failure to translate innovation into commercialisation at scale.
Driver 3: Capital Markets — Why US Firms Scale, European Ones Don't
Technology companies require large amounts of patient, risk-tolerant capital to scale from startup to global giant. The United States has this capital infrastructure in abundance; Europe does not. This is one of the most structural and difficult-to-change drivers of the divergence.The US venture capital market dwarfs Europe's. In 2025, US AI startup investments were 11 times larger than EU equivalents. But the gap goes beyond AI: across all technology sectors, US venture capital as a proportion of GDP is significantly larger than Europe's. More importantly, the US has a deep pool of institutional investors — pension funds, endowments, sovereign wealth-adjacent structures — that are willing to take technology risk in pursuit of returns. European institutional capital, by contrast, is more risk-averse and more heavily regulated in its investment mandate.
The CEPR/Draghi analysis of European capital markets identifies a self-reinforcing cycle. Technology companies need venture capital to scale; venture capital funds need large exits (via IPO or acquisition) to generate returns; large exits require deep, liquid public equity markets; and the deepest, most liquid public equity markets are in the US. European technology companies that reach a certain scale frequently relocate to the US — or list there — because that is where capital, talent, and customers are most readily available. This is not a failure of European ambition; it is a structural feature of a fragmented capital market with 27 separate national regulatory frameworks.
The CERRE paper from January 2026 emphasises this: 'The growth of US tech giants is likely to be a result, rather than a cause, of the US's ability to achieve higher productivity growth — which implies that Europe should not simply emulate the US model without addressing underlying causes such as the lack of a single market.' The absence of a genuine single European capital market is one of the Draghi report's central diagnoses.
Driver 4: Energy — Europe's Structural Handicap
The energy shock following Russia's invasion of Ukraine in 2022 exposed a structural vulnerability in European competitiveness that predated the invasion but was dramatically amplified by it. European industrial energy prices — already higher than the US before 2022 — surged to multiples of US levels during the 2022 crisis and, while they have moderated since, have not returned to pre-2022 levels.US businesses benefit from abundant domestic energy supply through natural gas (including shale gas), a large domestic grid, and — increasingly — solar and wind at competitive prices. Industrial electricity prices in the US are broadly 40–60% lower than in Germany, Europe's largest economy. For energy-intensive industries — chemicals, steel, aluminium, paper, ceramics — this is a direct competitiveness disadvantage that cannot be easily managed through efficiency gains.
The Xinhua analysis published five days before this article (September 8, 2026) notes that two years after the Draghi report: 'The latest Middle East conflict has once again exposed Europe's vulnerability to high energy costs.' A new round of energy price volatility in 2026, driven by the geopolitical conflict that began in February, has renewed pressure on European industry. This is not a short-term problem — it reflects decades of underinvestment in domestic energy production and an energy transition that has been uneven across EU member states.
The European Energy Agency's data shows that industrial electricity prices in Germany and France in 2025 were approximately 2–3× those in the US. For a manufacturing company choosing where to site a new facility, this differential — applied to multi-year operational costs — makes Europe systematically less attractive than North America or even parts of Asia.
The counter-argument: The green transition argument runs the other way: Europe's earlier and more comprehensive investment in renewable energy means it is better positioned for a world of cheap solar and wind. By 2030, European renewable electricity is expected to be extremely cheap on a marginal basis. But the transition costs — borne now — are real; the benefits are future.
Driver 5: Demographics and the Labour Supply Advantage
One of the most straightforward explanations for why US total GDP exceeds Europe's is population: the US has more people, and its population is growing faster. With approximately 340 million people, the US is smaller than the EU (approximately 450 million), but the US population is younger, growing more quickly, and more productive on average.MoneyWeek (June 2026) identifies this clearly: 'Others point to America's growing population and the fact that it's getting younger compared with Europe.' The US fertility rate, while below replacement level, is higher than most European countries. More significantly, the US has historically attracted large numbers of highly skilled immigrants, including from Europe. Silicon Valley's technology ecosystem was built substantially on immigrant talent — a disproportionate share of the founders of the largest US technology companies were born outside the US.
Europe faces a more acute demographic challenge. Germany, Italy, Spain, and Portugal have fertility rates well below replacement level. Ageing populations mean higher dependency ratios — more retirees relative to workers — which pressures both government finances and labour supply. Immigration to Europe has been substantial but has generated significant political friction, limiting its contribution to economic growth relative to the US model.
The demographic divergence also affects investment: younger populations require more housing, education, and consumer goods; ageing populations shift resources toward healthcare and pensions. For GDP growth, younger is generally better — and the US is younger than Europe.
Driver 6: The Regulatory Environment and the Single Market Paradox
The European Union is often cited as a regulatory environment that constrains innovation and business formation relative to the United States. This argument has genuine merit in some areas — and is overstated in others.Where it has merit: European digital market regulation has been more restrictive on the activities of large technology platforms (GDPR, Digital Markets Act, Digital Services Act, AI Act). While these regulations have important consumer and democratic benefits, they have also imposed compliance costs and created legal uncertainty that has deterred some technology investment and slowed some product launches in Europe. European competition law has been more aggressive against large technology firms.
The deeper problem, however, is not that Europe over-regulates — it is that it under-integrates. The EU single market is still far from complete. Financial services, capital markets, energy networks, telecommunications, and digital services all face significant remaining national fragmentation. A technology startup in the US operates in a single market of 340 million consumers with one language, one set of securities laws, one currency, and one court system for most commercial purposes. A European startup faces 27 different regulatory regimes, multiple languages, fragmented capital markets, and different consumer protection laws. This is a structural disadvantage that regulation reform at the EU level has so far failed to adequately address.
The CERRE paper (January 2026) frames this precisely: Europe should 'address underlying causes such as the lack of a single market.' The Draghi report listed completion of the Capital Markets Union and Banking Union as among the most urgent structural reforms. As of September 2026, progress on these reforms remains limited.
Driver 7: Defence Spending — A New Fiscal Burden
Since Russia's invasion of Ukraine in 2022, European governments have faced growing pressure to increase defence spending substantially. The European Defence Agency now expects EU member states to spend EUR 454 billion ($528 billion) on defence in 2026 — equivalent to 2.4% of GDP, up EUR 36 billion from 2025 (Xinhua, September 8, 2026).This defence spending surge creates a significant fiscal challenge for economies that are simultaneously trying to invest in digital infrastructure, energy transition, and social protection. The European Central Bank has estimated annual public funding requirements for defence, the green transition, and the digital transition at approximately EUR 510 billion — at a time when fiscal space is limited in many member states. The OECD has noted that the economic effects of higher defence spending are uncertain.
The US, meanwhile, has historically benefited from defence spending as an economic stimulus through its defence-industrial complex: major contractors, research laboratories (DARPA), and technology spillovers. The internet, GPS, semiconductors, and much early artificial intelligence research all emerged from or were substantially funded by the US defence establishment. Europe's defence industrial base is more fragmented — the Draghi report notes that twelve different types of battle tanks are operated in Europe, versus one in the US.
The fiscal pressure from defence spending is not a simple negative — it provides some demand stimulus. But it competes directly with the productive investment in education, research, and infrastructure that drives long-run growth. For Europe in 2026, the two demands are arriving simultaneously and the fiscal resources are limited.
The Counter-Arguments: Is the Gap Partly an Illusion?
The simple narrative — that the US is soaring ahead while Europe stagnates — has attracted serious challenge from distinguished economists. These counter-arguments deserve honest engagement.Paul Krugman — the US Nobel laureate — has argued that the alleged America-Europe productivity growth gap is 'really a California-everyone else productivity gap.' Strip out California's technology sector, and the rest of the US looks much more like Europe. The divergence is driven by a handful of technology companies in a specific geography — not by broad-based American economic superiority.
The CEPR's February 2026 analysis goes further, arguing that 'the differences in growth, and especially productivity growth (GDP per hour of work), are driven almost entirely by differences in measurement, not differences in economic performance.' The key measurement issue: US statistical agencies use more aggressive quality adjustment for technology goods — when a new iPhone is more capable than its predecessor, US statistics count this as a real output increase even if the nominal price is unchanged. European statistical agencies use less aggressive quality adjustment. This difference in methodology can produce substantial differences in measured productivity growth even when the underlying economic reality is similar.
Bruegel's Zsolt Darvas provides a third challenge: measured in PPP terms and adjusted for population, the EU has actually outperformed the US on per-capita GDP growth since 2000. The headline dollar gap is substantially driven by dollar strength and different price levels — not purely by economic performance.
The counter-argument: The counter-arguments are serious and deserve weight. But they do not fully resolve the divergence. The technology sector gap is real regardless of whether it is concentrated in California. The measurement argument, while valid, does not explain why US technology companies dominate global markets while European ones do not — if US productivity data were simply overestimating real output, US companies would still be producing the products that the entire world buys. And the PPP adjustment, while analytically important, does not change the lived experience of European businesses competing for global capital, talent, and market share against US counterparts.
What Europe Has Done Right
In the interests of balance, the economic comparison is not uniformly negative for Europe. Several European economies have strengths that the aggregate numbers understate.- Living standards and welfare: ING Think observes that 'productivity and welfare are related but are not the same thing. While American workers have become much more productive over recent decades, this has not translated into proportionately greater spending power than that enjoyed by European workers.' Europeans work fewer hours, take more holidays, have lower income inequality (by most measures), more comprehensive healthcare, and better state-funded education and parental leave.
- Industrial strengths: European companies dominate in luxury goods (LVMH, Hermès, Kering), pharmaceuticals (Novo Nordisk, AstraZeneca, Roche), industrial automation (Siemens, ABB, Schneider Electric), and aerospace (Airbus). These are world-class companies with genuine global market leadership.
- Green economy: Europe is ahead of the US in renewable energy deployment, carbon pricing, and green regulation. Whether this is an economic asset or cost depends on timing — in the short term it has added costs; in the long term it may prove a significant advantage.
- Regional tech hubs: GoHub Ventures (July 2026) notes that European AI investment, while much smaller than the US, is concentrated in deep tech and specialised verticals — biotech, quantum computing, robotics, energy technology — where European strengths in engineering and regulatory compliance create defensible competitive positions. London, Paris, Berlin, and Stockholm host genuinely world-class technology ecosystems.
- Resilience: Barclays Investment Bank (Q1 2026 Global Outlook) observes that 'despite a war on its doorstep, an energy crisis and trade tensions, Europe has managed to grow close to trend.' The Eurozone's relative resilience in the face of these shocks suggests institutional and economic strength that is not always captured in the headline productivity comparison.
The Draghi Report: Europe's Own Diagnosis — and Its Implementation Problem
In September 2024, former European Central Bank President Mario Draghi published his landmark report on European competitiveness. It was Europe's most comprehensive and honest self-assessment of the productivity and technology gap — and it made uncomfortable reading. The report estimated that Europe needed EUR 750–800 billion in additional annual investment (equivalent to approximately $872–$930 billion) to close the competitiveness gap with the US. It identified 383 specific policy recommendations across technology, energy, capital markets, defence, and regulation.Two years on, the Xinhua analysis published on 8 September 2026 — five days before this article — provides a sobering status report: only 15.7% of the 383 recommendations have been fully implemented, and only 41.3% have been fully or partially implemented. Implementation pace slowed sharply in the first half of 2026: the index rose by just 0.6 percentage points (for fully implemented) and 2.4 points (for fully or partially implemented) in the six months following January 2026, versus 3.9 and 7.5 points respectively in the preceding period.
The Xinhua analysis identifies three new headwinds since the Draghi report: energy costs (the Middle East conflict reignited vulnerability), strategic financing (defence spending competing with productive investment), and industrial scale-up (the gap between recognising problems and actually building new industrial capacity). The CERRE paper from January 2026 adds a fourth: the question of whether European regulation needs to be fundamentally rethought for a world of growing geopolitical competition and protectionism.
The Draghi report is not just a list of policy recommendations — it is a recognition by Europe's own economic establishment that the divergence with the US is real, serious, and structural. The implementation gap two years on is itself revealing: the political will to execute the necessary reforms — completing the single market, creating a genuine Capital Markets Union, rationalising defence procurement, reforming energy markets — has not matched the scale of the diagnosis. This is not primarily an economic failure; it is a political one.
Conclusion
The US economy's divergence from Europe over the past two decades is real, multidimensional, and has accelerated in the 2020s. By nearly every headline measure — total GDP, productivity growth, technology dominance, capital market depth, and AI investment — the US has outperformed. The gap between the four largest US technology companies' 2026 AI infrastructure investment ($725 billion) and the entire additional annual investment that the Draghi report says Europe needs ($872–$930 billion) captures the scale of the challenge in a single comparison.The counter-arguments matter and deserve respect. The gap is smaller in PPP terms and per-capita terms than the headline dollar figures suggest. Much of the productivity divergence is concentrated in a single sector (technology) in a single state (California). Some of the measurement differences are statistical rather than economic. European workers trade some GDP for leisure, equality, and social protection — arguably a rational preference.
But none of this changes the structural reality that Europe's technology sector is small, its capital markets are fragmented, its energy costs are high, its defence spending is rising fast, and implementation of the Draghi agenda has been painfully slow. These are solvable problems — but they require political will that has so far been insufficient. The window for catching up is not closed: the renewable energy transition, the next wave of AI applications, and the expansion of deep-tech sectors all offer genuine opportunities for European leadership. What they require is the investment, the regulatory reform, and the single-market depth that would allow European companies to scale the way their US counterparts have.
The US lead is real. But the story of the next twenty years has not been written. Europe's relative performance will be determined not by the factors that drove the past two decades — where the US has already won — but by what happens next in AI applications, green technology, and geopolitical repositioning. On those fronts, the contest is still open.
Frequently Asked Questions
How much bigger is the US economy than Europe's?By 2024, US GDP had reached approximately $29.2 trillion, while Eurozone GDP stood at $16.4 trillion and the UK at $4 trillion (MoneyWeek, June 2026). In current US dollar terms, the US economy is now almost double the Eurozone's — a dramatic reversal from 2008, when the EU economy was fractionally larger. However, measured in purchasing power parity (PPP) terms, which adjusts for different price levels across countries, the gap is meaningfully smaller. Some Northern European countries approach or match US GDP per capita levels at PPP. The most significant divergence is in productivity growth — particularly in the technology sector — rather than in overall living standards, which in many European countries remain broadly comparable to the US when factors like working hours, equality, and access to public services are considered.
Why is the US so much better at producing technology companies than Europe?
Several structural factors: the US has a single national market of 340 million consumers with one language, one regulatory framework, and one capital market — making it far easier to scale a technology company than in Europe's 27-country, multi-language, multi-regulatory environment. US venture capital markets are significantly larger and more willing to fund loss-making growth companies at large scale. US universities (particularly in California, Massachusetts, and New York) have stronger links to industry and produce more commercialisable research. And the US defence and government research ecosystem (DARPA, NASA, NIH) has historically funded basic research that generated commercial technology — the internet, GPS, and early AI research all have roots in this. The Draghi report identifies the lack of a single European capital market as one of the most important structural disadvantages Europe must address.
What is the Draghi report and what has it achieved?
Mario Draghi — former President of the European Central Bank and former Italian Prime Minister — published a landmark report on European competitiveness in September 2024. It was Europe's most comprehensive self-assessment of the productivity and technology gap with the US. The report identified 383 specific policy recommendations and estimated that Europe needed EUR 750–800 billion in additional annual investment to close the competitiveness gap. Two years on (as of September 2026), only 15.7% of recommendations have been fully implemented and 41.3% fully or partially implemented, with implementation pace slowing in the first half of 2026 (Xinhua, September 8, 2026). The report's diagnosis is widely accepted — its prescriptions have been much harder to implement due to the political complexity of coordinating 27 member states.
Is the US-Europe economic gap partly a statistical illusion?
Yes — partly. Paul Krugman has argued the gap is 'really a California-everyone else productivity gap,' driven by a handful of technology companies in one US state rather than broad-based American superiority. The CEPR's February 2026 analysis argues that differences in productivity growth measurement — particularly how US statistical agencies handle quality improvements in technology goods — could account for a significant portion of the apparent divergence. Bruegel's Zsolt Darvas shows that in PPP per-capita terms, the EU has actually outperformed the US on GDP growth since 2000. However, these counter-arguments do not fully resolve the divergence: US technology companies dominate global markets regardless of how their output is measured, and the investment gap (US firms investing 40% more in real terms than European counterparts over 2021–2027) is a real difference in economic activity, not a statistical artefact.
Will Europe catch up with the US economically?
The medium-term forecasts do not predict catching up — they predict continued moderate divergence in technology-driven productivity. However, there are reasons for cautious optimism on specific fronts: Europe's renewable energy transition could become a significant competitive advantage if the green economy develops as expected; European deep-tech sectors (biotech, quantum computing, semiconductors, robotics) are globally competitive and growing; and the completion of the EU Capital Markets Union and single digital market — if achieved — would be transformative for European technology companies. The Draghi agenda, if implemented, could meaningfully narrow the gap by 2030. The risk is that implementation remains slow while the US continues to accelerate in AI and frontier technology investment.
How does the US-Europe gap affect UK investors?
For UK investors (who are outside the EU but trade extensively with both the US and Europe), the divergence has several implications: US equity markets — particularly technology-heavy indices like the S&P 500 and Nasdaq — have significantly outperformed European indices over the past decade. UK investors with diversified global portfolios will have benefited from US equity exposure. The UK economy faces some of the same structural challenges as Europe (productivity stagnation, energy costs, limited technology giants) while also managing the trade friction of Brexit. Sterling's performance relative to the dollar reflects some of these structural differences. For long-term investors, the question is not just whether to be invested in the US today, but whether the next twenty years of technology-driven growth will replicate the pattern of the last twenty — or whether Europe's green-tech and deep-tech strengths, combined with improving regulatory integration, could generate a period of catch-up.

0 Comments Comments