

Business
How to Read Your P&L Like a Pro — Small Business
Your Profit and Loss statement is the single most important financial report your business produces. Yet most small business owners glance at the bottom line and move on. This guide shows you exactly how to read every line, what the numbers really mean, and which seven figures you should track every single month.
For a small business owner, the P&L is the most important financial document you will regularly review. It tells you whether your pricing is right, whether your costs are under control, whether revenue is growing or shrinking, and ultimately whether the business is viable. Every lender, investor, and accountant you will ever work with will want to see your P&L before making any decision about your business.
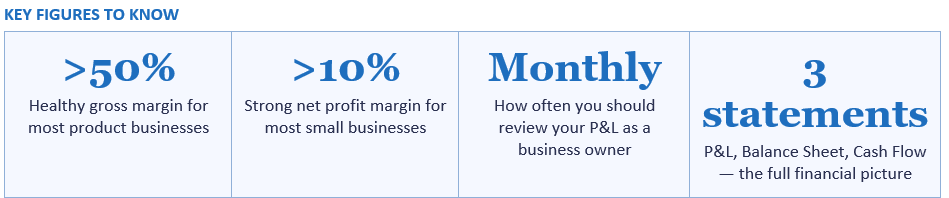
The P&L is one of three core financial statements. The other two are the Balance Sheet (which shows what the business owns and owes at a point in time) and the Cash Flow Statement (which shows how money moves in and out of the business). All three together give a complete picture of financial health, but the P&L is the one most business owners look at most frequently — typically monthly.
The P&L is prepared on an accrual basis in most accounting systems, meaning revenue is recorded when it is earned and expenses are recorded when they are incurred — not necessarily when cash changes hands. This is an important distinction that we will return to when discussing the difference between profit and cash flow.
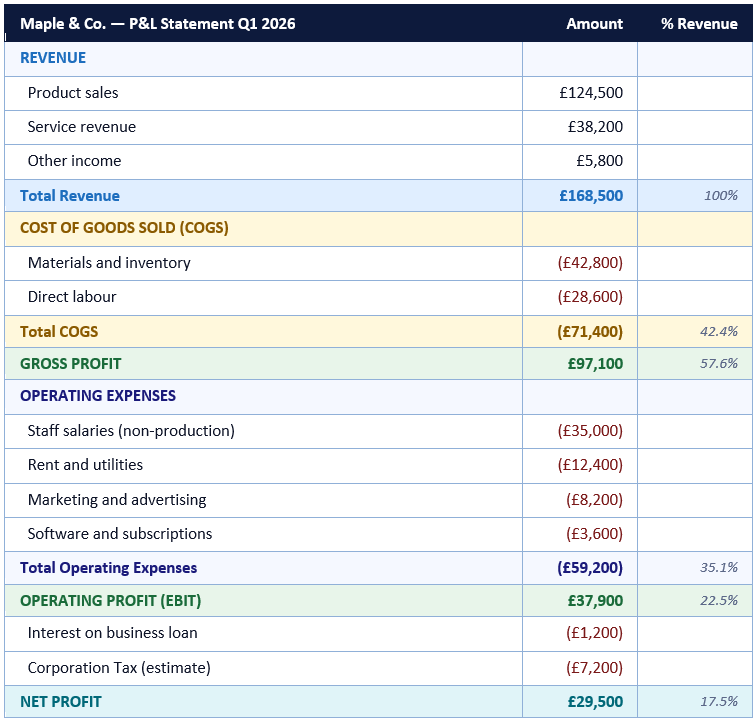
In the Maple & Co. example above, the gross profit margin is 57.6% — for every £100 of revenue, the business has £57.60 left after paying COGS. That gives it plenty of room to cover £35.10 of overheads (operating expenses as a percentage of revenue) and still generate a healthy net profit margin of 17.5%.
Benchmark gross margins vary significantly by industry. Retail businesses typically achieve gross margins of 30% to 50%. SaaS and software businesses often achieve 70% to 85%. Service businesses vary widely — consulting firms can achieve 60% to 80%, while labour-intensive services like cleaning or catering may achieve only 20% to 35%. Knowing what is typical for your sector allows you to assess whether your own margin is competitive.
If your gross margin is falling over time, it almost always means one of two things: either your direct costs are rising and you are not passing that increase on in higher prices, or your pricing has come under competitive pressure. Both are problems that require action. A business with a declining gross margin is heading for trouble, because there will eventually not be enough money to cover overheads, regardless of how much revenue grows.
Revenue is vanity, profit is sanity, and cash flow is reality. The P&L tells you the first two. Understanding all three keeps your business alive.
— COMMON SMALL BUSINESS FINANCE MAXIM
The key question to ask about each operating expense line is: is this cost growing in proportion to revenue, faster than revenue, or slower than revenue? Costs that grow slower than revenue (or stay flat while revenue grows) indicate improving operational efficiency. Costs that grow faster than revenue indicate a problem — you are spending more to generate each pound of sales, which compresses profit margins.
Operating expenses can be divided into fixed costs (which stay the same regardless of revenue — rent, insurance, most salaries) and variable costs (which grow with the business — marketing spend tied to sales volume, software costs that scale with users). Understanding which of your operating costs are fixed and which are variable is important for financial planning: if revenue drops, you can reduce variable costs quickly, but fixed costs continue regardless.
What constitutes a 'good' net profit margin depends heavily on industry and business model. For service businesses, a net margin of 10% to 20% is generally considered healthy. For retail businesses, 5% to 10% is more typical. For SaaS and software businesses at scale, 20% to 30% is achievable. Very high net margins (above 30% for most industries) are exceptional and often temporary unless the business has a genuine competitive advantage.
A negative net margin — a net loss — is not automatically alarming for a young business investing heavily in growth. Many successful companies lose money for years before reaching profitability. But for an established small business that should be generating returns, a persistent net loss is a clear signal that something needs to change: either revenue needs to grow, costs need to fall, or prices need to rise. The P&L will tell you which levers to pull.
Track net margin as a trend over time, not just as a single point. A net margin that is consistently improving, even if it starts low, tells a different and more encouraging story than one that is declining from a historically high level.
On an accrual basis, revenue is recognised when it is earned (typically when an invoice is raised), not when cash is actually received. If you invoice a customer for £10,000 in March and they pay in May, that £10,000 appears on your March P&L — but you will not have the cash until May. Similarly, if you buy £5,000 of inventory in March to sell in April, you may have paid out cash in March that does not appear as a COGS expense until April when the inventory is sold.
The result is that a business with growing revenue and accelerating invoicing — particularly one with 30, 60, or 90-day payment terms — can show a strong and growing profit on its P&L while simultaneously running a negative cash position. This is the most common cause of small business insolvency: not declining profitability, but profitable growth that outpaces available working capital.
This is why the Cash Flow Statement is the essential companion to the P&L. Reviewing both together — profit tells you whether you are making money, cash flow tells you whether you have money — is the complete financial picture that every small business owner needs. If your P&L is consistently profitable but your bank balance is perpetually strained, the issue is almost certainly working capital management: chasing debtors faster, extending supplier payment terms, or arranging an overdraft facility to bridge the gap.
The business owners who grow profitable, resilient companies are not necessarily the most innovative or the hardest working. They are the ones who understand their numbers, notice problems early, and make data-driven decisions rather than gut-feel ones. Your P&L is the foundation of that understanding. Review it monthly, compare it to previous periods and your budget, and use what it tells you to make your business better each month.
TABLE OF CONTENTS
- What Is a Profit and Loss Statement?
- The Structure of a P&L: A Line-by-Line Walkthrough
- A Sample P&L for a Small Business
- The 7 Numbers Every Small Business Owner Must Track
- Gross Profit Margin: Your First Health Check
- Operating Expenses: Where the Details Live
- Net Profit Margin: The Bottom Line
- Common P&L Mistakes Small Business Owners Make
- How to Use Your P&L to Make Better Decisions
- P&L vs Cash Flow: Why You Can Be Profitable and Broke
- Conclusion
- Frequently Asked Questions
- References
What Is a Profit and Loss Statement?
A Profit and Loss statement — also called an income statement, a P&L, or a statement of operations — is a financial report that summarises a business's revenues, costs, and expenses over a specific period of time. It shows whether the business made a profit or a loss during that period and by how much.For a small business owner, the P&L is the most important financial document you will regularly review. It tells you whether your pricing is right, whether your costs are under control, whether revenue is growing or shrinking, and ultimately whether the business is viable. Every lender, investor, and accountant you will ever work with will want to see your P&L before making any decision about your business.
The P&L is one of three core financial statements. The other two are the Balance Sheet (which shows what the business owns and owes at a point in time) and the Cash Flow Statement (which shows how money moves in and out of the business). All three together give a complete picture of financial health, but the P&L is the one most business owners look at most frequently — typically monthly.
The P&L is prepared on an accrual basis in most accounting systems, meaning revenue is recorded when it is earned and expenses are recorded when they are incurred — not necessarily when cash changes hands. This is an important distinction that we will return to when discussing the difference between profit and cash flow.
The Structure of a P&L: A Line-by-Line Walkthrough
Every P&L follows the same basic structure, working from the top line (revenue) down to the bottom line (net profit or loss). Understanding each section is the first step to reading any P&L with confidence.Revenue (also called Turnover or Sales)
This is the total income your business generated from selling goods or services during the period. It is the 'top line' of the P&L and is the starting point for everything else. Revenue is recorded before any costs are deducted. Some P&L statements break revenue down by product line, geographic market, or revenue stream; others show a single figure. A growing top line is generally positive, but revenue growth means nothing if the associated costs grow faster.Cost of Goods Sold (COGS) or Cost of Sales
These are the direct costs of producing the goods or services you sold — the materials, direct labour, and other costs that are directly attributable to your sales. COGS rises and falls with revenue: if you sell more, COGS goes up. If a product-based business sells 100 units, COGS represents the cost of making or buying those 100 units. For a service business, COGS might include the wages of the staff who directly deliver the service.Gross Profit
Gross Profit = Revenue minus COGS. This is the money left after paying for the direct cost of what you sold. The Gross Profit Margin (Gross Profit divided by Revenue, expressed as a percentage) is one of the most important ratios in business. A high gross margin means you have plenty of room to cover your overheads and still make a profit. A low gross margin means your pricing may be too low or your direct costs too high.Operating Expenses (Overheads or OpEx)
These are the indirect costs of running the business that do not vary directly with sales: rent, salaries (of non-production staff), marketing, utilities, software subscriptions, professional fees, insurance, and depreciation. Unlike COGS, operating expenses do not disappear if you stop selling — they are ongoing costs of keeping the business running.Operating Profit (EBIT)
Operating Profit = Gross Profit minus Operating Expenses. Also called Earnings Before Interest and Tax (EBIT), this figure shows how much the business makes from its core operations before financing costs and tax.Interest and Other Non-Operating Items
Interest paid on loans and overdrafts, and any income from investments or other non-trading activities, are listed separately below operating profit. This separation allows you to see how well the business performs from its own operations, independent of how it is financed.Net Profit (or Net Loss)
Net Profit = Operating Profit minus Interest minus Tax. This is the 'bottom line' — the money the business has made after all costs. It is the figure most often quoted when people ask 'how much did the business make?' A negative net profit is a net loss.A Sample P&L for a Small Business
The following is a sample Profit and Loss statement for a fictional small retail and service business, Maple & Co., for the first quarter of 2026. Use this as a reference as you read the rest of this guide.The 7 Numbers Every Small Business Owner Must Track
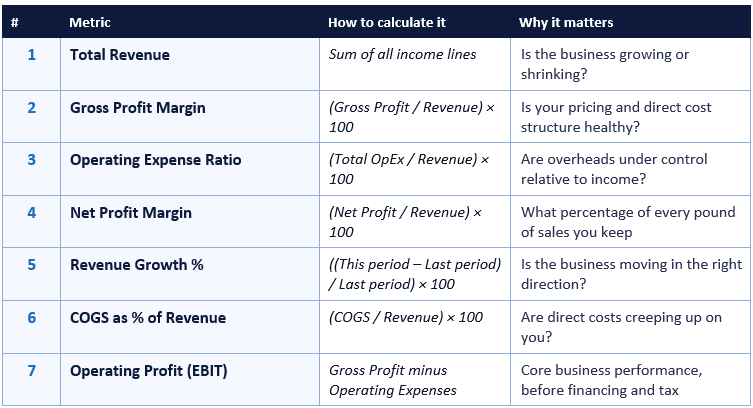
When you look at a P&L, there is a risk of getting lost in the detail. These seven numbers cut through the complexity and give you a reliable monthly health check on your business.Gross Profit Margin: Your First Health Check
Gross Profit Margin is the single most telling number in your P&L because it tells you whether the fundamental economics of your business work. It answers the question: after paying the direct cost of what you sold, how much do you have left to cover your overheads and still make a profit?In the Maple & Co. example above, the gross profit margin is 57.6% — for every £100 of revenue, the business has £57.60 left after paying COGS. That gives it plenty of room to cover £35.10 of overheads (operating expenses as a percentage of revenue) and still generate a healthy net profit margin of 17.5%.
Benchmark gross margins vary significantly by industry. Retail businesses typically achieve gross margins of 30% to 50%. SaaS and software businesses often achieve 70% to 85%. Service businesses vary widely — consulting firms can achieve 60% to 80%, while labour-intensive services like cleaning or catering may achieve only 20% to 35%. Knowing what is typical for your sector allows you to assess whether your own margin is competitive.
If your gross margin is falling over time, it almost always means one of two things: either your direct costs are rising and you are not passing that increase on in higher prices, or your pricing has come under competitive pressure. Both are problems that require action. A business with a declining gross margin is heading for trouble, because there will eventually not be enough money to cover overheads, regardless of how much revenue grows.
Revenue is vanity, profit is sanity, and cash flow is reality. The P&L tells you the first two. Understanding all three keeps your business alive.
— COMMON SMALL BUSINESS FINANCE MAXIM
Operating Expenses: Where the Details Live
Operating expenses are where small business owners often find the most actionable information in their P&L. Revenue is largely determined by the market; COGS is constrained by what you need to spend to deliver your product or service. But operating expenses — the overheads of running your business — are largely within your control, and reviewing them line by line each month is one of the highest-value habits a business owner can develop.The key question to ask about each operating expense line is: is this cost growing in proportion to revenue, faster than revenue, or slower than revenue? Costs that grow slower than revenue (or stay flat while revenue grows) indicate improving operational efficiency. Costs that grow faster than revenue indicate a problem — you are spending more to generate each pound of sales, which compresses profit margins.
Operating expenses can be divided into fixed costs (which stay the same regardless of revenue — rent, insurance, most salaries) and variable costs (which grow with the business — marketing spend tied to sales volume, software costs that scale with users). Understanding which of your operating costs are fixed and which are variable is important for financial planning: if revenue drops, you can reduce variable costs quickly, but fixed costs continue regardless.
Watch the operating expense ratio
The operating expense ratio (OpEx as a percentage of revenue) is a key indicator of whether your overhead structure is appropriately sized for your business. As a rough benchmark, a small business with a gross margin of around 50% needs an OpEx ratio below 40% to generate a meaningful net profit. If your OpEx ratio is creeping upward over successive months, investigate which cost lines are driving the increase before they erode your net margin.Net Profit Margin: The Bottom Line
Net profit margin is what everyone focuses on, and it is important — but it should always be read in the context of the gross margin and operating expense ratio that produced it. A 10% net margin with a 50% gross margin and well-controlled overheads is fundamentally different from a 10% net margin with a 90% gross margin and extremely high operating costs.What constitutes a 'good' net profit margin depends heavily on industry and business model. For service businesses, a net margin of 10% to 20% is generally considered healthy. For retail businesses, 5% to 10% is more typical. For SaaS and software businesses at scale, 20% to 30% is achievable. Very high net margins (above 30% for most industries) are exceptional and often temporary unless the business has a genuine competitive advantage.
A negative net margin — a net loss — is not automatically alarming for a young business investing heavily in growth. Many successful companies lose money for years before reaching profitability. But for an established small business that should be generating returns, a persistent net loss is a clear signal that something needs to change: either revenue needs to grow, costs need to fall, or prices need to rise. The P&L will tell you which levers to pull.
Track net margin as a trend over time, not just as a single point. A net margin that is consistently improving, even if it starts low, tells a different and more encouraging story than one that is declining from a historically high level.
Common P&L Mistakes Small Business Owners Make
Even experienced small business owners frequently make the same set of mistakes when reading their P&L. Avoiding these will immediately improve the quality of your financial decision-making.P&L reading mistakes to avoid
- Only looking at the bottom line: Net profit tells you whether you made money, but not why. Always trace a disappointing net profit back through gross margin and operating expenses to understand the cause.
- Confusing revenue with profit: Many business owners celebrate revenue milestones without checking whether the underlying margin makes that revenue worthwhile. A high-revenue, low-margin business can be harder to run than a lower-revenue, higher-margin one.
- Not reviewing the P&L monthly: A quarterly or annual review is too infrequent to catch problems early. Monthly P&L reviews are essential for staying in control of your business.
- Mixing personal and business expenses: Personal expenses running through the business distort the P&L and make it impossible to read accurately. Keep personal and business finances completely separate.
- Not comparing to previous periods or budget: A P&L in isolation tells you what happened. Comparing to the same period last year (year-on-year) and to your budget (actual vs planned) tells you whether what happened was good or bad.
- Ignoring the P&L because 'the accountant handles it': The P&L is your most important management tool. You do not need to prepare it yourself, but you absolutely need to understand and act on what it tells you.
How to Use Your P&L to Make Better Decisions
The P&L is not just a historical record — it is a decision-making tool. Here are the most important ways small business owners can use their monthly P&L to make better operational and strategic decisions.Pricing decisions
If your gross margin is too thin, the first thing to investigate is whether your pricing reflects your real costs. Many small business owners undercharge because they underestimate the true cost of their goods or services, or because they fear losing customers to competitors. But a business that prices too low is subsidising its customers with its own labour — and eventually runs out of energy or money to sustain it. Your gross margin is the clearest indicator of whether your pricing is right.Cost control
Reviewing operating expenses line by line each month forces you to ask whether each cost is necessary, whether it is delivering value, and whether you could get the same result for less. Subscriptions you no longer use, insurance policies that have not been reviewed in years, and supplier contracts that could be renegotiated are often visible only when someone sits down with the P&L and asks uncomfortable questions.Growth decisions
Before hiring a new member of staff or opening a second location, model the impact on your P&L. What will the additional salary cost do to your net margin if revenue does not immediately increase? How many additional sales would you need to make to maintain your current net margin after the new overhead is added? A business that grows its costs faster than its revenue will eventually destroy the margins that made it profitable in the first place.Forecasting and budgeting
Using historic P&L data to build a forward-looking financial model is one of the highest-value activities a small business owner can undertake. A simple 12-month forecast that projects revenue growth, tracks COGS as a percentage of revenue, and budgets operating expenses allows you to see potential cash flow problems and margin compression before they arrive — and to make adjustments in time to address them.P&L vs Cash Flow: Why You Can Be Profitable and Broke
One of the most important — and most misunderstood — concepts in small business finance is the difference between profit and cash flow. It is entirely possible to have a healthy net profit on your P&L while simultaneously running out of money in your bank account. This is not a paradox; it is a consequence of the accrual accounting basis on which most P&L statements are prepared.On an accrual basis, revenue is recognised when it is earned (typically when an invoice is raised), not when cash is actually received. If you invoice a customer for £10,000 in March and they pay in May, that £10,000 appears on your March P&L — but you will not have the cash until May. Similarly, if you buy £5,000 of inventory in March to sell in April, you may have paid out cash in March that does not appear as a COGS expense until April when the inventory is sold.
The result is that a business with growing revenue and accelerating invoicing — particularly one with 30, 60, or 90-day payment terms — can show a strong and growing profit on its P&L while simultaneously running a negative cash position. This is the most common cause of small business insolvency: not declining profitability, but profitable growth that outpaces available working capital.
This is why the Cash Flow Statement is the essential companion to the P&L. Reviewing both together — profit tells you whether you are making money, cash flow tells you whether you have money — is the complete financial picture that every small business owner needs. If your P&L is consistently profitable but your bank balance is perpetually strained, the issue is almost certainly working capital management: chasing debtors faster, extending supplier payment terms, or arranging an overdraft facility to bridge the gap.
CONCLUSION
Reading your P&L like a pro does not require an accounting qualification. It requires understanding the structure of the report, knowing which seven numbers matter most, and developing the discipline to review it monthly and ask the right questions about what the numbers are telling you.The business owners who grow profitable, resilient companies are not necessarily the most innovative or the hardest working. They are the ones who understand their numbers, notice problems early, and make data-driven decisions rather than gut-feel ones. Your P&L is the foundation of that understanding. Review it monthly, compare it to previous periods and your budget, and use what it tells you to make your business better each month.

0 Comments Comments