

Investing
What Happens to Investments After 1 Week, Month & Year

Key Statistics: S&P 500 opened 2026 down ~4% in Q1 after 18% total return in 2025. MSCI World returned 15.8% over 12 months (March 2024 to February 2025) despite 15 peaks and troughs. Global equity index had positive annual returns in 28 of the last 38 years (1988-2025) per Standard Chartered. S&P 500 climbed ~44% from 2022 to 2026 despite -18% fall in 2022 alone. VIX bounced between high teens and low 20s in 2026; reached 35 in past 12 months. History: markets recover 80% of the time in the two years following a year of negative returns for stocks and bonds. Missing the 10 best days in any decade can eliminate ~80% of returns (JPMorgan). MSCI World: 15 peaks and troughs in a single 12-month period; still ended +15.8%. Colombia Threadneedle: simply sitting tight is usually the right approach.
This is normal. And it is one of the most important things to understand about investing. What you see in your first week, first month, and first year of investing tells you very different things about the investment — and the thing it tells you least is whether your strategy is working. As Fidelity UK's June 2026 guide put it: what happens in your first week, month or even year of investing doesn’t tell you much on its own. Short-term movements are often just noise.
This article explains precisely what to expect — and what to make of it — at each of those three time horizons, drawing on current market data, historical evidence from the MSCI World index, the S&P 500, and the Columbia Threadneedle and Standard Chartered research published in 2025 and 2026.
In practical investment terms, this means that a 2 percent decline in your portfolio is experienced approximately as strongly as a 4 percent gain. A week in which your investment falls by £50 on a £1,000 investment feels meaningfully worse than a week in which it rises by £50 feels good. Over time, this asymmetric emotional response can push investors toward exactly the wrong behaviour: selling after falls (to stop the emotional pain) and buying after gains (when the emotional reward is most available), which is the inverse of the patient long-term strategy that the evidence consistently shows produces the best outcomes.
Columbia Threadneedle's adviser research summarises the data from cognitive science: there is strong evidence that humans experience a stronger emotional response to a financial loss than to an equivalent financial gain. Simply sitting tight and riding out short-term volatility is usually the right thing to do.
One week in the stock market corresponds to five trading days. In a market that typically moves between plus and minus 2 percent per day, the range of possible one-week outcomes for a broadly diversified equity fund is roughly minus 10 to plus 10 percent, with the most common outcome being somewhere between minus 2 and plus 2 percent. The vast majority of this movement is driven by news events, market sentiment, macro data releases, and the behaviour of other investors — none of which tells you anything specific about the quality of your investment.
After one week, the single most useful thing to do is nothing. If you have invested in a broadly diversified fund aligned with your risk tolerance and time horizon, one week's performance is not actionable information. It is the market equivalent of measuring the height of a friend every hour: you are capturing real measurements, but they tell you nothing about the direction of travel over the timescale that actually matters.
Fidelity UK, June 2026: Short-term drops are a normal part of investing. But they only become real losses if you sell. What happens in your first week, month or even year of investing doesn’t tell you much on its own. Short-term movements are often just noise.
This is still predominantly noise. The S&P 500 opened 2026 down approximately 4 percent in the first quarter after an 18 percent total return in 2025. An investor who started investing in January 2026 and checked after one month would have seen a loss. An investor who started in November 2025 and checked after one month would likely have seen a gain. Neither starting month told them anything useful about the five-year or ten-year outcome of their strategy.
One month's returns do contain slightly more information than one week's, in the sense that a pattern of consistent monthly losses may eventually indicate a bear market, and consistent monthly gains may indicate a bull market. But a single month is still far too short to distinguish a temporary correction from the beginning of a sustained downturn, or a temporary rally from a sustained recovery. The most common error investors make at the one-month mark is extrapolating: assuming that whatever direction the last month moved in is the direction the investment will continue to move. Markets do not work that way.
The practical action at one month: check that your investment is still what you thought it was — the right fund, the right platform, the right charges. Do not check it to make a decision about whether to hold or sell.
But as Fidelity UK emphasises in its June 2026 guide, one year is still a short period when it comes to investing. Even if the value of your investments is lower than when you started, it doesn’t necessarily mean your strategy isn’t working. Markets move in cycles, and it’s common to go through periods where values fall before recovering.
The AARP's April 2026 analysis illustrates this concretely: the S&P 500 fell 18 percent between the beginning of 2022 and early 2023 — a full year of painful losses. An investor who sold after that year of losses would have crystallised a real loss. The index then climbed approximately 44 percent from early 2022 to early 2026. The investor who stayed invested recovered, and then significantly exceeded, where they were before the losses.
After one year, the most useful questions are forward-looking, not backward-looking. Has your financial situation changed? Has your time horizon shortened? Has your risk tolerance been tested and found to be different from what you assumed? If the answer to any of those is yes, a review with a financial adviser is worthwhile. If the answer to all of them is no, the evidence strongly suggests the right course is to stay invested.
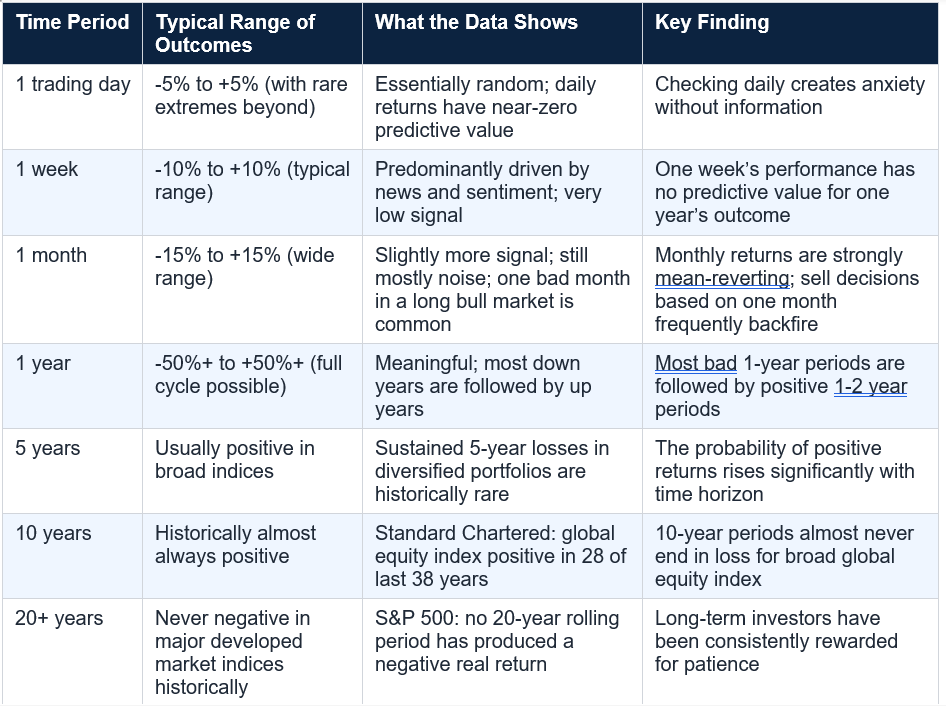
The Standard Chartered and Columbia Threadneedle data makes the picture starkly clear: over 38 years from 1988 to 2025, global equity markets had positive annual returns in 28 of those years. That is 74 percent of calendar years. The losses were real in the other 26 percent of years, but they were followed by recoveries in the overwhelming majority of cases. The longer the time horizon, the more consistent the positive outcome pattern becomes.
An investor who sold in Q1 2026 when the S&P 500 was down 4 percent missed the subsequent partial recovery. An investor who sold during the UK mini-budget crisis of October 2022, when markets were at multi-year lows, crystallised those losses and missed the recovery. An investor who sold in March 2020 during COVID-19 market falls missed one of the fastest and most powerful market recoveries in stock market history — the S&P 500 recovered its March 2020 losses within five months and ended 2020 up 16 percent.
The Center for Financial Planning’s Q1 2026 commentary documented stock returns 3 and 12 months after key geopolitical conflicts over time. The consistent finding: markets tend to recover within 3 to 12 months of major conflict-related falls, and investors who stayed invested captured that recovery while those who sold did not.
Fidelity UK, June 2026: Real progress tends to happen over longer periods, as markets move through cycles and your investments have time to grow. That’s why time in the market matters more than timing the market. The most effective investors aren’t the ones who react to every movement, but the ones who stay consistent, keep investing, and give their money time to grow.
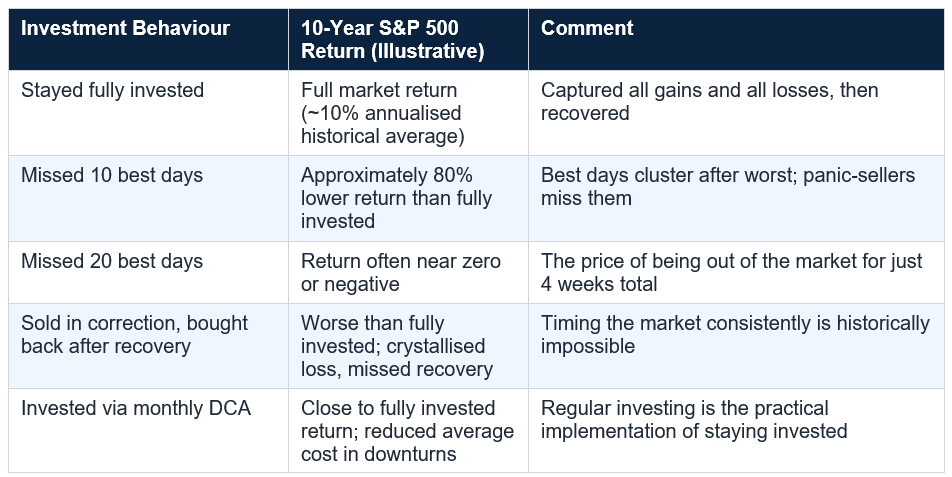
Dollar-cost averaging (DCA) — investing a fixed amount at regular intervals regardless of market conditions — means that when markets are lower, your fixed monthly contribution buys more units of the fund than it does when markets are higher. A month in which your existing investment falls 5 percent is also a month in which your new contribution purchases units at 5 percent below last month's price. Over time, this reduces your average cost per unit across the accumulation period.
This is why the mathematical reality for a regular investor is different from the emotional reality. Emotionally, a falling portfolio feels bad. Mathematically, for an investor still in the accumulation phase with years of contributions ahead, a sustained period of lower prices reduces the average cost of the total position — which improves the eventual return when prices recover.
The investor who should pay most attention to short-term falls is the one close to the point of drawing down on their investments — this is what retirement planning specialists call sequence-of-returns risk, as documented by HF Financial in April 2026. For someone still accumulating over a ten or twenty year horizon, short-term falls are a largely irrelevant feature of the journey.
Missing just the ten best trading days of any decade eliminates approximately 80 percent of the total return for that decade. The ten best days account for the majority of long-term market gains. And those ten best days are almost always clustered immediately after the worst days. The investors most likely to miss the ten best days are precisely those who sold during the worst days — the days when panic was highest and the emotional pressure to exit the market was most intense.
In a market where a week's performance is largely unpredictable, where a month's performance is predominantly noise, and where even a year's performance can deceive, the evidence for staying invested and allowing compounding to work over the medium and long term is the most robust finding in the entire field of investment research. It is not a guarantee. It is a probability, and it is a very strong one.
The historical evidence is consistent and clear across every major developed market over the past century. Investors who stay invested through the noise of the first week, the volatility of the first month, and the full market cycle of the first year and beyond are, on average, the ones whose money grows. Markets recovered from every war, every financial crisis, every recession, and every period of political uncertainty in the modern era. They are down approximately 4 percent in Q1 2026 and were up 18 percent in 2025. Both facts are true simultaneously.
As Fidelity UK's June 2026 guide concludes: it is not the first few weeks or months that shape your outcome. It is the years you stay invested. The best thing you can do in week one, month one, and year one is to understand this, feel it in the real experience of your fluctuating portfolio, and choose not to react to the noise.
Yes. Weekly investment performance is essentially random, and short-term falls are a completely normal part of investing. Even in strong bull markets, individual weeks are frequently negative. The S&P 500, which returned 18% in 2025 and 44% from 2022 to 2026, had many negative individual weeks throughout that period. A fall in week one does not tell you anything meaningful about your investment's long-term trajectory.
Should I check my investment every day?
Most financial advisers and investment research suggests that frequent checking of investment performance — particularly daily monitoring — is counterproductive. It creates emotional responses (primarily loss aversion) that can lead to poor decisions without providing useful information, since daily performance is essentially noise. For long-term investors, quarterly or semi-annual reviews are typically sufficient.
What if my investment is down after 1 month?
A fall in the first month is common and does not indicate that your strategy is wrong. The S&P 500 fell approximately 4% in Q1 2026, the first quarter of the year, after an 18% gain in 2025. An investor who started in January 2026 saw a loss after one month; that is completely normal market behaviour. Unless your financial situation or goals have fundamentally changed, staying invested is almost always the appropriate response to a one-month loss in a diversified fund.
What if my investment is still down after 1 year?
A year of negative returns is relatively uncommon but does occur: global equity markets have had positive annual returns in approximately 74% of calendar years since 1988. A down year does not mean your strategy is failing. As Fidelity UK notes, markets move in cycles and it is common to go through periods where values fall before recovering. Morgan Stanley research found an 80% probability of positive returns in the two years following a year of negative returns for both stocks and bonds.
What is dollar-cost averaging and does it help with short-term volatility?
Dollar-cost averaging (DCA) is the practice of investing a fixed amount at regular intervals regardless of market conditions. In volatile markets, DCA works to your advantage by purchasing more units when prices are lower and fewer units when prices are higher, reducing your average cost per unit over time. It also removes the psychological burden of timing the market. For most individual investors, a monthly direct debit into an investment account is the practical implementation of DCA.
How do I know if my investment is actually performing poorly or just experiencing normal volatility?
The key tests are: (1) compare performance to the relevant benchmark index, not to cash or to other unrelated investments; (2) assess whether the investment's strategy, manager, and portfolio have changed fundamentally; (3) consider whether you are experiencing normal market-wide volatility (which affects all similar investments equally) or a specific problem with your investment; and (4) evaluate over a period of at least three to five years rather than weeks or months. Normal volatility affects all similar investments; a specific problem typically shows up as consistent underperformance relative to the benchmark.
What is sequence-of-returns risk?
Sequence-of-returns risk is the risk that a significant market decline occurs early in the period when you are drawing income from your investment portfolio (typically early retirement). For someone still accumulating and contributing regularly, a bad first year is a manageable event and can even be beneficial through DCA. For someone drawing income from a fixed portfolio, a bad first year permanently reduces the portfolio's ability to support future withdrawals, because the depleted capital has less time to recover. This is why the same level of market volatility has different implications depending on whether you are accumulating or drawing down.
Should I invest a lump sum all at once or spread it out?
Both strategies have historical evidence on their side. Vanguard research has found that lump-sum investing outperforms DCA approximately two-thirds of the time in rising markets, because the money is invested sooner and benefits from more compounding time. But DCA reduces the emotional risk of investing a lump sum at a market peak, and for investors who find the psychological weight of short-term volatility difficult to manage, the gradual entry can prevent panic-selling at the worst moment. For most individual investors without large lump sums, regular monthly investing is the most practical approach regardless.

Table of Contents
- Introduction: Investing and the Problem of the First Day
- The Psychology of Watching Your Investment Move
- After 1 Week: What You’re Actually Seeing
- After 1 Month: Slightly More Signal, Still Mostly Noise
- After 1 Year: When Patterns Start to Emerge
- The Historical Evidence: Short Term vs. Long Term
- What Different Asset Classes Look Like Over These Timescales
- The Danger of Acting on Short-Term Movements
- Dollar-Cost Averaging: How Regular Investing Changes the Calculation
- The 10 Best Days Problem: Why Missing the Market Is Costly
- The Right Way to Assess Your Investment’s Progress
- Conclusion: The First Year Is Just the Introduction
- Frequently Asked Questions
- External References and Further Reading
Investing and the Problem of the First Day
The moment you make your first investment, something changes. The money you put in is no longer a number in a savings account — stable, predictable, unchanged from one day to the next. It is now a living number, fluctuating with every tick of the markets it is invested in. On day one, it might be up 0.8 percent. On day two, down 1.2 percent. By the end of the first week, you are already ahead or behind your starting point, and the emotional experience of this is almost always more intense than the rational investor expected.This is normal. And it is one of the most important things to understand about investing. What you see in your first week, first month, and first year of investing tells you very different things about the investment — and the thing it tells you least is whether your strategy is working. As Fidelity UK's June 2026 guide put it: what happens in your first week, month or even year of investing doesn’t tell you much on its own. Short-term movements are often just noise.
This article explains precisely what to expect — and what to make of it — at each of those three time horizons, drawing on current market data, historical evidence from the MSCI World index, the S&P 500, and the Columbia Threadneedle and Standard Chartered research published in 2025 and 2026.
The Psychology of Watching Your Investment Move
Before getting into what actually happens to investment values over time, it is worth understanding the psychological dynamic that makes short-term fluctuations so disorienting. Behavioural economics has a well-established finding: humans experience a financial loss approximately twice as intensely as they experience an equivalent gain. This is called loss aversion, and it was identified by Daniel Kahneman and Amos Tversky in research that formed the foundation of behavioural economics.In practical investment terms, this means that a 2 percent decline in your portfolio is experienced approximately as strongly as a 4 percent gain. A week in which your investment falls by £50 on a £1,000 investment feels meaningfully worse than a week in which it rises by £50 feels good. Over time, this asymmetric emotional response can push investors toward exactly the wrong behaviour: selling after falls (to stop the emotional pain) and buying after gains (when the emotional reward is most available), which is the inverse of the patient long-term strategy that the evidence consistently shows produces the best outcomes.
Columbia Threadneedle's adviser research summarises the data from cognitive science: there is strong evidence that humans experience a stronger emotional response to a financial loss than to an equivalent financial gain. Simply sitting tight and riding out short-term volatility is usually the right thing to do.
After 1 Week: What You're Actually Seeing
After one week, a new investor is likely experiencing one of two things: their investment is up and they feel relieved, or it is down and they feel anxious. What the data shows is that either experience is essentially random with respect to the long-term outcome.One week in the stock market corresponds to five trading days. In a market that typically moves between plus and minus 2 percent per day, the range of possible one-week outcomes for a broadly diversified equity fund is roughly minus 10 to plus 10 percent, with the most common outcome being somewhere between minus 2 and plus 2 percent. The vast majority of this movement is driven by news events, market sentiment, macro data releases, and the behaviour of other investors — none of which tells you anything specific about the quality of your investment.
After one week, the single most useful thing to do is nothing. If you have invested in a broadly diversified fund aligned with your risk tolerance and time horizon, one week's performance is not actionable information. It is the market equivalent of measuring the height of a friend every hour: you are capturing real measurements, but they tell you nothing about the direction of travel over the timescale that actually matters.
Fidelity UK, June 2026: Short-term drops are a normal part of investing. But they only become real losses if you sell. What happens in your first week, month or even year of investing doesn’t tell you much on its own. Short-term movements are often just noise.
After 1 Month: Slightly More Signal, Still Mostly Noise
After one month, you have approximately 21 trading days of performance data. You have seen at least one full news cycle, one batch of economic data releases, and — in 2026's environment — probably at least one significant geopolitical or policy headline. Your investment may have moved more than you expected in either direction.This is still predominantly noise. The S&P 500 opened 2026 down approximately 4 percent in the first quarter after an 18 percent total return in 2025. An investor who started investing in January 2026 and checked after one month would have seen a loss. An investor who started in November 2025 and checked after one month would likely have seen a gain. Neither starting month told them anything useful about the five-year or ten-year outcome of their strategy.
One month's returns do contain slightly more information than one week's, in the sense that a pattern of consistent monthly losses may eventually indicate a bear market, and consistent monthly gains may indicate a bull market. But a single month is still far too short to distinguish a temporary correction from the beginning of a sustained downturn, or a temporary rally from a sustained recovery. The most common error investors make at the one-month mark is extrapolating: assuming that whatever direction the last month moved in is the direction the investment will continue to move. Markets do not work that way.
The practical action at one month: check that your investment is still what you thought it was — the right fund, the right platform, the right charges. Do not check it to make a decision about whether to hold or sell.
After 1 Year: When Patterns Start to Emerge
After 12 months, you have real data that deserves genuine attention. You have seen your investment through at least one full seasonal cycle, probably through at least one significant market event, and you now know something concrete about how the investment behaves under real conditions rather than hypothetical ones.But as Fidelity UK emphasises in its June 2026 guide, one year is still a short period when it comes to investing. Even if the value of your investments is lower than when you started, it doesn’t necessarily mean your strategy isn’t working. Markets move in cycles, and it’s common to go through periods where values fall before recovering.
The AARP's April 2026 analysis illustrates this concretely: the S&P 500 fell 18 percent between the beginning of 2022 and early 2023 — a full year of painful losses. An investor who sold after that year of losses would have crystallised a real loss. The index then climbed approximately 44 percent from early 2022 to early 2026. The investor who stayed invested recovered, and then significantly exceeded, where they were before the losses.
After one year, the most useful questions are forward-looking, not backward-looking. Has your financial situation changed? Has your time horizon shortened? Has your risk tolerance been tested and found to be different from what you assumed? If the answer to any of those is yes, a review with a financial adviser is worthwhile. If the answer to all of them is no, the evidence strongly suggests the right course is to stay invested.
The Historical Evidence: Short Term vs. Long Term
The Standard Chartered and Columbia Threadneedle data makes the picture starkly clear: over 38 years from 1988 to 2025, global equity markets had positive annual returns in 28 of those years. That is 74 percent of calendar years. The losses were real in the other 26 percent of years, but they were followed by recoveries in the overwhelming majority of cases. The longer the time horizon, the more consistent the positive outcome pattern becomes.
What Different Asset Classes Look Like Over These Timescales
The experience of a new investor depends significantly on what they are invested in:Global Equity Funds
The most volatile in the short term, but the historically strongest over long periods. Columbia Threadneedle's analysis of the MSCI World Index from March 2024 to February 2025 identified 15 peaks and troughs in a single 12-month period. The overall return for the full period: 15.8 percent. Individual days within those 15 oscillations would have shown the portfolio down by several percent; the cumulative result was a strong positive return. This is the clearest illustration of why staying invested through short-term volatility is typically the right decision.Bond Funds
Generally less volatile week-to-week and month-to-month than equity funds, but capable of significant losses over one year when interest rates rise rapidly. 2022 demonstrated this: the Bloomberg US Aggregate Bond Index fell approximately 13 percent in a year when equity markets were also falling. In Q1 2026, bonds ended essentially flat at -0.05% while the S&P 500 was down approximately 4.33%, demonstrating how bonds can provide a relative cushion even when they do not produce gains.Mixed / Balanced Funds
Combine equity and bond exposure, typically in proportions between 40/60 and 80/20. Smoother short-term performance than pure equity funds, but lower long-term return expectations. For new investors who find short-term equity volatility psychologically difficult to tolerate, a balanced fund can reduce the anxiety of the first year without abandoning long-term growth potential entirely.Cash-Like Instruments
Money market funds, savings accounts, and similar instruments show almost no short-term volatility — the value barely moves. But the opportunity cost is significant: in a year when equity markets return 15 percent, cash earning 4 to 5 percent means foregone growth of approximately 10 percent. Short-term stability is not the same as optimal long-term outcome.The Danger of Acting on Short-Term Movements
The most financially costly investor behaviour is not holding through volatility. It is selling in response to it. The data on this is unambiguous across decades of market history and multiple studies from major academic and financial institutions.An investor who sold in Q1 2026 when the S&P 500 was down 4 percent missed the subsequent partial recovery. An investor who sold during the UK mini-budget crisis of October 2022, when markets were at multi-year lows, crystallised those losses and missed the recovery. An investor who sold in March 2020 during COVID-19 market falls missed one of the fastest and most powerful market recoveries in stock market history — the S&P 500 recovered its March 2020 losses within five months and ended 2020 up 16 percent.
The Center for Financial Planning’s Q1 2026 commentary documented stock returns 3 and 12 months after key geopolitical conflicts over time. The consistent finding: markets tend to recover within 3 to 12 months of major conflict-related falls, and investors who stayed invested captured that recovery while those who sold did not.
Fidelity UK, June 2026: Real progress tends to happen over longer periods, as markets move through cycles and your investments have time to grow. That’s why time in the market matters more than timing the market. The most effective investors aren’t the ones who react to every movement, but the ones who stay consistent, keep investing, and give their money time to grow.
Dollar-Cost Averaging: How Regular Investing Changes the Calculation
For investors making regular monthly contributions rather than a single lump sum, the experience of the first week, month, and year looks different in an important way: short-term falls become advantages rather than purely negatives.Dollar-cost averaging (DCA) — investing a fixed amount at regular intervals regardless of market conditions — means that when markets are lower, your fixed monthly contribution buys more units of the fund than it does when markets are higher. A month in which your existing investment falls 5 percent is also a month in which your new contribution purchases units at 5 percent below last month's price. Over time, this reduces your average cost per unit across the accumulation period.
This is why the mathematical reality for a regular investor is different from the emotional reality. Emotionally, a falling portfolio feels bad. Mathematically, for an investor still in the accumulation phase with years of contributions ahead, a sustained period of lower prices reduces the average cost of the total position — which improves the eventual return when prices recover.
The investor who should pay most attention to short-term falls is the one close to the point of drawing down on their investments — this is what retirement planning specialists call sequence-of-returns risk, as documented by HF Financial in April 2026. For someone still accumulating over a ten or twenty year horizon, short-term falls are a largely irrelevant feature of the journey.
The 10 Best Days Problem: Why Missing the Market Is Costly
The most powerful empirical argument for staying invested through short-term volatility is the cost of missing the market's best days. Multiple major research houses, including JPMorgan Asset Management, BlackRock, and Lord Abbett, have studied this across decades of market history. The finding is consistent:Missing just the ten best trading days of any decade eliminates approximately 80 percent of the total return for that decade. The ten best days account for the majority of long-term market gains. And those ten best days are almost always clustered immediately after the worst days. The investors most likely to miss the ten best days are precisely those who sold during the worst days — the days when panic was highest and the emotional pressure to exit the market was most intense.
In a market where a week's performance is largely unpredictable, where a month's performance is predominantly noise, and where even a year's performance can deceive, the evidence for staying invested and allowing compounding to work over the medium and long term is the most robust finding in the entire field of investment research. It is not a guarantee. It is a probability, and it is a very strong one.
The Right Way to Assess Your Investment's Progress
Given that week-one and month-one performance is largely noise, and year-one performance is informative but still far shorter than most investment time horizons, how should an investor genuinely assess progress?- Compare to the right benchmark: your equity fund should be compared to its benchmark index, not to your bank savings account. A global equity fund that is down 3 percent when global equity indices are down 5 percent has outperformed. A global equity fund that is up 5 percent when indices are up 12 percent has underperformed. Absolute returns in isolation mean very little without a relevant benchmark.
- Assess risk against tolerance: the first year is an empirical test of your risk tolerance. If your portfolio fell 15 percent in a month and you found yourself unable to sleep, your stated risk tolerance may have been higher than your actual tolerance. That is valuable information. Adjust your allocation to match your real tolerance — not to react to the specific performance.
- Review charges: over any short period, the largest predictable drag on your returns is the costs you pay. High fund charges, platform fees, and transaction costs compound negatively over time. The first year is a good opportunity to confirm you are paying competitive rates.
- Check the fundamentals remain the same: a diversified global equity fund invested in the same thousand-plus companies it was a year ago, at lower prices, is not a broken investment. It is the same investment at a better price. What should concern you is a fundamental change — a fund that has changed its strategy, its manager, or its investment universe in ways you did not anticipate.
- Use the year to educate, not to decide: the first year of investing is most usefully spent building knowledge — about how your investments work, about what normal volatility feels like, about the difference between temporary price falls and permanent capital loss. Decisions made from that educated position in year two and beyond are typically better than reactive decisions made in year one.
Conclusion
After one week, your investment has given you a data point that is almost entirely noise. After one month, it has given you slightly more information, but not enough to make a meaningful decision about your strategy. After one year, you have real experience of how your investment behaves in market conditions — but one year is still the beginning of most investment journeys, not a checkpoint for exit decisions.The historical evidence is consistent and clear across every major developed market over the past century. Investors who stay invested through the noise of the first week, the volatility of the first month, and the full market cycle of the first year and beyond are, on average, the ones whose money grows. Markets recovered from every war, every financial crisis, every recession, and every period of political uncertainty in the modern era. They are down approximately 4 percent in Q1 2026 and were up 18 percent in 2025. Both facts are true simultaneously.
As Fidelity UK's June 2026 guide concludes: it is not the first few weeks or months that shape your outcome. It is the years you stay invested. The best thing you can do in week one, month one, and year one is to understand this, feel it in the real experience of your fluctuating portfolio, and choose not to react to the noise.
Frequently Asked Questions
Is it normal for my investment to fall in the first week?Yes. Weekly investment performance is essentially random, and short-term falls are a completely normal part of investing. Even in strong bull markets, individual weeks are frequently negative. The S&P 500, which returned 18% in 2025 and 44% from 2022 to 2026, had many negative individual weeks throughout that period. A fall in week one does not tell you anything meaningful about your investment's long-term trajectory.
Should I check my investment every day?
Most financial advisers and investment research suggests that frequent checking of investment performance — particularly daily monitoring — is counterproductive. It creates emotional responses (primarily loss aversion) that can lead to poor decisions without providing useful information, since daily performance is essentially noise. For long-term investors, quarterly or semi-annual reviews are typically sufficient.
What if my investment is down after 1 month?
A fall in the first month is common and does not indicate that your strategy is wrong. The S&P 500 fell approximately 4% in Q1 2026, the first quarter of the year, after an 18% gain in 2025. An investor who started in January 2026 saw a loss after one month; that is completely normal market behaviour. Unless your financial situation or goals have fundamentally changed, staying invested is almost always the appropriate response to a one-month loss in a diversified fund.
What if my investment is still down after 1 year?
A year of negative returns is relatively uncommon but does occur: global equity markets have had positive annual returns in approximately 74% of calendar years since 1988. A down year does not mean your strategy is failing. As Fidelity UK notes, markets move in cycles and it is common to go through periods where values fall before recovering. Morgan Stanley research found an 80% probability of positive returns in the two years following a year of negative returns for both stocks and bonds.
What is dollar-cost averaging and does it help with short-term volatility?
Dollar-cost averaging (DCA) is the practice of investing a fixed amount at regular intervals regardless of market conditions. In volatile markets, DCA works to your advantage by purchasing more units when prices are lower and fewer units when prices are higher, reducing your average cost per unit over time. It also removes the psychological burden of timing the market. For most individual investors, a monthly direct debit into an investment account is the practical implementation of DCA.
How do I know if my investment is actually performing poorly or just experiencing normal volatility?
The key tests are: (1) compare performance to the relevant benchmark index, not to cash or to other unrelated investments; (2) assess whether the investment's strategy, manager, and portfolio have changed fundamentally; (3) consider whether you are experiencing normal market-wide volatility (which affects all similar investments equally) or a specific problem with your investment; and (4) evaluate over a period of at least three to five years rather than weeks or months. Normal volatility affects all similar investments; a specific problem typically shows up as consistent underperformance relative to the benchmark.
What is sequence-of-returns risk?
Sequence-of-returns risk is the risk that a significant market decline occurs early in the period when you are drawing income from your investment portfolio (typically early retirement). For someone still accumulating and contributing regularly, a bad first year is a manageable event and can even be beneficial through DCA. For someone drawing income from a fixed portfolio, a bad first year permanently reduces the portfolio's ability to support future withdrawals, because the depleted capital has less time to recover. This is why the same level of market volatility has different implications depending on whether you are accumulating or drawing down.
Should I invest a lump sum all at once or spread it out?
Both strategies have historical evidence on their side. Vanguard research has found that lump-sum investing outperforms DCA approximately two-thirds of the time in rising markets, because the money is invested sooner and benefits from more compounding time. But DCA reduces the emotional risk of investing a lump sum at a market peak, and for investors who find the psychological weight of short-term volatility difficult to manage, the gradual entry can prevent panic-selling at the worst moment. For most individual investors without large lump sums, regular monthly investing is the most practical approach regardless.
External References and Further Reading
- Fidelity UK — What Happens to Your Investment After 1 Week, 1 Month and 1 Year (June 2026)
- Columbia Threadneedle — Short-Term Volatility in Context (Adviser Edge, 2025)
- Center for Financial Planning — Q1 2026 Investment Commentary: Navigating Volatility & Opportunity (April 2026)
- Standard Chartered Global CIO Office — Managing Allocations in Volatile Markets (May 2026)
- HF Financial — What Market Volatility in 2026 Means for Retirement Income Planning (April 2026)
- AARP — Investment Return Calculator & Market Data (Updated April 2026)
- Mackenzie Investments — Monthly Economic Update January 2026: Presidential Cycle and Market Outlook
- Morningstar — Portfolio Diversification and the 60/40 Portfolio in 2025 (December 2025)
- Vanguard — Dollar-Cost Averaging vs. Lump-Sum Investing
0 Comments
Be the first to share your thoughts on this article.