

Financial Literacy
Why More Americans Are Joining the Upper Middle Class
Table of Contents
- The Class Story Nobody Is Telling
- The Landmark AEI Study: What the Data Actually Shows
- Defining the Upper Middle Class in 2026
- How Did the Upper Middle Class Triple? The Two Driving Forces
- The Income Distribution Shift: A Tale of Two Stories
- The Paradox: Why Do Affluent Americans Feel Squeezed?
- Geographic Reality: Where You Live Defines the Class You’re In
- The K-Shaped Economy: Who Gets Left Behind
- Conclusion: Broad Prosperity, Unequally Shared
- Frequently Asked Questions
- External References
The Class Story Nobody Is Telling
There is a story about the American middle class that almost everyone in politics agrees on. On the left, it is the story of hollowing out — good jobs shipped overseas, wages stagnant for decades, the solid middle evaporating into precarity. On the right, it is the story of elite neglect — working Americans left behind by an economy that rewards only the college-educated and the connected. Both versions agree on the core premise: the middle class is shrinking, struggling, and losing ground.A landmark January 2026 report from the American Enterprise Institute challenges that consensus with hard data, and its finding is striking enough to deserve serious attention from anyone who forms opinions about the American economy. The middle class is indeed shrinking. But not because people are falling down the ladder. It is shrinking because millions of families have climbed out of it — into the upper middle class.
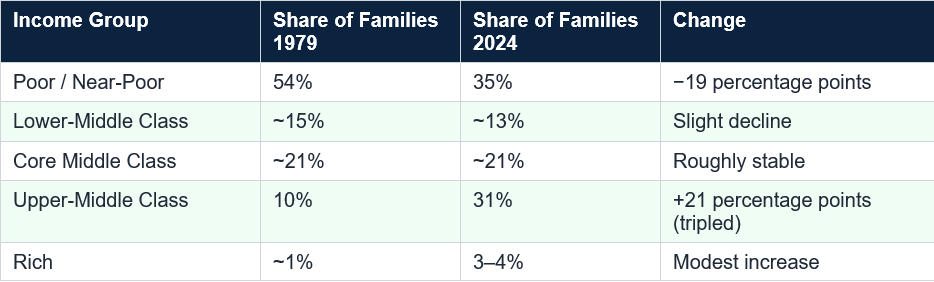
The upper middle class, defined by AEI as families with inflation-adjusted incomes above the core middle-class threshold but below the truly wealthy, has exploded from 10 percent of American families in 1979 to 31 percent in 2024. For the first time in US history, more American families sit above the core middle class threshold than below it. That is not a story of hollowing out. It is a story of widespread, if unequal, upward mobility — and it deserves to be told accurately.
The AEI finding in a single sentence: “Decrying a shrinking or hollowed-out middle class is just a gloomy way of saying the upper-middle class has boomed and fewer families are in hardship.” — Scott Winship and Stephen J. Rose, AEI, January 2026
The Landmark AEI Study: What the Data Actually Shows
The report, authored by AEI senior fellow Scott Winship and nationally recognised labor economist Stephen J. Rose, was published in January 2026 and is based on US Census Bureau data from the Annual Social and Economic Supplement to the Current Population Survey, covering family incomes from 1979 to 2024 — the most recent year for which complete data was available.The study’s methodology is important and often misunderstood. Most analyses of the middle class use a “relative” definition, tying class membership to the current-year median income. Under that approach, if income doubles for every family in America, the middle class does not change in size, because each group’s position relative to everyone else stays the same. Pew Research, for example, defines middle income as two-thirds to double the current median household income. By that measure, a rapidly growing economy appears to produce no upward mobility at all.
AEI uses an “absolute” threshold methodology instead, defining income groups by fixed real-dollar purchasing power anchored to the 2025 federal poverty guideline and adjusted for inflation using the personal consumption expenditures price index. This approach asks a different question: have families actually gotten better off over time? By this measure, the answer is unambiguously yes.
The key findings: adjusted median family income rose 52 percent from 1979 to 2024. The share of families in poverty or near-poverty fell from 54 percent to 35 percent. The share in the upper middle class tripled from 10 percent to 31 percent. Even families at the 10th percentile of the income distribution are nearly 30 percent better off in real terms than they were in 1979. The report states plainly: “Income grew across the entire distribution, except for the 5th percentile.”
Defining the Upper Middle Class in 2026
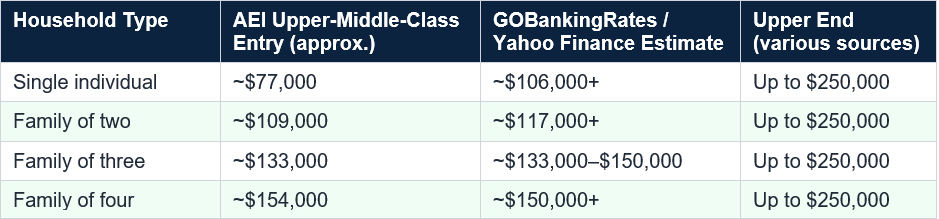
Before examining why the upper middle class has grown, it is worth establishing exactly what it means to be in it in 2026. This turns out to be more complicated than a single income figure, because the threshold depends on household size, geography, and the definition being applied.The AEI report, using its absolute threshold methodology, defines the upper middle class as families whose inflation-adjusted income falls above the core middle-class threshold but below the rich. Under AEI’s framework, a single worker needs roughly $77,000 in annual income to enter the upper middle class nationally. A family of four needs approximately $154,000. The study is careful to note that these are adjusted for family-of-three equivalents, reflecting the economic assumption that households share fixed costs.
Geography compounds the variation significantly. GOBankingRates research shows that in Mississippi, a household earning $85,424 to $109,830 qualifies as upper middle class. In Maryland, the threshold is $158,126 or more. Colorado and Utah, driven by rapid population growth and an influx of higher-paying jobs, now have upper-middle-class entry points above $150,000 — higher than New York. The national average obscures enormous regional variation.
How Did the Upper Middle Class Triple? The Two Driving Forces
The near-tripling of the upper middle class over 45 years is not a product of any single policy or technological change. AEI’s report, and the broader economics literature, points to two structural forces that together explain most of the shift.Force 1: The Educational and Professional Rise of Women
In 1970, approximately 11 percent of women had college degrees, according to Bureau of Labor Statistics data cited by AEI. By 2024, that figure had risen dramatically, and women now earn the majority of bachelor’s and master’s degrees awarded in the United States. That education translated into professional earnings and career advancement that simply did not exist on the same scale for prior generations.AEI co-author Scott Winship described it to CBS News directly: “An increase in dual-earner families, combined with professional gains for women, has fueled the income gains of the past several decades, allowing more Americans to jump from the middle class into higher-earning income brackets.” A household where one professional earned $60,000 became a household where two professionals earned $140,000. That transformation, multiplied across millions of families, is the single largest driver of the upper middle class expansion.
Force 2: The Dual-Income Household Becomes the Norm
Related to but distinct from women’s educational gains is the structural shift toward dual-income households. In the immediate post-war era, the modal American family had one wage earner. By 2024, the dual-earner household was the economic standard for middle-class and professional families. Two incomes pooled into a single household budget doubled the purchasing power of millions of families while their per-person costs increased only marginally, because housing, utilities, and many other fixed costs do not double when a household gains a second earner.The structural reality: A one-income household earning $75,000 and a two-income household each earning $75,000 both look identical in income terms. But the latter household likely has two careers, two sets of workplace benefits, two Social Security accruals, and a much stronger buffer against financial shocks from either partner’s job loss. The rise of the dual-earner household created not just more income but more economic resilience.
The Income Distribution Shift: A Tale of Two Stories
The AEI report is careful to present its findings as two simultaneous truths, not a single triumphant narrative. The first truth is that the upper middle class has tripled and that income grew across the entire distribution. The second truth is that the growth was deeply unequal, with higher earners gaining proportionally faster than those at the bottom.The upper middle class now claims roughly 50 percent of all family income in the US — double its share in 1979. Combined with the truly wealthy, the top income tiers absorb approximately 68 percent of all family income today, up from 28 percent in 1979. As Fortune’s analysis of the AEI data noted: “The share of income going to the upper-middle class and the rich combined surged from 28% in 1979 to 68% of all family income by 2024.”
The top 1 percent’s income share doubled from 5 percent to 9 percent over the same period by the AEI’s own estimates, and tax-based research by Gerald Auten and David Splinter suggests the true figure is likely higher still. The AEI report acknowledges this honestly, describing the overall picture as one of “broad prosperity, unequally shared.”
These two truths are not contradictory. It is entirely possible for nearly every income group to have become better off in absolute terms while simultaneously the distribution of income became more concentrated at the top. Both happened. The mistake — made by both political optimists and pessimists — is to treat one story as though the other does not exist.
The Paradox: Why Do Affluent Americans Feel Squeezed?
If the data shows that millions of Americans have climbed into the upper middle class and that median family income is 52 percent higher than in 1979 in real terms, why does a six-figure income still feel precarious to so many households?Fortune’s 2026 analysis of the AEI findings identified this as one of the most important questions the data raises. The answer has several layers. First, the costs that matter most for upper-middle-class aspiration — housing, higher education, and healthcare — have risen far faster than general inflation. A family earning $130,000 in a coastal metro may be unable to afford the neighbourhood where the good schools are, unable to fund a child’s college education without debt, and one serious medical event away from financial strain.
Nick Maggiulli, chief operating officer at Ritholtz Wealth Management and author of The Wealth Ladder, captured the dynamic to Fortune: “The economy wasn’t built to handle this many people with this much money.” The expansion of the upper middle class has created intense competition for a fixed supply of status goods — prestigious neighbourhoods, top universities, airport lounges, vacation rentals, elite summer programmes — driving prices to levels where even a six-figure household budget feels constrained.
Scott Winship addressed the perception gap to CBS News: “When you ask people about their own families, their own personal financial situation, you get much, much larger shares of people who say that they’re doing fairly well.” The pessimism emerges primarily when people are asked about the economy at large or about whether the next generation will do better than the current one — questions that tap into anxiety rather than current lived experience.
The key insight: Americans tend to assess the economy through media narratives and political framing rather than their own financial data. Winship noted: “There’s a tendency to focus on the three or four big-ticket items that have gotten a lot more expensive without realizing that that’s only part of what people spend their money on, and a lot of things have gotten cheaper over time.”
Geographic Reality: Where You Live Defines the Class You’re In
Perhaps the most important caveat to any national income-class analysis is that the numbers change dramatically depending on geography. The AEI report itself acknowledges this limitation explicitly: its thresholds are national averages that do not account for the dramatically different cost structures of different US markets.Visual Capitalist’s March 2026 mapping of the income needed for upper-middle-class status by state found: Colorado and Utah now require incomes above $150,000 — above New York’s $133,498 threshold — driven by rapid population growth and an influx of high-paying jobs. Mississippi’s threshold is approximately $109,000. Texas sits at $124,010. Florida is around $120,921.
The most extreme cases are urban coastal markets within high-cost states. CBS News cited research showing that an individual in parts of Manhattan needs at least $95,000 simply to make ends meet — higher than AEI’s national entry point of $76,932 for a single worker to enter the upper middle class nationally. In San Francisco, where the average monthly rent is $3,830 (more than twice the national average of $1,843), the relevant income thresholds for genuine upper-middle-class comfort may be 50 to 100 percent higher than the national figures suggest.
This geographic dimension matters enormously for interpreting the headline finding. The tripling of the upper middle class is a national phenomenon driven significantly by the growth of prosperous mid-size cities and suburban metros — places like Denver, Salt Lake City, Nashville, and Raleigh — as much as by growth in the traditional coastal hubs.
The K-Shaped Economy: Who Gets Left Behind
The growth of the upper middle class has a shadow. As CBS News noted in its April 2026 coverage of the AEI findings, the consumer economy is tilting as a result: “As more households move up the income ladder, consumer demand is tilting toward higher-end goods and services. The so-called ‘K-shaped’ economy — in which higher-income consumers are spending more while lower-income households pull back — has become a hallmark of the post-COVID economy.”The AEI data shows that real income gains have been genuine but uneven. Families at the 10th percentile are roughly 30 percent better off than they were in 1979. That is real improvement. But families at the 90th percentile are dramatically better off than families at the 10th — and the gap between them has widened. The share of families in poverty or near-poverty fell from 54 to 35 percent, which represents tens of millions of families escaping hardship. But 35 percent of American families still living at or near poverty levels in the world’s largest economy is not a celebration.
The AEI report is explicit about this tension. It presents evidence of broad upward mobility across the income distribution while acknowledging that the gains at the top vastly outpaced the gains at the bottom. The political conversation — which tends to choose one half of this story and ignore the other — is less honest than the underlying data.
Conclusion
The finding that the upper middle class has tripled since 1979 and now represents the largest income group in America is one of the most significant pieces of economic data published in 2026. It fundamentally challenges the dominant political narrative on both left and right that the American middle class has been hollowed out by economic forces beyond ordinary families’ control.The forces that drove the expansion — women’s educational attainment, the dual-income household, overall economic growth, and a safety net that protected the most vulnerable from the worst outcomes — are structural and durable. They represent real improvements in the material lives of millions of American families.
But the story is not a simple success narrative. Income concentration at the top accelerated alongside broad gains at the bottom and middle. The costs that define upper-middle-class aspiration — housing in good school districts, higher education, healthcare — have risen far faster than general inflation, creating a genuine squeeze at the boundary of the class even as more families cross it. And geography fragments the national picture into dozens of local realities that a single threshold cannot capture.
What the AEI data asks of all of us, regardless of where we sit politically, is to be honest about what is actually happening. More Americans are better off than they were in 1979 by nearly every absolute measure. That is true. The gains are concentrated at the top. That is also true. Holding both truths simultaneously, rather than choosing the one that fits a preferred narrative, is the starting point for an accurate understanding of the American economy in 2026.
Frequently Asked Questions
What income qualifies as upper middle class in 2026?
It depends on the source, household size, and location. The AEI report’s absolute threshold places the entry point at approximately $77,000 for a single person and $154,000 for a family of four, in 2024 dollars adjusted for family size. GOBankingRates and Yahoo Finance estimate the range at approximately $106,000 to $250,000 per year for a typical household, with CNBC citing $104,000 to $153,000 as a commonly referenced range. In high-cost states like Maryland and Colorado, the practical entry point exceeds $150,000. In lower-cost states like Mississippi, $85,000 to $110,000 may qualify.What did the AEI report on the middle class actually find?
The January 2026 report by AEI senior fellow Scott Winship and labor economist Stephen J. Rose found that the share of American families in the upper middle class tripled from 10 percent in 1979 to 31 percent in 2024. Using an absolute, inflation-adjusted definition of income classes, the researchers concluded that the core middle class has shrunk not because people are worse off, but because more families have crossed upward into the upper middle class. Adjusted median family income rose 52 percent over the period.Why do many Americans feel financially squeezed despite rising incomes?
Several factors contribute. Housing, healthcare, and higher education — the three most visible markers of upper-middle-class aspiration — have risen far faster than general inflation. As the upper middle class expanded, competition for desirable neighbourhoods, top universities, and premium services intensified, driving prices for status goods upward. Nick Maggiulli of Ritholtz Wealth Management described it to Fortune: ‘The economy wasn’t built to handle this many people with this much money.’ Additionally, media coverage tends to emphasise economic threats rather than broad-based gains, creating perception gaps between lived reality and perceived economic health.What caused the upper middle class to triple in size since 1979?
The two primary structural drivers are women’s educational and professional advancement, and the normalisation of the dual-income household. In 1970, about 11 percent of women had college degrees. By 2024, women were earning the majority of US bachelor’s and master’s degrees. That translated into professional earnings that, combined with a partner’s income in dual-earner households, lifted millions of families from the core middle class into the upper tier. Overall economic growth, productivity gains, and an expanded social safety net also contributed.Is the middle class actually shrinking in America?
It depends on the definition used. Using a relative definition — tied to the current-year median, as Pew Research does — the core middle class appears relatively stable or slightly smaller. Using an absolute definition — anchored to a fixed real-dollar standard of living, as AEI does — the core middle class has shrunk, but specifically because more families have moved up into the upper middle class, not because they’ve fallen into poverty. The AEI report argues that the relative approach makes it impossible to measure real improvements in living standards over time.What is the K-shaped economy?
The K-shaped economy refers to a pattern of economic recovery and growth in which higher-income households continue rising while lower-income households stagnate or fall. One branch of the K curves upward; the other downward. It became a prominent description of the post-COVID US economy, in which upper-income consumer spending remained strong while lower-income households pulled back under inflation pressure. The AEI data shows this dynamic in the income statistics: gains across the distribution were real, but vastly larger at the top than at the bottom.How does geography affect upper-middle-class income thresholds?
Significantly. The national thresholds cited in the AEI report are adjusted for family size but not for geographic cost differences. In Mississippi, a household earning $85,000 to $110,000 may qualify as upper middle class. In Colorado or Maryland, the entry point is closer to $150,000 or above. In parts of Manhattan, the cost of simply making ends meet is higher than the national single-person entry point for upper-middle-class status. Any meaningful discussion of class in America must account for where people live, not just what they earn.External References and Further Reading
American Enterprise Institute — The Middle Class Is Shrinking Because of a Booming Upper-Middle Class (January 2026), CBS News — The Upper Middle Class Is Now the Largest Income Group in the U.S., Study Finds (April 2026), Fortune — Turns Out the American Middle Class Didn’t Die. It Got Richer — and Felt Poorer (April 2026), Yahoo Finance / Benzinga — The Middle Class Is Shrinking as the Upper-Middle Class Booms (January 2026), The World Data — Upper Middle Class Income Statistics in US 2026, Visual Capitalist — Mapped: The Income Needed to Be Middle Class in Each State (March 2026), Yahoo Finance / GOBankingRates — The New 2026 Wealth Thresholds: Where Your Income Places You, GOBankingRates — What Is the Estimated Median Income for the Upper-Middle Class in 2026?, U.S. News — Where Do I Fall in the American Economic Class System?, Pew Research Center — Are You in the American Middle Class? (Income Calculator)

0 Comments Comments