

Investing
5 Investing Lessons From Baseball That Build Wealth
Warren Buffett has spent sixty years explaining his investment philosophy using baseball metaphors. Ted Williams' 77-square strike zone map. No called strikes. The sweet spot that delivers a .400 batting average versus the outside corner that delivers .230. Babe Ruth struck out nearly twice as often as he hit a home run — and became the most celebrated slugger in history. Moneyball's Billy Beane rebuilt a franchise by ignoring conventional wisdom and buying what the market mispriced. The parallels between baseball and investing are not decorative. They are precise. This guide unpacks five of them.
The parallels between baseball and the stock market run deeper than they first appear. Both reward patience over urgency. Both punish undisciplined swinging. Both deliver results that are distributed asymmetrically — a few extraordinary outcomes within a sea of modest ones, with failure being not just common but necessary. Both have been revolutionised by data and analytics that overturned a century of conventional wisdom. And both operate across time horizons long enough that the investor who can endure the inevitable losing stretches accumulates results that compound into something extraordinary.
This guide takes five specific lessons from baseball — drawn from Ted Williams, Babe Ruth, Moneyball's Billy Beane, and the simple mathematics of the nine-inning game — and applies them precisely to investing. Each lesson comes with specific statistics, historical data, and the mechanics behind why it works. Published the same week Kiplinger released its own exploration of baseball-investing parallels, this guide goes deeper on each lesson with more data, more precise baseball-to-investing translations, and the 2026 market context that makes each lesson as relevant today as when Williams was swinging for the Red Sox.
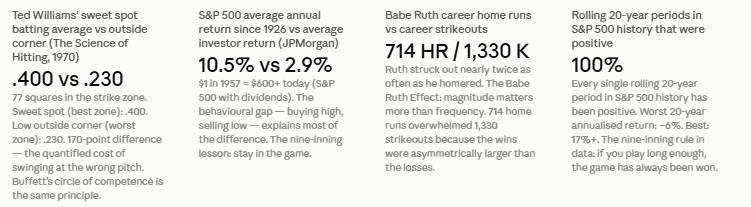
Ted Williams' sweet spot batting average: .400. Outside corner: .230 (The Science of Hitting, 1970). Williams' 77-square strike zone analysis. Career batting average: .344. Career home runs: 521. On-base percentage: .482 (highest all-time). Babe Ruth career home runs: 714. Career strikeouts: ~1,330. S&P 500 average annual return since 1926: ~10%/year nominal; ~7% inflation-adjusted (Fidelity March 2026; My ETF Journey June 2026). S&P 500 has been positive in ~70-75% of all calendar years. Every rolling 20-year period in S&P 500 history has been positive. $1 invested in S&P 500 in 1957 = $600+ today with dividends reinvested (My ETF Journey June 2026). Average investor return (JPMorgan): 2.9%/year vs market 10.49% — gap caused primarily by poor timing.
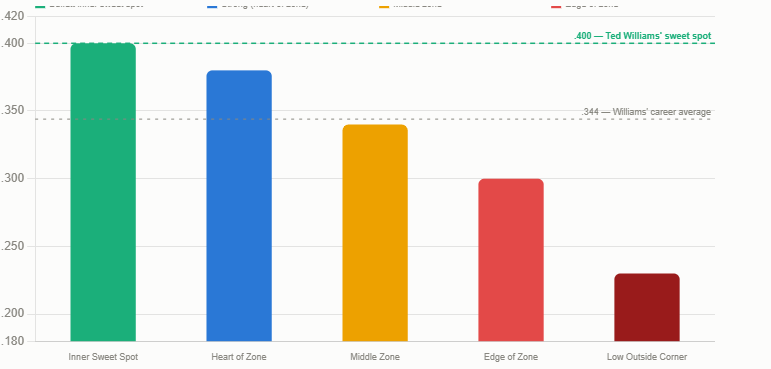
The 170-point difference between the sweet spot and the worst zone is not just a baseball statistic. It is the quantified cost of swinging at the wrong pitch. Williams spent his career refusing to swing at balls that were not in his optimal zone, even when fans jeered, even when the count went against him, even when the pressure to do something — anything — was enormous. By the time he retired, Williams had a career batting average of .344, 521 home runs, and an on-base percentage of .482 — the highest in baseball history.
Warren Buffett recognised Williams immediately as a fellow practitioner. In the HBO documentary Becoming Warren Buffett (2017), Buffett explained: 'Ted Williams described in his book The Science of Hitting that the most important thing — for a hitter — is to wait for the right pitch. And that's exactly the philosophy I have about investing — wait for the right pitch, and wait for the right deal. And it will come. It's the key to investing. If he waited for the pitch that was really in his sweet spot, he would bat .400. If he had to swing at something on the lower corner, he would probably bat .235. The trick in investing is to watch pitch after pitch go by and wait for the one right in your sweet spot. And if people are yelling, Swing, you bum, ignore them.'
The specific insight Buffett adds that Williams could not is the rule about called strikes. In baseball, refusing to swing at a pitch in the strike zone earns you a strike. Three strikes and you are out. In investing, there are no called strikes. You can watch a thousand pitches without swinging and face no penalty. The stock market will throw Apple at you in 2003, Amazon in 2006, Netflix in 2010, Microsoft in 2016 — and if those are not in your circle of competence, your sweet spot, you are permitted to let them all pass. Nobody calls you out. You wait for the one you understand, the price you like, the business model in your zone. Then you swing.
The Ted Williams lesson: your investment sweet spot is the intersection of businesses you understand deeply, with competitive advantages you can evaluate, trading at prices that offer a sufficient margin of safety. Outside that zone, you are not compelled to act. Every year the market does not offer you a pitch in your sweet spot is not a lost year — it is a year of discipline that protects you from swinging at the low outside corner. Buffett's 60-year compound annual return of approximately 20% was built on waiting. It was not built on the speed of his reactions.
Williams' insight was not just that he had a sweet spot — it was that he identified it in advance, in the cold abstract before the pitch arrived, and committed to it before emotion, crowd noise, or in-the-moment pressure could distort his judgment. By the time the pitch was in flight, the decision had already been made: only this zone gets my swing. Everything else passes.
For investors, the equivalent is a written investment policy or checklist: the pre-defined criteria a company or investment must meet before capital is committed. Buffett calls his version his 'circle of competence' — the domain of businesses he understands well enough to evaluate accurately. Charlie Munger cited Williams in Poor Charlie's Almanack (2005): 'We try to exert a Ted Williams kind of discipline.' The discipline is not in the analysis once a pitch arrives. The discipline is in the pre-commitment to the zone — so that when an interesting pitch arrives just outside it, the decision is already made.
The practical investment parallel to Williams' 77 squares: before the next market opportunity arrives, write down your investment criteria. What industries do you understand? What business characteristics define quality for you — recurring revenue, pricing power, low capital intensity, durable competitive advantage? What price relative to intrinsic value creates a sufficient margin of safety? What you cannot evaluate well is your low-outside-corner zone. It may look like a strike. It may even look inviting. But your batting average in that zone is .230, not .400 — even if you do not know it yet.
The most common version of swinging at the wrong pitch in investing: buying popular stocks at peak valuations because they appear in every headline and feel like the obvious choice. Williams' .230 zone was not the obviously terrible pitches. It was the pitches that looked close enough to good — in the strike zone, technically — but were slightly outside his optimal swing plane. The dangerous investments are not the obvious disasters. They are the ones that look plausible but are just outside your circle of competence, or priced just above fair value, or driven by momentum rather than fundamentals.
This is one of the most important and counterintuitive ideas in both baseball and investing: in systems where outcomes are asymmetric, frequency of success is far less important than magnitude of success. Ruth's strikeouts did not matter because his home runs mattered more. The runs he did not score from the outs he made were irrelevant compared to the runs scored from 714 home runs and a career slugging percentage of .690 — among the highest in MLB history.
In investing, the Babe Ruth Effect was formalised as a concept by researchers at Legg Mason (cited via Turtletrader). The core argument: what determines investment performance is not how often you are right, but the ratio of how much you make when you are right to how much you lose when you are wrong. A portfolio with five outstanding picks and three mediocre ones can dramatically outperform the market over a decade, even if six of the eight picks underperform in any given year, as long as the winners win by large enough margins.
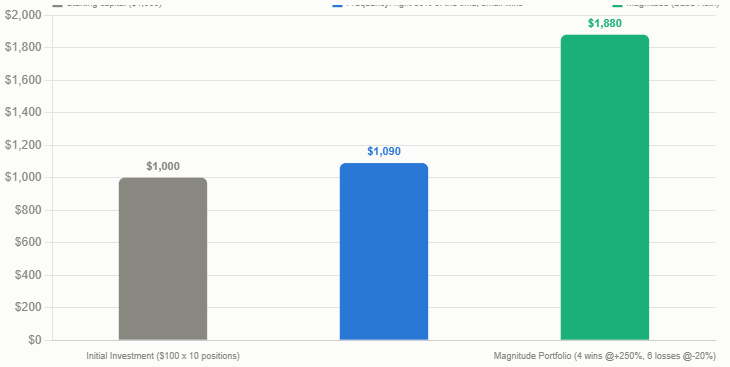
The asymmetry that makes the Babe Ruth Effect work in investing. Suppose an investor makes ten investments. Six underperform the market modestly — each losing 15% before being sold. Four outperform dramatically — each returning 300% over ten years. The arithmetic: 6 positions x -15% = -90% total loss on the losing side. 4 positions x 300% = 1,200% total gain on the winning side. Net result: the overall portfolio more than triples. The investor was wrong 60% of the time — but the magnitude of being right completely overwhelmed the frequency of being wrong. This is why venture capital as an asset class works, why Buffett's concentrated bets in Coca-Cola and American Express compounded so dramatically, and why the average investor who needs to be right most of the time dramatically underperforms someone who can tolerate being wrong often in exchange for occasionally being spectacularly right. Not financial advice — portfolio results vary widely.
The critical caveat: the Babe Ruth Effect does not justify reckless swinging. Ruth's 1,330 strikeouts were a side effect of his specific swing style — he swung hard, he swung at pitches in his zone, and he accepted the misses as the price of maximum power. He was not swinging at every pitch. The investor version requires the same discipline: accepting the occasional significant loss as the cost of the strategy, not swinging at every opportunity in hopes that one of them will be a home run. The combination of Ted Williams-style selectivity with Babe Ruth-style acceptance of asymmetric outcomes is the full picture.
The Babe Ruth lesson: measure yourself by the quality and magnitude of your wins, not by the frequency. An investor who makes twelve investment decisions per year, of which nine are mediocre and three are outstanding, will almost certainly deliver better long-term results than one who makes twelve decisions of which eleven are modestly positive and one is spectacularly right. The correct response to an investment that does not work out is not shame — it is analysis of whether the process was sound. Ruth was not a bad hitter because he struck out 1,330 times. He was the greatest power hitter who ever played because of what happened the other times.
Nassim Taleb framed this asymmetry precisely in the investing context, as cited in the Turtletrader / Babe Ruth Effect analysis: 'The most probable outcome and the expected value are different things.' Focusing on frequency — wanting to be right most of the time — is a natural human cognitive preference that often produces suboptimal investment portfolios. We feel better when we are right frequently. But the market rewards expected value, not frequency of correctness.
This is one of the key reasons the average investor return (approximately 2.9% per year, per JPMorgan, cited by Trade That Swing) is so far below the market's long-run return of approximately 10.49% per year. The average investor trades too frequently, trying to be right often, selling losers quickly (often at the worst moment) and holding winners for shorter periods than the compounding would reward. The Babe Ruth approach — staying invested in the large winners far longer than feels comfortable, and accepting the occasional strikeout as the cost of the strategy — is what closes that gap.
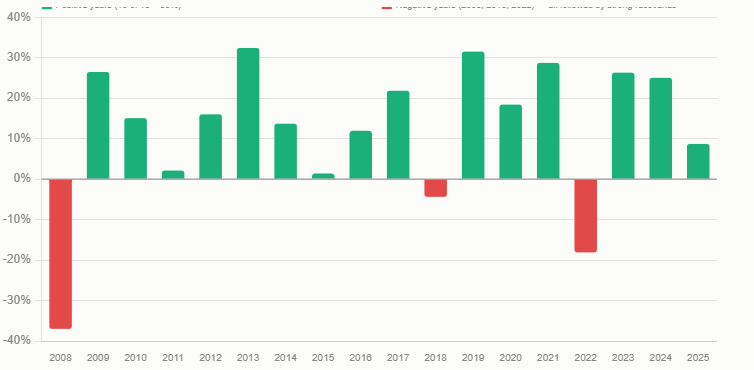
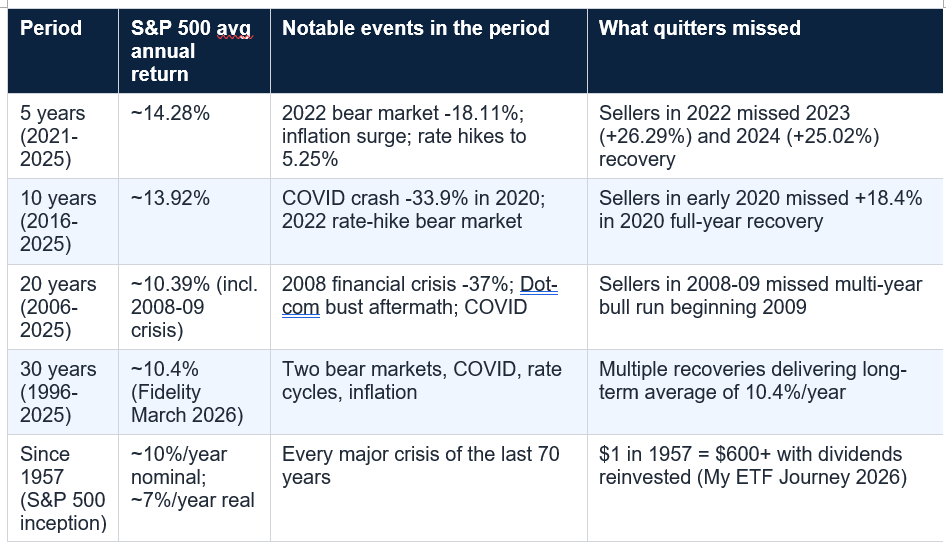
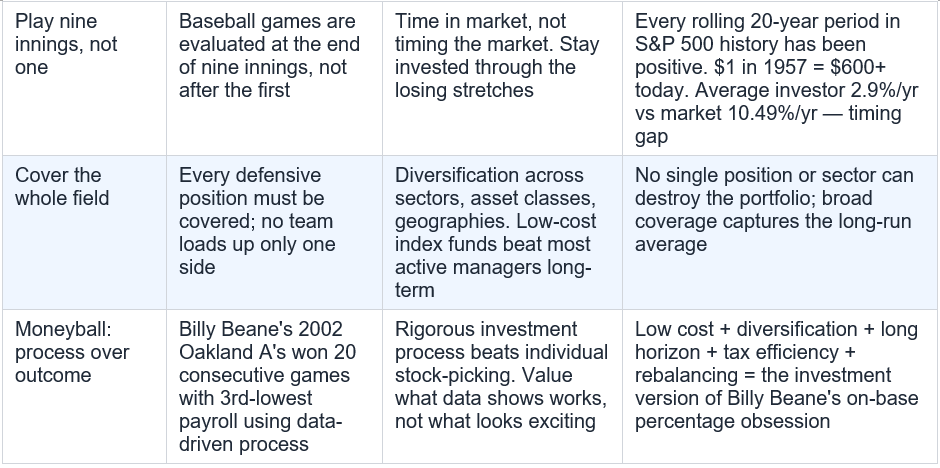
Investing is a multi-decade game. The evidence for this is unambiguous. The S&P 500 has averaged approximately 10% per year in nominal terms since 1926, and approximately 7% per year after inflation, according to Fidelity's March 2026 analysis, Wealthvieu's May 2026 data, and My ETF Journey's June 2026 review. In any given calendar year, annual returns have ranged from +54% (1954) to -38% (2008). Roughly 75% of calendar years have produced positive returns, and roughly 25% have been negative. But every rolling 20-year period in S&P 500 history has been positive. Every single one.
The investor who judges the game after one inning — who sees a 2022 return of -18.11% and concludes the market is broken, then misses the 2023 return of +26.29% — has not played badly. They have stopped playing. The damage is not from the bad year. The damage is from stepping off the field in inning four and never returning for the final five.
Kiplinger's September 2026 baseball-investing feature published this week states it plainly: 'Rather than letting short-term volatility dictate your strategy, it is more productive to play the long game — both in baseball and with your money.' The S&P 500's 30-year average return through December 2025 was 10.4% per year, per Fidelity. That 30-year average includes the 2008 financial crisis, the dot-com crash, the COVID pandemic, and 2022's bear market. Each of those events looked like the end of the game from inside them. None of them were.
The nine-inning case in numbers. $10,000 invested in the S&P 500 in 1995: worth more than $190,000 by 2025 (Motley Fool data). $1 invested in the S&P 500 in 1957 with dividends reinvested: worth over $600 today (My ETF Journey June 2026). NerdWallet: between 1926 and 2025, S&P 500 returns fell within the 'average' band of 8%-12% only eight times. The other years were much higher or lower — which is exactly why staying invested through the wild years is the mechanism that captures the average. Worst single calendar year: -38% in 2008. Next year (2009): +26.46%. The investor who sold in 2008 and waited for clarity missed the best recovery year in a generation. Not financial advice — past returns do not guarantee future results.
The nine-inning rule in practice: automate your investments (monthly dollar-cost averaging regardless of what the market is doing), set your asset allocation according to your time horizon and risk tolerance, and review it annually — not daily or monthly. The most productive thing most long-term investors can do with financial news is consume less of it. The game runs nine innings. The first-inning score is not the final score.
My ETF Journey's June 2026 analysis of S&P 500 historical returns puts the magnitude of this behavioural gap in compounding terms. At 10% per year, $1 invested in 1957 becomes $600+ today. At 2.9% per year — the average investor's return — $1 invested in 1957 becomes approximately $6 today. The difference between staying in the game and repeatedly exiting and re-entering is the difference between $6 and $600. Same market. Different inning count.
In investing, diversification is the equivalent of covering the whole field. It does not mean owning everything — it means ensuring that no single position, sector, or outcome can destroy the portfolio. Kiplinger's September 2026 baseball feature draws this parallel explicitly: 'Just as a baseball team needs players at every position — covering the whole field — investors need positions across asset classes, sectors, and geographies, so that they can field whatever the market throws.'
The Moneyball dimension of this lesson is about what to diversify into. Michael Lewis's 2003 book documented how Billy Beane's Oakland Athletics, constrained by one of the lowest payrolls in Major League Baseball, used statistical analysis to identify dramatically undervalued players. Conventional baseball wisdom prized batting average and home runs. Beane's sabermetricians discovered that on-base percentage was a far better predictor of run production — and it was dramatically undervalued by the market because it was less exciting. Players who walked a lot were cheap. Players who hit home runs were expensive. Beane bought on-base percentage.
The investing parallel runs directly to Moneyball's logic: index funds and factor-based strategies buy the undervalued — the broad market, value stocks, small-cap stocks — rather than chasing the expensive stars of the moment. Evidence Investor's December 2024 analysis draws the explicit connection between Michael Lewis and Moneyball and the Fama-French factor research of 1992: both were statistical revolutions that overthrew conventional wisdom by finding what the market systematically mispriced. Billy Beane bought cheap walks. Fama and French found cheap small-caps and value stocks delivered excess returns because they were systematically neglected.
The diversification lesson from baseball: build your portfolio like a good fielder, not a home-run chaser. Broad exposure across sectors and geographies, with tilts toward the statistically undervalued (value stocks, small-caps), at the lowest possible cost. A low-cost index fund covering the whole market is the investing equivalent of fielding every position well. Most actively managed funds that concentrate in star names — the equivalent of loading up on expensive home-run hitters — underperform broadly diversified index funds over 10 to 15-year periods, consistent with the SPIVA annual data from S&P Dow Jones Indices.
In investing, the most important distinction is between a good process and a good outcome. These are not the same thing. A good process — buy diversified assets at low cost, maintain a long time horizon, rebalance periodically, avoid emotionally-driven decisions — will produce excellent outcomes over a 20 to 30-year period. But in any given year, the same process may produce a return of -20% while a gambler who concentrated everything in the year's hottest stocks produced +40%. The gambler will feel like a genius. The disciplined investor will question whether the process works. The next year, the gambler is typically down 40% while the disciplined investor is up 15%. Process wins over seasons, not individual at-bats.
The failure mode Moneyball specifically identified was the conventional wisdom trap: the baseball establishment had been making roster decisions for a century based on what looked right — charismatic players, flashy tools, high batting averages — rather than what data showed actually produced wins. Beane asked: what does it take to score runs? The answer was getting on base. Everything that did not contribute to on-base percentage or slugging was secondary. The parallels to investment fees, benchmark-hugging, and the preference for exciting stories over boring fundamentals are direct.
Michael Lewis himself — in a later episode of his podcast Against the Rules, cited by BestInterest.blog — offered a cautionary note that any investor should hear. Lewis and statistician Bill James concluded: 'Numbers start out as tools for thinking. They wind up replacing thought.' Moneyball's revolution eventually produced a baseball so optimised for statistical outcomes that it became less watchable, slower, and less human. The same risk exists in investing: so much optimisation, so much factor-tilting, so much algorithmic precision, that the investor loses the judgment that makes the process meaningful. The lesson is to use data as a framework for thinking — not as a substitute for it.
The Moneyball investor checklist. (1) Define your process before you invest, not while you are invested. (2) Focus on what produces long-run results — low costs, diversification, tax efficiency, time in the market — not what is exciting in the moment. (3) Evaluate your decisions by the quality of the process, not by the individual outcome. A good decision that produces a bad outcome is not evidence of a bad process. (4) Be sceptical of conventional wisdom — the expensive hot fund, the popular stock, the crowded trade. These are usually priced to reflect their popularity. (5) Use data to inform judgment, not to replace it.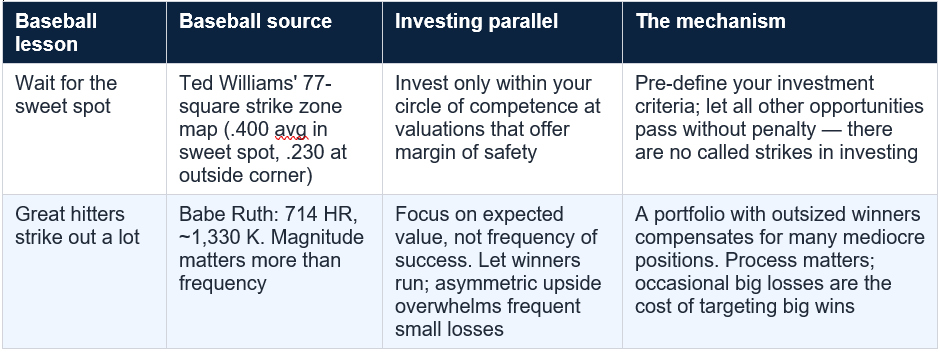
Ted Williams understood that the ability to let bad pitches pass was not timidity. It was the source of his power. Babe Ruth understood that a strikeout in inning three is irrelevant if you hit the home run in inning eight. Billy Beane understood that the process of identifying value matters more than any individual game outcome. And the S&P 500's unbroken record of positive returns across every rolling 20-year period in history — through wars, recessions, pandemics, and market crashes — is the data that validates all five lessons simultaneously.
The investor who applies these five baseball lessons is not necessarily the one who finds the best stocks or times the market most cleverly. They are the one who is still playing in inning nine when most other investors have either struck out or walked off the field. That investor — patient, selective, diversified, process-oriented, and committed to the long game — is the one the market has rewarded most reliably over the past century. The game still has the same rules. Not financial advice.
Buffett borrowed the metaphor from Ted Williams' 1970 book The Science of Hitting to explain the importance of patience and selectivity in investing. Williams had divided his strike zone into 77 baseball-sized squares and calculated his batting average in each zone. In his sweet spot (optimal zone), he estimated he would hit .400. At the low outside corner (worst zone), he would hit .230. Williams' discipline was to swing only at pitches in the best zones and let all others pass, even when under pressure to swing. Buffett's parallel: in investing, only commit capital to opportunities within your circle of competence and at prices offering a genuine margin of safety. Let everything else pass. The crucial difference from baseball: in investing, there are no called strikes. The stock market imposes no penalty for not swinging at a pitch. You can let a thousand opportunities pass without penalty and wait indefinitely for the one that is genuinely in your zone. Buffett has stated: 'The trick in investing is just to sit there and watch pitch after pitch go by and wait for the one right in your sweet spot. And if people are yelling, Swing, you bum, ignore them.' (CNBC February 2017, HBO documentary Becoming Warren Buffett.)
What is the Babe Ruth Effect in investing?
The Babe Ruth Effect describes the principle that in investing, magnitude of success matters more than frequency of success. Babe Ruth hit 714 home runs in his career but also struck out approximately 1,330 times — nearly twice as often as he homered. The strikeouts were irrelevant because the home runs produced vastly more runs than the outs cost. In investing, researchers at Legg Mason and others formalised this as: what determines portfolio performance is not how often individual investments succeed, but the ratio of how much you gain when right to how much you lose when wrong. A portfolio that has several modest failures but a few outsized winners can dramatically outperform the market over a decade. This is why venture capital works as an asset class (many failures, few spectacular wins) and why selling winners too early to avoid the discomfort of potential loss is one of the most common wealth-destroying mistakes in retail investing.
Why does time in the market beat timing the market?
The data is clear. The S&P 500 has averaged approximately 10% per year since 1926, with positive returns in roughly 70-75% of all calendar years. Every rolling 20-year period in S&P 500 history has been positive — the worst 20-year annualised return was approximately 6%. By contrast, the average investor earns approximately 2.9% per year (JPMorgan study, cited by Trade That Swing), versus the market's 10.49% long-run average. The gap is explained primarily by behaviour: investors sell during downturns and buy after recoveries, consistently missing the best days. Missing even a handful of the market's best single-day returns in any decade can cut total returns by 30-50% or more. The baseball parallel: the manager who pulls players out of the game after a bad inning often loses precisely because the team was not on the field when the momentum shifted back.
How does Moneyball apply to investing?
Moneyball's core insight — from Michael Lewis's 2003 book about Billy Beane and the Oakland Athletics — is that markets systematically misprice what is not easily measured or what does not look exciting. Baseball's conventional wisdom prized home runs and batting average. Beane's analysts found on-base percentage was a far better predictor of team success — and it was dramatically undervalued because it was less glamorous. In investing, the parallel is value investing and factor-based strategies: buying what the market undervalues because it is boring, out of favour, or analytically harder to appreciate. Low-cost index funds beat most actively managed funds over 10-15 year periods (consistent with SPIVA data) because they buy the whole market systematically rather than overpaying for exciting names. Evidence Investor's December 2024 analysis draws the explicit comparison between Moneyball and the Fama-French factor model of 1992, which found that small-cap and value stocks delivered excess returns precisely because they were systematically neglected by the market. Not financial advice.
What are the five investing lessons from baseball?
The five lessons covered in this guide are: (1) Wait for your sweet spot — Ted Williams' 77-square strike zone analysis and Buffett's no-called-strikes principle: invest only within your circle of competence at prices offering margin of safety; (2) Great hitters strike out a lot — the Babe Ruth Effect: magnitude of success matters more than frequency; let winners run and accept occasional losses as the cost of targeting asymmetric upside; (3) Play nine innings, not one — time in market beats timing the market; the S&P 500 has averaged 10%/year since 1926 and every rolling 20-year period has been positive; (4) Cover the whole field — diversification across sectors, asset classes, and geographies protects against single outcomes destroying the portfolio; and (5) Moneyball: process over outcome — define a rigorous investment process built on low cost, diversification, tax efficiency, and patience; evaluate decisions by the quality of the process rather than any individual outcome.
Table of Contents
- Why Baseball and Investing Think Alike
- Lesson 1 — Wait for the Sweet Spot: The Ted Williams / Buffett Principle
- Ted Williams' 77 Squares: What a .400 Average Can Teach Every Investor
- Lesson 2 — Great Hitters Strike Out a Lot: The Babe Ruth Effect
- Why Magnitude Beats Frequency: The Most Important Math in Investing
- Lesson 3 — Play Nine Innings, Not One: Time in Market, Not Timing
- The S&P 500 Long-Term Record: What Staying In the Game Actually Delivers
- Lesson 4 — Cover the Whole Field: Diversification and the Moneyball Portfolio
- Lesson 5 — Moneyball: Process Over Outcome and Ignoring Conventional Wisdom
- The Five Lessons Side by Side: Baseball vs Investing
- Conclusion: The Stock Market Has No Called Strikes
- Frequently Asked Questions
Lesson 1: Ted Williams sweet spot vs the outside corner
Lesson 3: S&P 500 nine-inning record — staying in the game
Lesson 2: Babe Ruth — magnitude beats frequency
Why Baseball and Investing Think Alike
Warren Buffett did not invent the connection between baseball and investing. Ted Williams did, inadvertently, when he spent a career reducing the art of hitting to a science — dividing his strike zone into 77 baseball-sized squares, calculating his batting average in each zone to the precise decimal point, and building a philosophy around one central insight: wait for the pitch in your sweet spot. Do not swing at the ones that are not. Buffett recognised that Williams had described, without knowing it, the most important principle in investing.The parallels between baseball and the stock market run deeper than they first appear. Both reward patience over urgency. Both punish undisciplined swinging. Both deliver results that are distributed asymmetrically — a few extraordinary outcomes within a sea of modest ones, with failure being not just common but necessary. Both have been revolutionised by data and analytics that overturned a century of conventional wisdom. And both operate across time horizons long enough that the investor who can endure the inevitable losing stretches accumulates results that compound into something extraordinary.
This guide takes five specific lessons from baseball — drawn from Ted Williams, Babe Ruth, Moneyball's Billy Beane, and the simple mathematics of the nine-inning game — and applies them precisely to investing. Each lesson comes with specific statistics, historical data, and the mechanics behind why it works. Published the same week Kiplinger released its own exploration of baseball-investing parallels, this guide goes deeper on each lesson with more data, more precise baseball-to-investing translations, and the 2026 market context that makes each lesson as relevant today as when Williams was swinging for the Red Sox.
Ted Williams' sweet spot batting average: .400. Outside corner: .230 (The Science of Hitting, 1970). Williams' 77-square strike zone analysis. Career batting average: .344. Career home runs: 521. On-base percentage: .482 (highest all-time). Babe Ruth career home runs: 714. Career strikeouts: ~1,330. S&P 500 average annual return since 1926: ~10%/year nominal; ~7% inflation-adjusted (Fidelity March 2026; My ETF Journey June 2026). S&P 500 has been positive in ~70-75% of all calendar years. Every rolling 20-year period in S&P 500 history has been positive. $1 invested in S&P 500 in 1957 = $600+ today with dividends reinvested (My ETF Journey June 2026). Average investor return (JPMorgan): 2.9%/year vs market 10.49% — gap caused primarily by poor timing.
Lesson 1 — Wait for the Sweet Spot: The Ted Williams / Buffett Principle
In 1970, Ted Williams published The Science of Hitting — a book that was ostensibly about baseball technique but turned out to be one of the most precise documents ever written about the importance of selectivity under pressure. Williams divided his strike zone into 77 baseball-sized squares and calculated his batting average for pitches in each zone. The squares at the heart of the zone — his sweet spot — produced an estimated batting average of .400. The squares at the low outside corner produced .230.The 170-point difference between the sweet spot and the worst zone is not just a baseball statistic. It is the quantified cost of swinging at the wrong pitch. Williams spent his career refusing to swing at balls that were not in his optimal zone, even when fans jeered, even when the count went against him, even when the pressure to do something — anything — was enormous. By the time he retired, Williams had a career batting average of .344, 521 home runs, and an on-base percentage of .482 — the highest in baseball history.
Warren Buffett recognised Williams immediately as a fellow practitioner. In the HBO documentary Becoming Warren Buffett (2017), Buffett explained: 'Ted Williams described in his book The Science of Hitting that the most important thing — for a hitter — is to wait for the right pitch. And that's exactly the philosophy I have about investing — wait for the right pitch, and wait for the right deal. And it will come. It's the key to investing. If he waited for the pitch that was really in his sweet spot, he would bat .400. If he had to swing at something on the lower corner, he would probably bat .235. The trick in investing is to watch pitch after pitch go by and wait for the one right in your sweet spot. And if people are yelling, Swing, you bum, ignore them.'
The specific insight Buffett adds that Williams could not is the rule about called strikes. In baseball, refusing to swing at a pitch in the strike zone earns you a strike. Three strikes and you are out. In investing, there are no called strikes. You can watch a thousand pitches without swinging and face no penalty. The stock market will throw Apple at you in 2003, Amazon in 2006, Netflix in 2010, Microsoft in 2016 — and if those are not in your circle of competence, your sweet spot, you are permitted to let them all pass. Nobody calls you out. You wait for the one you understand, the price you like, the business model in your zone. Then you swing.
The Ted Williams lesson: your investment sweet spot is the intersection of businesses you understand deeply, with competitive advantages you can evaluate, trading at prices that offer a sufficient margin of safety. Outside that zone, you are not compelled to act. Every year the market does not offer you a pitch in your sweet spot is not a lost year — it is a year of discipline that protects you from swinging at the low outside corner. Buffett's 60-year compound annual return of approximately 20% was built on waiting. It was not built on the speed of his reactions.
Ted Williams' 77 Squares: What a .400 Average Can Teach Every Investor
The most underappreciated element of Ted Williams' strike zone analysis is what happens to the average investor who does not have 77 squares mapped out in advance. Without a pre-defined sweet spot, every pitch looks swingable. The stock that is up 40% this year and covered breathlessly by financial media looks like it is in the sweet spot. The IPO that everyone is talking about looks like the right pitch. The sector that is currently leading the market looks like exactly the zone you should be swinging in.Williams' insight was not just that he had a sweet spot — it was that he identified it in advance, in the cold abstract before the pitch arrived, and committed to it before emotion, crowd noise, or in-the-moment pressure could distort his judgment. By the time the pitch was in flight, the decision had already been made: only this zone gets my swing. Everything else passes.
For investors, the equivalent is a written investment policy or checklist: the pre-defined criteria a company or investment must meet before capital is committed. Buffett calls his version his 'circle of competence' — the domain of businesses he understands well enough to evaluate accurately. Charlie Munger cited Williams in Poor Charlie's Almanack (2005): 'We try to exert a Ted Williams kind of discipline.' The discipline is not in the analysis once a pitch arrives. The discipline is in the pre-commitment to the zone — so that when an interesting pitch arrives just outside it, the decision is already made.
The practical investment parallel to Williams' 77 squares: before the next market opportunity arrives, write down your investment criteria. What industries do you understand? What business characteristics define quality for you — recurring revenue, pricing power, low capital intensity, durable competitive advantage? What price relative to intrinsic value creates a sufficient margin of safety? What you cannot evaluate well is your low-outside-corner zone. It may look like a strike. It may even look inviting. But your batting average in that zone is .230, not .400 — even if you do not know it yet.
The most common version of swinging at the wrong pitch in investing: buying popular stocks at peak valuations because they appear in every headline and feel like the obvious choice. Williams' .230 zone was not the obviously terrible pitches. It was the pitches that looked close enough to good — in the strike zone, technically — but were slightly outside his optimal swing plane. The dangerous investments are not the obvious disasters. They are the ones that look plausible but are just outside your circle of competence, or priced just above fair value, or driven by momentum rather than fundamentals.
Lesson 2 — Great Hitters Strike Out a Lot: The Babe Ruth Effect
Babe Ruth hit 714 home runs in his career — a record that stood for nearly 40 years. He also struck out approximately 1,330 times, nearly twice as often as he hit a home run. Ruth did not see this as a contradiction. 'Every strike brings me closer to the next home run,' he said. The philosophy was not about maximising contact. It was about maximising the magnitude of success when success came, and accepting the cost of the swings that missed.This is one of the most important and counterintuitive ideas in both baseball and investing: in systems where outcomes are asymmetric, frequency of success is far less important than magnitude of success. Ruth's strikeouts did not matter because his home runs mattered more. The runs he did not score from the outs he made were irrelevant compared to the runs scored from 714 home runs and a career slugging percentage of .690 — among the highest in MLB history.
In investing, the Babe Ruth Effect was formalised as a concept by researchers at Legg Mason (cited via Turtletrader). The core argument: what determines investment performance is not how often you are right, but the ratio of how much you make when you are right to how much you lose when you are wrong. A portfolio with five outstanding picks and three mediocre ones can dramatically outperform the market over a decade, even if six of the eight picks underperform in any given year, as long as the winners win by large enough margins.
The asymmetry that makes the Babe Ruth Effect work in investing. Suppose an investor makes ten investments. Six underperform the market modestly — each losing 15% before being sold. Four outperform dramatically — each returning 300% over ten years. The arithmetic: 6 positions x -15% = -90% total loss on the losing side. 4 positions x 300% = 1,200% total gain on the winning side. Net result: the overall portfolio more than triples. The investor was wrong 60% of the time — but the magnitude of being right completely overwhelmed the frequency of being wrong. This is why venture capital as an asset class works, why Buffett's concentrated bets in Coca-Cola and American Express compounded so dramatically, and why the average investor who needs to be right most of the time dramatically underperforms someone who can tolerate being wrong often in exchange for occasionally being spectacularly right. Not financial advice — portfolio results vary widely.
The critical caveat: the Babe Ruth Effect does not justify reckless swinging. Ruth's 1,330 strikeouts were a side effect of his specific swing style — he swung hard, he swung at pitches in his zone, and he accepted the misses as the price of maximum power. He was not swinging at every pitch. The investor version requires the same discipline: accepting the occasional significant loss as the cost of the strategy, not swinging at every opportunity in hopes that one of them will be a home run. The combination of Ted Williams-style selectivity with Babe Ruth-style acceptance of asymmetric outcomes is the full picture.
The Babe Ruth lesson: measure yourself by the quality and magnitude of your wins, not by the frequency. An investor who makes twelve investment decisions per year, of which nine are mediocre and three are outstanding, will almost certainly deliver better long-term results than one who makes twelve decisions of which eleven are modestly positive and one is spectacularly right. The correct response to an investment that does not work out is not shame — it is analysis of whether the process was sound. Ruth was not a bad hitter because he struck out 1,330 times. He was the greatest power hitter who ever played because of what happened the other times.
Why Magnitude Beats Frequency: The Most Important Math in Investing
The academic underpinning of the Babe Ruth Effect comes from the concept of expected value: the probability of an outcome multiplied by its magnitude. Two investments can have the same probability of success but completely different expected values if the potential upside or downside magnitudes differ. A stock priced for perfection may have a 70% probability of meeting expectations and rising modestly, and a 30% probability of missing and collapsing 50%. Despite the high frequency of success, the expected value may be negative. A beaten-down stock may have only a 40% probability of a positive catalyst — but a 40% probability of doubling when the catalyst occurs, against a 60% probability of losing 10% if it does not. The expected value is strongly positive.Nassim Taleb framed this asymmetry precisely in the investing context, as cited in the Turtletrader / Babe Ruth Effect analysis: 'The most probable outcome and the expected value are different things.' Focusing on frequency — wanting to be right most of the time — is a natural human cognitive preference that often produces suboptimal investment portfolios. We feel better when we are right frequently. But the market rewards expected value, not frequency of correctness.
This is one of the key reasons the average investor return (approximately 2.9% per year, per JPMorgan, cited by Trade That Swing) is so far below the market's long-run return of approximately 10.49% per year. The average investor trades too frequently, trying to be right often, selling losers quickly (often at the worst moment) and holding winners for shorter periods than the compounding would reward. The Babe Ruth approach — staying invested in the large winners far longer than feels comfortable, and accepting the occasional strikeout as the cost of the strategy — is what closes that gap.
Lesson 3 — Play Nine Innings, Not One: Time in Market, Not Timing
Baseball is a nine-inning game. No serious manager makes strategic decisions based on what happened in the first inning alone. A team that is behind after three innings can win the game. A team that leads after six can still lose. The game is evaluated at the end — when the full nine innings have been played — not in the middle, when the score reflects an incomplete picture.Investing is a multi-decade game. The evidence for this is unambiguous. The S&P 500 has averaged approximately 10% per year in nominal terms since 1926, and approximately 7% per year after inflation, according to Fidelity's March 2026 analysis, Wealthvieu's May 2026 data, and My ETF Journey's June 2026 review. In any given calendar year, annual returns have ranged from +54% (1954) to -38% (2008). Roughly 75% of calendar years have produced positive returns, and roughly 25% have been negative. But every rolling 20-year period in S&P 500 history has been positive. Every single one.
The investor who judges the game after one inning — who sees a 2022 return of -18.11% and concludes the market is broken, then misses the 2023 return of +26.29% — has not played badly. They have stopped playing. The damage is not from the bad year. The damage is from stepping off the field in inning four and never returning for the final five.
Kiplinger's September 2026 baseball-investing feature published this week states it plainly: 'Rather than letting short-term volatility dictate your strategy, it is more productive to play the long game — both in baseball and with your money.' The S&P 500's 30-year average return through December 2025 was 10.4% per year, per Fidelity. That 30-year average includes the 2008 financial crisis, the dot-com crash, the COVID pandemic, and 2022's bear market. Each of those events looked like the end of the game from inside them. None of them were.
The nine-inning case in numbers. $10,000 invested in the S&P 500 in 1995: worth more than $190,000 by 2025 (Motley Fool data). $1 invested in the S&P 500 in 1957 with dividends reinvested: worth over $600 today (My ETF Journey June 2026). NerdWallet: between 1926 and 2025, S&P 500 returns fell within the 'average' band of 8%-12% only eight times. The other years were much higher or lower — which is exactly why staying invested through the wild years is the mechanism that captures the average. Worst single calendar year: -38% in 2008. Next year (2009): +26.46%. The investor who sold in 2008 and waited for clarity missed the best recovery year in a generation. Not financial advice — past returns do not guarantee future results.
The nine-inning rule in practice: automate your investments (monthly dollar-cost averaging regardless of what the market is doing), set your asset allocation according to your time horizon and risk tolerance, and review it annually — not daily or monthly. The most productive thing most long-term investors can do with financial news is consume less of it. The game runs nine innings. The first-inning score is not the final score.
The S&P 500 Long-Term Record: What Staying In the Game Actually Delivers
The most straightforward statement of Lesson 3 is a single data point: a JPMorgan study found that the average investor earned approximately 2.9% per year over the long term, while the S&P 500 averaged approximately 10.49% per year over the same period. The difference — 7.6 percentage points per year — is almost entirely explained by behaviour. By buying after the market has risen and selling after it has fallen. By quitting the game in the third inning.My ETF Journey's June 2026 analysis of S&P 500 historical returns puts the magnitude of this behavioural gap in compounding terms. At 10% per year, $1 invested in 1957 becomes $600+ today. At 2.9% per year — the average investor's return — $1 invested in 1957 becomes approximately $6 today. The difference between staying in the game and repeatedly exiting and re-entering is the difference between $6 and $600. Same market. Different inning count.
Lesson 4 — Cover the Whole Field: Diversification and the Moneyball Portfolio
In baseball, good defence requires covering the whole field. A team that positions every outfielder on the left side because the batter tends to pull the ball will be right most of the time — and give up a double to right-centre when the batter adjusts. Smart defensive positioning anticipates that the ball will sometimes go where it is least expected.In investing, diversification is the equivalent of covering the whole field. It does not mean owning everything — it means ensuring that no single position, sector, or outcome can destroy the portfolio. Kiplinger's September 2026 baseball feature draws this parallel explicitly: 'Just as a baseball team needs players at every position — covering the whole field — investors need positions across asset classes, sectors, and geographies, so that they can field whatever the market throws.'
The Moneyball dimension of this lesson is about what to diversify into. Michael Lewis's 2003 book documented how Billy Beane's Oakland Athletics, constrained by one of the lowest payrolls in Major League Baseball, used statistical analysis to identify dramatically undervalued players. Conventional baseball wisdom prized batting average and home runs. Beane's sabermetricians discovered that on-base percentage was a far better predictor of run production — and it was dramatically undervalued by the market because it was less exciting. Players who walked a lot were cheap. Players who hit home runs were expensive. Beane bought on-base percentage.
The investing parallel runs directly to Moneyball's logic: index funds and factor-based strategies buy the undervalued — the broad market, value stocks, small-cap stocks — rather than chasing the expensive stars of the moment. Evidence Investor's December 2024 analysis draws the explicit connection between Michael Lewis and Moneyball and the Fama-French factor research of 1992: both were statistical revolutions that overthrew conventional wisdom by finding what the market systematically mispriced. Billy Beane bought cheap walks. Fama and French found cheap small-caps and value stocks delivered excess returns because they were systematically neglected.
The diversification lesson from baseball: build your portfolio like a good fielder, not a home-run chaser. Broad exposure across sectors and geographies, with tilts toward the statistically undervalued (value stocks, small-caps), at the lowest possible cost. A low-cost index fund covering the whole market is the investing equivalent of fielding every position well. Most actively managed funds that concentrate in star names — the equivalent of loading up on expensive home-run hitters — underperform broadly diversified index funds over 10 to 15-year periods, consistent with the SPIVA annual data from S&P Dow Jones Indices.
Lesson 5 — Moneyball: Process Over Outcome and Ignoring Conventional Wisdom
The deepest lesson from Moneyball is not about on-base percentage or statistical analysis. It is about process. Billy Beane's Oakland A's made roster decisions based on a rigorous, data-driven process that identified what actually caused teams to win — not what looked like it should cause teams to win. In 2002, they assembled a team that won 20 consecutive games and the American League West with the third-lowest payroll in baseball. The process worked. Many individual outcomes did not — individual games were lost, individual players disappointed — but the process produced winning results at the season level because it was optimised for long-run outcomes, not for individual exciting moments.In investing, the most important distinction is between a good process and a good outcome. These are not the same thing. A good process — buy diversified assets at low cost, maintain a long time horizon, rebalance periodically, avoid emotionally-driven decisions — will produce excellent outcomes over a 20 to 30-year period. But in any given year, the same process may produce a return of -20% while a gambler who concentrated everything in the year's hottest stocks produced +40%. The gambler will feel like a genius. The disciplined investor will question whether the process works. The next year, the gambler is typically down 40% while the disciplined investor is up 15%. Process wins over seasons, not individual at-bats.
The failure mode Moneyball specifically identified was the conventional wisdom trap: the baseball establishment had been making roster decisions for a century based on what looked right — charismatic players, flashy tools, high batting averages — rather than what data showed actually produced wins. Beane asked: what does it take to score runs? The answer was getting on base. Everything that did not contribute to on-base percentage or slugging was secondary. The parallels to investment fees, benchmark-hugging, and the preference for exciting stories over boring fundamentals are direct.
Michael Lewis himself — in a later episode of his podcast Against the Rules, cited by BestInterest.blog — offered a cautionary note that any investor should hear. Lewis and statistician Bill James concluded: 'Numbers start out as tools for thinking. They wind up replacing thought.' Moneyball's revolution eventually produced a baseball so optimised for statistical outcomes that it became less watchable, slower, and less human. The same risk exists in investing: so much optimisation, so much factor-tilting, so much algorithmic precision, that the investor loses the judgment that makes the process meaningful. The lesson is to use data as a framework for thinking — not as a substitute for it.
The Moneyball investor checklist. (1) Define your process before you invest, not while you are invested. (2) Focus on what produces long-run results — low costs, diversification, tax efficiency, time in the market — not what is exciting in the moment. (3) Evaluate your decisions by the quality of the process, not by the individual outcome. A good decision that produces a bad outcome is not evidence of a bad process. (4) Be sceptical of conventional wisdom — the expensive hot fund, the popular stock, the crowded trade. These are usually priced to reflect their popularity. (5) Use data to inform judgment, not to replace it.
The Five Lessons Side by Side: Baseball vs Investing
Conclusion
The single most important sentence Warren Buffett has ever said about investing may be the shortest: 'Unlike baseball, there are no called strikes in investing.' You are not penalised for not swinging. The stock market will continue to offer pitches indefinitely. If you miss Amazon in 2006, the market will eventually offer you another company building dominance in a new category. If you miss the 2009 recovery because you sold in 2008, the market will eventually offer you another recovery — as long as you are still at the plate.Ted Williams understood that the ability to let bad pitches pass was not timidity. It was the source of his power. Babe Ruth understood that a strikeout in inning three is irrelevant if you hit the home run in inning eight. Billy Beane understood that the process of identifying value matters more than any individual game outcome. And the S&P 500's unbroken record of positive returns across every rolling 20-year period in history — through wars, recessions, pandemics, and market crashes — is the data that validates all five lessons simultaneously.
The investor who applies these five baseball lessons is not necessarily the one who finds the best stocks or times the market most cleverly. They are the one who is still playing in inning nine when most other investors have either struck out or walked off the field. That investor — patient, selective, diversified, process-oriented, and committed to the long game — is the one the market has rewarded most reliably over the past century. The game still has the same rules. Not financial advice.
Frequently Asked Questions
What did Warren Buffett mean by the Ted Williams baseball analogy?Buffett borrowed the metaphor from Ted Williams' 1970 book The Science of Hitting to explain the importance of patience and selectivity in investing. Williams had divided his strike zone into 77 baseball-sized squares and calculated his batting average in each zone. In his sweet spot (optimal zone), he estimated he would hit .400. At the low outside corner (worst zone), he would hit .230. Williams' discipline was to swing only at pitches in the best zones and let all others pass, even when under pressure to swing. Buffett's parallel: in investing, only commit capital to opportunities within your circle of competence and at prices offering a genuine margin of safety. Let everything else pass. The crucial difference from baseball: in investing, there are no called strikes. The stock market imposes no penalty for not swinging at a pitch. You can let a thousand opportunities pass without penalty and wait indefinitely for the one that is genuinely in your zone. Buffett has stated: 'The trick in investing is just to sit there and watch pitch after pitch go by and wait for the one right in your sweet spot. And if people are yelling, Swing, you bum, ignore them.' (CNBC February 2017, HBO documentary Becoming Warren Buffett.)
What is the Babe Ruth Effect in investing?
The Babe Ruth Effect describes the principle that in investing, magnitude of success matters more than frequency of success. Babe Ruth hit 714 home runs in his career but also struck out approximately 1,330 times — nearly twice as often as he homered. The strikeouts were irrelevant because the home runs produced vastly more runs than the outs cost. In investing, researchers at Legg Mason and others formalised this as: what determines portfolio performance is not how often individual investments succeed, but the ratio of how much you gain when right to how much you lose when wrong. A portfolio that has several modest failures but a few outsized winners can dramatically outperform the market over a decade. This is why venture capital works as an asset class (many failures, few spectacular wins) and why selling winners too early to avoid the discomfort of potential loss is one of the most common wealth-destroying mistakes in retail investing.
Why does time in the market beat timing the market?
The data is clear. The S&P 500 has averaged approximately 10% per year since 1926, with positive returns in roughly 70-75% of all calendar years. Every rolling 20-year period in S&P 500 history has been positive — the worst 20-year annualised return was approximately 6%. By contrast, the average investor earns approximately 2.9% per year (JPMorgan study, cited by Trade That Swing), versus the market's 10.49% long-run average. The gap is explained primarily by behaviour: investors sell during downturns and buy after recoveries, consistently missing the best days. Missing even a handful of the market's best single-day returns in any decade can cut total returns by 30-50% or more. The baseball parallel: the manager who pulls players out of the game after a bad inning often loses precisely because the team was not on the field when the momentum shifted back.
How does Moneyball apply to investing?
Moneyball's core insight — from Michael Lewis's 2003 book about Billy Beane and the Oakland Athletics — is that markets systematically misprice what is not easily measured or what does not look exciting. Baseball's conventional wisdom prized home runs and batting average. Beane's analysts found on-base percentage was a far better predictor of team success — and it was dramatically undervalued because it was less glamorous. In investing, the parallel is value investing and factor-based strategies: buying what the market undervalues because it is boring, out of favour, or analytically harder to appreciate. Low-cost index funds beat most actively managed funds over 10-15 year periods (consistent with SPIVA data) because they buy the whole market systematically rather than overpaying for exciting names. Evidence Investor's December 2024 analysis draws the explicit comparison between Moneyball and the Fama-French factor model of 1992, which found that small-cap and value stocks delivered excess returns precisely because they were systematically neglected by the market. Not financial advice.
What are the five investing lessons from baseball?
The five lessons covered in this guide are: (1) Wait for your sweet spot — Ted Williams' 77-square strike zone analysis and Buffett's no-called-strikes principle: invest only within your circle of competence at prices offering margin of safety; (2) Great hitters strike out a lot — the Babe Ruth Effect: magnitude of success matters more than frequency; let winners run and accept occasional losses as the cost of targeting asymmetric upside; (3) Play nine innings, not one — time in market beats timing the market; the S&P 500 has averaged 10%/year since 1926 and every rolling 20-year period has been positive; (4) Cover the whole field — diversification across sectors, asset classes, and geographies protects against single outcomes destroying the portfolio; and (5) Moneyball: process over outcome — define a rigorous investment process built on low cost, diversification, tax efficiency, and patience; evaluate decisions by the quality of the process rather than any individual outcome.

0 Comments Comments