

Investing
7 Common Investing Mistakes to Avoid and What to Do Instead!

Timing: missing the 10 best days over 20 years cut the S&P 500’s annualized return from about 10.6% to about 6.4% ($10,000: about $75,000 vs $34,400); seven of the 10 best days came within two weeks of a worst day. Behavior and costs: the average investor earned 6.8% vs 10.2% for the S&P 500 over 30 years ($10,000: about $72,000 vs $184,000); 0.64% vs 0.03% fees cost about $68,000 on $500 a month; 79% of active large-cap funds trailed the S&P 500 in 2025; 56% of finfluencers show negative skill. Protection and free money: only 46% of Americans could cover three months of expenses; a 40% position falling 50% costs 20% of a portfolio; a 50% match on 6% of a $60,000 salary is $1,800 a year, about $170,000 over 30 years at 7%.
This guide covers seven of the most common ones, using 2026 data wherever I could find it and my own arithmetic to put dollars on the damage. For each, I give the fix. None of the fixes requires special talent. They require a plan, a little automation and the discipline to follow both when headlines say otherwise.
The cruel part is that the best days come right after the worst. Seven of the 10 best days over 20 years fell within two weeks of one of the 10 worst, so selling in a panic usually means missing the rebound. A Motley Fool analysis from October 17 found the same through October 2026: roughly 11% a year fully invested, under 7% without the 10 best days. To be fair, the chart is one-sided: avoiding the worst days would help even more, but nobody can reliably do that. The fix is boring: invest automatically on a schedule and stay in.

Even professional-looking lists can mislead. A stock with a rising implied upside may simply be falling: NRG Energy’s upside to analyst targets grew from about 53% in June to 85% in October because its price fell about 27%. And Kiplinger’s September list of cheap stocks included Eos Energy at $3.99; seven weeks later it traded near $1.95, down about 51%. The fix is a written process: why do I own this, what would make me sell and how much of my portfolio is it? If you cannot answer, a broad index fund is a respectable alternative.
Higher fees have not reliably bought better results. S&P Dow Jones Indices found that 79% of active large-cap funds trailed the S&P 500 in 2025. That does not mean no active manager ever wins, but it does mean you are paying more for a lower probability. The fix is to check the expense ratio of every fund you own, prefer broad low-cost index funds as your core and ask what you are getting for any extra fee.

Hendrik Bessembinder’s research cuts both ways: the best 4.3% of stocks created all the market’s net wealth, so owning a few stocks risks missing the winners and owning a lot of stocks captures them. That is the logic behind broad index funds. The fix is simple: cap any single holding at a level you could lose half of without panic, spread across sectors and countries, and remember that your index fund may already be heavy in the same big names.

With the S&P 500 up about 11.4% this year, inflation at 3.7% and the Fed deciding between holding and hiking, the headlines will keep giving you reasons to act. The fix is to decide in advance. Choose an allocation you can hold through a 30% drop, automate your contributions and write down a rule such as never selling during a panic. Review your account on a schedule instead of daily, and consider an adviser or trusted friend who can talk you out of the worst impulses.
DALBAR via MyETFJourney: average investor 6.8% a year vs 10.2% for the S&P 500 over 30 years. On $10,000 that is about $72,000 vs $184,000, a gap of about $112,000. Vanguard: automatic enrollment lifts plan participation to 94% from 64%.
The related trap is raiding retirement accounts. In my illustration, a $10,000 withdrawal at 40 nets only about $6,600 after an assumed 24% tax and the 10% early-withdrawal penalty, and the lost growth is worse: at a constant 7%, that $10,000 would have become about $62,000 by 67. Fidelity reported that 19.5% of 401(k) savers have a loan outstanding. The fix is an emergency fund of three to six months of expenses in an insured account, which top savings accounts pay about 4.34% to 4.50% on, before you invest for the long term.

Idle cash is a smaller version of the same mistake. The FDIC average savings rate was about 0.38% in June, while top accounts paid about 4.34% to 4.50% in October, so $10,000 earns about $38 versus about $434 a year. Inflation was 3.7% in September, so cash that earns 0.38% quietly loses purchasing power. The fix is to capture the match first, use a Roth IRA or HSA where eligible, and keep idle cash in an account that actually pays.

Pick the one mistake on this list that you are most likely making, and fix only that this week. A single automatic transfer or an expense-ratio check is a small step that beats a grand plan you never start.
The good news is that every one of these is within your control. Automate, diversify, keep costs low, build a cushion, capture the match and decide your rules before the next panic. You do not need to be right about the market. You need to avoid the mistakes that are easy to avoid. This is general education, not personalized advice, and a qualified adviser can help you build a plan that fits.
There is no single answer, but the most expensive ones are quiet: waiting too long to start, leaving the market after a drop and paying high fees. In my illustrations, missing the 10 best days over 20 years cut $10,000 from about $75,000 to about $34,400, the average investor trailed the S&P 500 by about 3.4 points a year over 30 years (a gap of about $112,000 on $10,000) and a 0.64% fee cost about $68,000 on $500 a month.
Should I try to time the market?
Research suggests it rarely works. JPMorgan found that over the 20 years through 2024, missing the 10 best days cut the S&P 500’s annualized return from about 10.6% to about 6.4%, and seven of the 10 best days came within two weeks of one of the 10 worst. Avoiding the worst days would help even more, but nobody can reliably predict them. Regular automatic investing is a simpler approach.
Is diversification really necessary?
Yes, for most people. Hendrik Bessembinder found that the best 4.3% of stocks created all the market’s net wealth, which means picking a few stocks risks missing the winners, while owning a broad fund captures them. A single stock that makes up 40% of your portfolio and falls 50% costs you 20% of everything. This is general education, not personal advice.
How much do investment fees really matter?
More than they look. In my illustration, $500 a month for 30 years at a 7% return before fees grows to about $606,000 in a 0.03% fund versus about $538,000 in a 0.64% fund. Top S&P 500 index funds charge 0.015% to 0.04%, and 79% of active large-cap funds trailed the S&P 500 in 2025, so higher fees have not reliably bought better results.
How do I avoid emotional investing?
Set up automatic contributions, choose an allocation you can hold through a 30% decline, keep an emergency fund so you never have to sell, and check your account less often. A written plan, with a rule such as never selling during a panic, helps. Many people also benefit from an adviser who can say no for them.
Table of Contents
- Why Mistakes Matter More Than Picks
- The Seven Mistakes at a Glance
- Mistake 1: Waiting or Timing the Market
- Mistake 2: Chasing Tips and Last Year’s Winners
- Mistake 3: Paying Too Much
- Mistake 4: Concentrating Too Much
- Mistake 5: Letting Emotions Drive
- Mistake 6: Investing Money You May Need
- Mistake 7: Leaving Free Money and Tax Breaks Unused
- A One-Page Fix List
- Conclusion
- Frequently Asked Questions
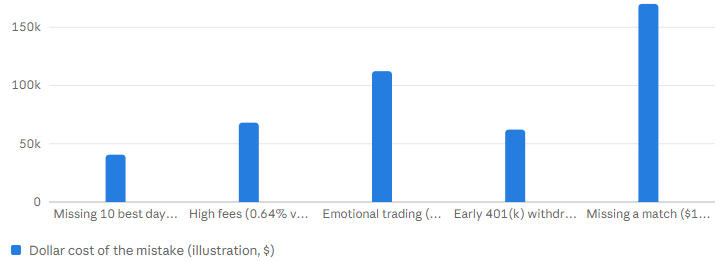
What five of the mistakes can cost: dollar damage in my illustrations ($)
Approximate cost ($) by JPMorgan; DALBAR via MyETFJourney; the author's arithmetic at constant returns; not forecasts
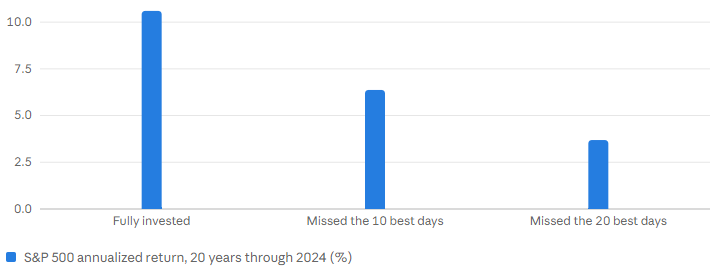
Mistake 1: what missing the market's best days does to returns (%)
Annualized return (%) by J.P. Morgan Asset Management via J.P. Morgan Private Bank; $10,000 becomes about $75,000, $34,400 and $20,600 (my arithmetic)
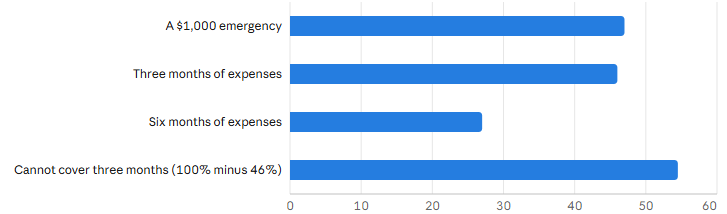
Mistake 6: how few investors have a cushion (% of Americans who could cover...)
% of Americans by Bankrate 2026 Annual Emergency Savings Report; the last bar is my arithmetic (100 - 46)
Why Mistakes Matter More Than Picks
When people think about investing, they think about picks: which stock, which fund, which trend. But if you look at what actually separates good outcomes from poor ones, it is rarely the pick. It is the behavior around the pick: when you started, whether you stayed, what you paid, how concentrated you were and whether you were forced to sell at a bad time. Those are mistakes of process, and they are far more common than mistakes of analysis.This guide covers seven of the most common ones, using 2026 data wherever I could find it and my own arithmetic to put dollars on the damage. For each, I give the fix. None of the fixes requires special talent. They require a plan, a little automation and the discipline to follow both when headlines say otherwise.
The Seven Mistakes at a Glance
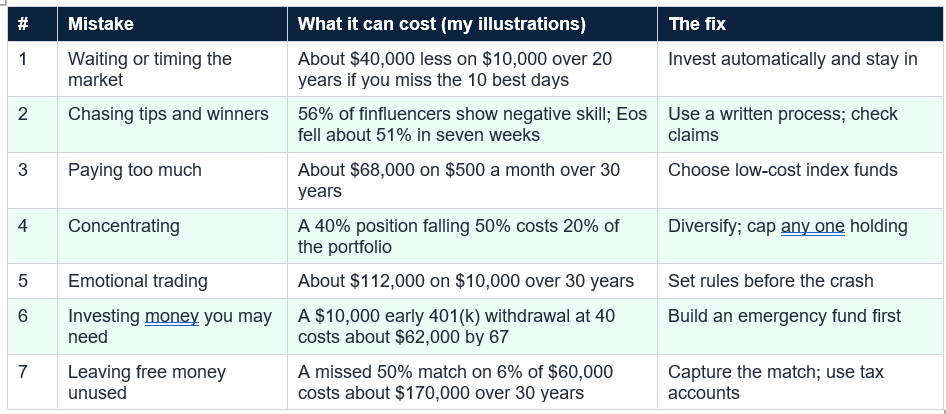
In short, the seven are: waiting or trying to time the market; chasing tips and last year’s winners; paying too much in fees; concentrating too much in a few holdings; letting emotions drive buying and selling; investing money you may need soon; and leaving free money and tax advantages unused. Each is common, and each is fixable. The table shows the rough cost and the simple remedy.
Mistake 1: Waiting or Timing the Market
The first mistake comes in two flavors: waiting for the perfect moment to start, and trying to jump out and back in. Both tend to cost you the days that matter most. JPMorgan Asset Management found that over the 20 years through 2024, the S&P 500 returned about 10.6% a year if you stayed fully invested, about 6.4% if you missed the 10 best days and about 3.7% if you missed the 20 best. On $10,000, that is about $75,000, $34,400 and $20,600, by my arithmetic.The cruel part is that the best days come right after the worst. Seven of the 10 best days over 20 years fell within two weeks of one of the 10 worst, so selling in a panic usually means missing the rebound. A Motley Fool analysis from October 17 found the same through October 2026: roughly 11% a year fully invested, under 7% without the 10 best days. To be fair, the chart is one-sided: avoiding the worst days would help even more, but nobody can reliably do that. The fix is boring: invest automatically on a schedule and stay in.
Mistake 2: Chasing Tips and Last Year’s Winners
The second mistake is acting on a hot tip, a social media pick or last year’s top performers. A Swiss Finance Institute study of finfluencers found that 56% show negative skill, meaning following them tends to cost money. Hindsight lists are tempting: NerdWallet’s data show Dell up 163.5%, Seagate 140.2% and Illumina 138.4% over the past year, but those are already history, and nobody knew in advance which would lead.Even professional-looking lists can mislead. A stock with a rising implied upside may simply be falling: NRG Energy’s upside to analyst targets grew from about 53% in June to 85% in October because its price fell about 27%. And Kiplinger’s September list of cheap stocks included Eos Energy at $3.99; seven weeks later it traded near $1.95, down about 51%. The fix is a written process: why do I own this, what would make me sell and how much of my portfolio is it? If you cannot answer, a broad index fund is a respectable alternative.
Mistake 3: Paying Too Much
Fees look small and compound large. In my illustration, $500 a month for 30 years at a 7% return before fees grows to about $606,000 in a fund charging 0.03% and about $538,000 in one charging 0.64%, a difference of roughly $68,000. On a $100,000 balance, that is $30 versus $640 a year. Top S&P 500 index funds charge 0.015% to 0.04%, according to Bankrate, so you rarely need to pay more for broad exposure.Higher fees have not reliably bought better results. S&P Dow Jones Indices found that 79% of active large-cap funds trailed the S&P 500 in 2025. That does not mean no active manager ever wins, but it does mean you are paying more for a lower probability. The fix is to check the expense ratio of every fund you own, prefer broad low-cost index funds as your core and ask what you are getting for any extra fee.
Mistake 4: Concentrating Too Much
The fourth mistake is putting too much in one stock, one sector or one theme. It feels like conviction until it goes wrong. In my illustration, a single stock that is 10% of your portfolio and falls 50% costs you 5% of everything; at 40% of your portfolio, the same fall costs you 20%. Concentration also hides inside lists of favorites: of 20 rows I retrieved from Kiplinger’s October 27 screen of stocks with 50% or more upside, about 11 were semiconductor or AI-hardware companies, so a portfolio built from it would be one bet in many costumes.Hendrik Bessembinder’s research cuts both ways: the best 4.3% of stocks created all the market’s net wealth, so owning a few stocks risks missing the winners and owning a lot of stocks captures them. That is the logic behind broad index funds. The fix is simple: cap any single holding at a level you could lose half of without panic, spread across sectors and countries, and remember that your index fund may already be heavy in the same big names.
Mistake 5: Letting Emotions Drive
Fear and greed are the quiet killers. DALBAR research, summarized by MyETFJourney, found that over 30 years the average investor earned about 6.8% a year while the S&P 500 returned about 10.2%. On $10,000, that is about $72,000 versus $184,000, a gap of more than $112,000 that came from the timing of buying and selling rather than from bad investments. People buy after a rally because it feels safe and sell after a drop because it feels unbearable.With the S&P 500 up about 11.4% this year, inflation at 3.7% and the Fed deciding between holding and hiking, the headlines will keep giving you reasons to act. The fix is to decide in advance. Choose an allocation you can hold through a 30% drop, automate your contributions and write down a rule such as never selling during a panic. Review your account on a schedule instead of daily, and consider an adviser or trusted friend who can talk you out of the worst impulses.
DALBAR via MyETFJourney: average investor 6.8% a year vs 10.2% for the S&P 500 over 30 years. On $10,000 that is about $72,000 vs $184,000, a gap of about $112,000. Vanguard: automatic enrollment lifts plan participation to 94% from 64%.
Mistake 6: Investing Money You May Need
The sixth mistake is putting money into the market that you may need within a few years. Stocks can fall 30% or more and take years to recover, and if a car repair or job loss forces you to sell at the bottom, a temporary loss becomes permanent. Bankrate found that only 47% of Americans could cover a $1,000 emergency and 46% three months of expenses, so many investors are one surprise away from selling.The related trap is raiding retirement accounts. In my illustration, a $10,000 withdrawal at 40 nets only about $6,600 after an assumed 24% tax and the 10% early-withdrawal penalty, and the lost growth is worse: at a constant 7%, that $10,000 would have become about $62,000 by 67. Fidelity reported that 19.5% of 401(k) savers have a loan outstanding. The fix is an emergency fund of three to six months of expenses in an insured account, which top savings accounts pay about 4.34% to 4.50% on, before you invest for the long term.
Mistake 7: Leaving Free Money and Tax Breaks Unused
The seventh mistake is the easiest to fix and surprisingly common: not capturing your employer’s match and not using tax-advantaged accounts. Vanguard’s data, as summarized by Q3 Advisors, show that 86% of its plans offer a match. In my illustration, a 50% match on the first 6% of a $60,000 salary is $1,800 a year, which at a constant 7% grows to about $170,000 over 30 years. Skipping it is declining part of your pay. The 2026 limits are $24,500 for a 401(k) and $7,500 for an IRA, and tax-advantaged growth compounds without annual tax drag.Idle cash is a smaller version of the same mistake. The FDIC average savings rate was about 0.38% in June, while top accounts paid about 4.34% to 4.50% in October, so $10,000 earns about $38 versus about $434 a year. Inflation was 3.7% in September, so cash that earns 0.38% quietly loses purchasing power. The fix is to capture the match first, use a Roth IRA or HSA where eligible, and keep idle cash in an account that actually pays.
A One-Page Fix List
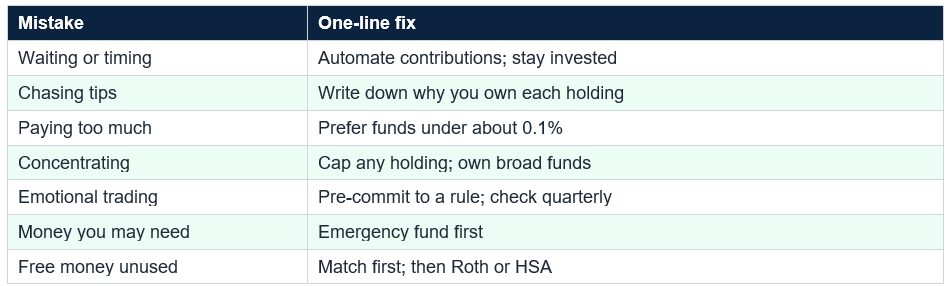
If you want to put this into practice, here is a short list. Set up automatic contributions so you invest on a schedule. Pick a broad, low-cost fund and an allocation you could hold through a 30% decline. Cap any single holding. Build three to six months of expenses in an insured savings account. Capture your full employer match. Check the expense ratio of every fund. Write a rule you will follow in a panic, and review your accounts quarterly, not daily. Do those seven things and you will have avoided most of the damage that the data in this guide describe.Pick the one mistake on this list that you are most likely making, and fix only that this week. A single automatic transfer or an expense-ratio check is a small step that beats a grand plan you never start.
Conclusion
Investing mistakes are rarely dramatic. They are quiet habits that compound against you: waiting, chasing, overpaying, concentrating, reacting, risking money you need and leaving free money behind. The data put dollar signs on them. Missing the 10 best days cost about $40,000 on a $10,000 investment over 20 years; the average investor trailed the S&P 500 by about 3.4 points a year over 30 years; a 0.64% fee cost about $68,000 on $500 a month; and a missed employer match cost about $170,000 over 30 years.The good news is that every one of these is within your control. Automate, diversify, keep costs low, build a cushion, capture the match and decide your rules before the next panic. You do not need to be right about the market. You need to avoid the mistakes that are easy to avoid. This is general education, not personalized advice, and a qualified adviser can help you build a plan that fits.
Frequently Asked Questions
What is the biggest investing mistake?There is no single answer, but the most expensive ones are quiet: waiting too long to start, leaving the market after a drop and paying high fees. In my illustrations, missing the 10 best days over 20 years cut $10,000 from about $75,000 to about $34,400, the average investor trailed the S&P 500 by about 3.4 points a year over 30 years (a gap of about $112,000 on $10,000) and a 0.64% fee cost about $68,000 on $500 a month.
Should I try to time the market?
Research suggests it rarely works. JPMorgan found that over the 20 years through 2024, missing the 10 best days cut the S&P 500’s annualized return from about 10.6% to about 6.4%, and seven of the 10 best days came within two weeks of one of the 10 worst. Avoiding the worst days would help even more, but nobody can reliably predict them. Regular automatic investing is a simpler approach.
Is diversification really necessary?
Yes, for most people. Hendrik Bessembinder found that the best 4.3% of stocks created all the market’s net wealth, which means picking a few stocks risks missing the winners, while owning a broad fund captures them. A single stock that makes up 40% of your portfolio and falls 50% costs you 20% of everything. This is general education, not personal advice.
How much do investment fees really matter?
More than they look. In my illustration, $500 a month for 30 years at a 7% return before fees grows to about $606,000 in a 0.03% fund versus about $538,000 in a 0.64% fund. Top S&P 500 index funds charge 0.015% to 0.04%, and 79% of active large-cap funds trailed the S&P 500 in 2025, so higher fees have not reliably bought better results.
How do I avoid emotional investing?
Set up automatic contributions, choose an allocation you can hold through a 30% decline, keep an emergency fund so you never have to sell, and check your account less often. A written plan, with a rule such as never selling during a panic, helps. Many people also benefit from an adviser who can say no for them.
0 Comments
Be the first to share your thoughts on this article.