

Investing
2 Sectors, 4 Stocks to Buy This November: What to Know First

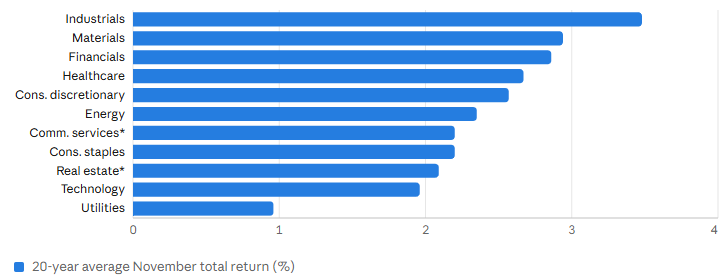
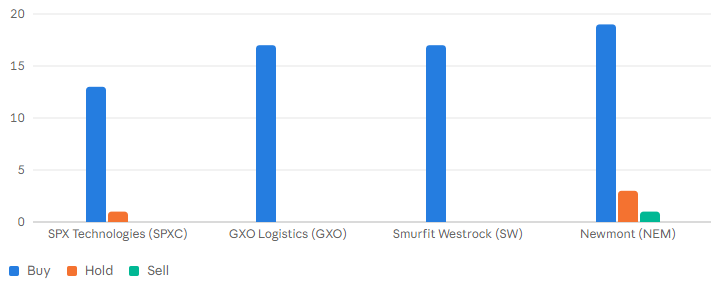
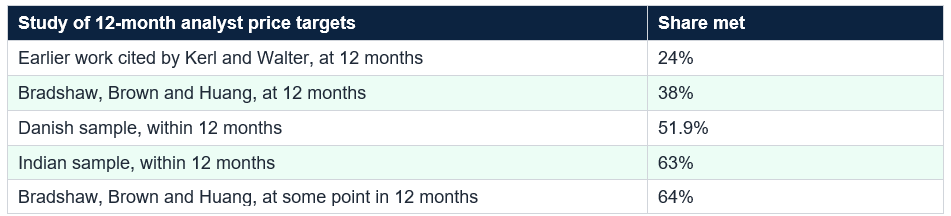
20-year average November total returns of 3.48% for industrials (XLI) and 2.94% for materials (XLB) versus an all-sector average of 2.36%; technology 1.96%; utilities 0.96%. Industrials and materials rank in the top five in all Novembers, election Novembers and midterm Novembers. The four stocks (analyst ratings as of Oct 29): SPXC 13 Buy, 1 Hold, 0 Sell (about −20% year to date, 19x forward earnings); GXO 17 of 17 Buy (Investor Day Nov 16); Smurfit Westrock 17 of 17 Buy (4.4% dividend yield); Newmont 19 Buy, 3 Hold, 1 Sell. Backdrop: XLB about +15.8% year to date at about 17.8x forward earnings; XLI at about 24.7x; 10-year Treasury about 4.93%; inflation 3.7%; analyst price targets are met only about 24%–64% of the time in academic studies. My arithmetic: the industrials edge is about 1.1 points, or $112 on $10,000; four equal 2.5% positions that each fell 20% would cost about 2% of a portfolio.
November arrives with plenty of noise: midterm elections on the 3rd, the Black Friday and Cyber Monday rush at month-end and a Fed that has just held rates while markets debate a December hike. Ignore all of that, look at what sectors have done in Novembers over the past 20 years and pick the best-rated stocks in the two that come out on top.
The result is a short list: two sectors, industrials and materials, and four stocks, SPX Technologies, GXO Logistics, Smurfit Westrock and Newmont. It is a useful starting point and also easy to over-read. This guide walks through the evidence, shows what the numbers can and cannot tell you and offers a way to use the list without letting a seasonal pattern talk you into more risk than you should take.
Kiplinger notes that industrials and materials rank in the top five in all Novembers, election Novembers and midterm Novembers over 20 years. That is consistent, but the size matters: the industrials advantage over the all-sector average is about 1.1 percentage points, or $112 on $10,000 by my arithmetic, and the materials advantage about 0.6 points, or $58. Those are averages across 20 Novembers, a single month can be far better or worse and patterns can fade once widely known.
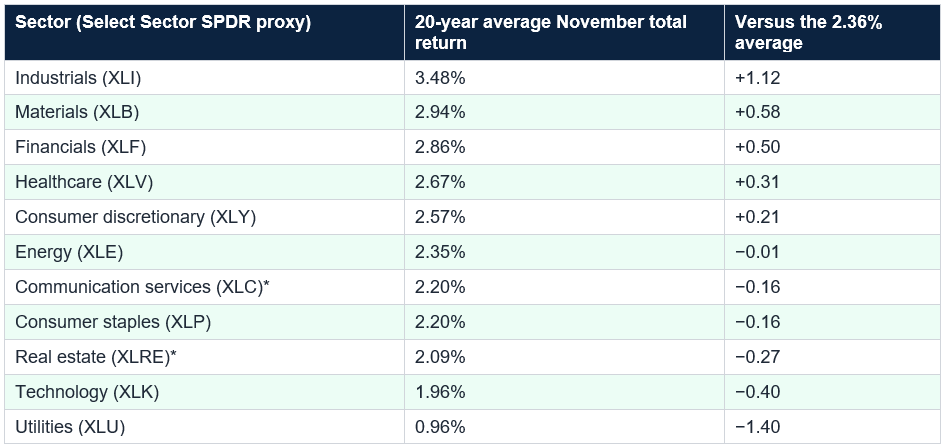
20-year average November total returns of 3.48% (industrials), 2.94% (materials) and 2.36% for all sectors. The industrials edge is about 1.1 points ($112 on $10,000); the materials edge about 0.6 points ($58). *Communication services and real estate figures are approximations.
The macro picture cuts both ways. The Fed held rates at 3.75% to 4.00% on October 28 with markets still pricing a possible December hike, the 10-year Treasury yield was about 4.93% and inflation was 3.7% in September. Industrial and materials companies are cyclical, so they benefit from growth and commodity strength and suffer when borrowing costs rise or demand slows. The S&P 500 was up about 11.4% for the year as of October 23, so these sectors are not the only game in town.
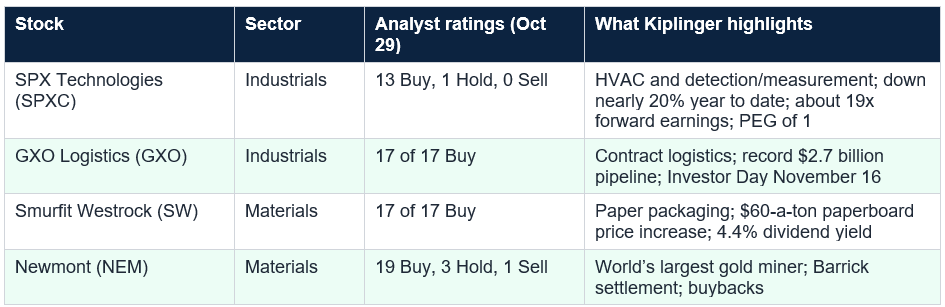
GXO Logistics provides warehousing, distribution and fulfillment. All 17 analysts rate it a Buy, and Jefferies calls it misunderstood and undervalued, citing a record $2.7 billion sales pipeline and wins in aerospace and life sciences. A potential catalyst is its Investor Day on Monday, November 16. But Kiplinger also notes that GXO fell with the market in March and never recovered, even after two better-than-expected quarters. Unanimous Buys with a lagging stock is a reminder that analysts and markets can disagree for a long time.
Smurfit Westrock makes containerboard and paper-based packaging and benefits from e-commerce. All 17 analysts rate it a Buy, Truist sees the Paperworks price increase of $60 a ton on recycled paperboard as positive for the industry, and it pays a dividend yielding about 4.4%, or about $440 a year on $10,000. Its fortunes depend on packaging demand and prices, which move with the economy, and Kiplinger says a strong holiday season would help but would not be confirmed until December.
Newmont is the world’s largest gold miner and also produces copper, silver, zinc and lead. It has the largest analyst following of the four, with 19 Buys, three Holds and one Sell, and the stock is up by double digits in what Kiplinger calls roller-coaster fashion. UBS’s Daniel Major argues that buybacks and rising production per share set it apart, and that its August settlement with Barrick removed an overhang. Gold prices drive the results, so Newmont is as much a bet on the metal as on the company. It is also about 6.4% of XLB, so sector-fund holders already own it.
There are structural reasons for caution. Ratings can lag prices, and Kiplinger’s own October screen of 30 stocks with 50% or more upside showed how a rising implied upside can mean a falling price, as with NRG Energy. And the best-rated stock is not necessarily the best-performing stock. Use ratings to find ideas worth researching, then check the company’s earnings, debt, competition and valuation yourself.

Seasonality is a weak edge: about one point on average. A single position that falls 20% erases many Novembers of that advantage. Size positions so that a bad outcome would not change your plans.
A broad index fund is the other alternative, and it has beaten most active managers: S&P Dow Jones Indices found 79% of active large-cap funds trailed the S&P 500 in 2025. Many investors keep most of their money in broad funds and use a small slice, perhaps 5% to 10%, for ideas like these.
Pick at most one or two names that you can explain in a sentence, set a position size you could lose without changing your plans, write down your reason for buying and your exit rule, and revisit it in December.
The edge from seasonality is about one point on average, and analyst targets are met only about a quarter to two-thirds of the time. The stocks are cyclical, one is down nearly 20% this year, another has lagged despite unanimous Buys and one depends on gold. Keep positions small, diversify, compare the idea with a plain index fund and let your own plan, not the calendar, drive the decision. A qualified adviser can help you decide what fits.
Over the past 20 years, industrials (XLI) have averaged a 3.48% total return in November and materials (XLB) 2.94%, the best two of the eleven sectors, versus an all-sector average of 2.36%, according to Kiplinger. Technology averaged 1.96% and utilities just 0.96%. These are historical averages, not forecasts, and the average month hides large variation.
Which four stocks does Kiplinger pick for November?
SPX Technologies (SPXC) and GXO Logistics (GXO) in industrials, and Smurfit Westrock (SW) and Newmont (NEM) in materials. Kiplinger chose names with some of the highest analyst ratings in their sectors, based on S&P Global Market Intelligence data as of October 29. These are examples drawn from analyst ratings, not recommendations from me.
Are unanimous analyst Buy ratings a good sign?
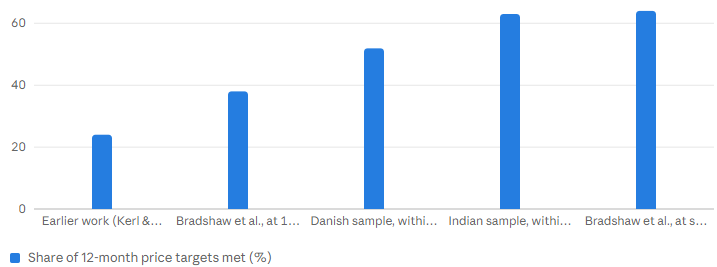
They show strong conviction, but not certainty. Academic studies find that only about 24% to 64% of 12-month analyst price targets are ever met, and accuracy falls as targets get more optimistic. GXO and Smurfit Westrock each have 17 ratings, all Buys, but GXO has struggled all year despite beating earnings expectations.
Should I buy individual stocks or a sector ETF?
An ETF spreads risk across dozens of companies; the Industrial Select Sector SPDR (XLI) and Materials Select Sector SPDR (XLB) each charge 0.08%, according to a data provider. Newmont is already about 6.4% of XLB. Individual stocks can outperform but carry company-specific risk, so keep each position small. This is general education, not personal advice.
What events could move these stocks in November?
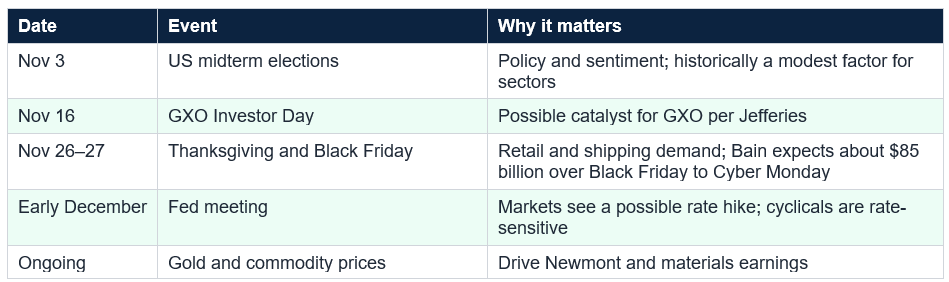
The midterm elections on November 3, GXO’s Investor Day on November 16, Black Friday and Cyber Monday (Bain expects about $85 billion of spending, roughly 9% more than last year), and the Fed’s next meeting in December, where markets see a possible rate hike after the October hold. Commodity prices, especially gold, matter for Newmont.
Table of Contents
- Why November Is Worth a Closer Look
- The Short Answer
- The Seasonality Case for Industrials and Materials
- The Backdrop Right Now
- The Four Stocks at a Glance
- The Four Stocks, One by One
- What Analyst Ratings Do and Do Not Tell You
- The Math of Sizing the Risk
- Sector Funds vs. Individual Stocks
- A Checklist and the November Calendar
- Conclusion
- Frequently Asked Questions
Why industrials and materials: 20-year average November return by sector (%)
Average November total return (%) by Kiplinger, using Select Sector SPDR ETFs as proxies; all-sector average 2.36%; *approximated for years before launch
What analysts say: ratings four November stocks (number of analysts)
Number of analyst ratings by S&P Global Market Intelligence data as of October 29, 2026
The caveat: how often analyst price targets come true (%)
% of targets met by Academic studies of different markets and periods; accuracy falls as targets get more optimistic
The math of sizing the risk: portfolio loss from four equal positions (%)
% of portfolio lost by Author's arithmetic: position size x percentage fall x four stocks; seasonality's edge is only about 1 point on average
Why November Is Worth a Closer Look
November arrives with plenty of noise: midterm elections on the 3rd, the Black Friday and Cyber Monday rush at month-end and a Fed that has just held rates while markets debate a December hike. Ignore all of that, look at what sectors have done in Novembers over the past 20 years and pick the best-rated stocks in the two that come out on top.The result is a short list: two sectors, industrials and materials, and four stocks, SPX Technologies, GXO Logistics, Smurfit Westrock and Newmont. It is a useful starting point and also easy to over-read. This guide walks through the evidence, shows what the numbers can and cannot tell you and offers a way to use the list without letting a seasonal pattern talk you into more risk than you should take.
The Short Answer
Industrials and materials have been the two best-performing sectors in November over the past 20 years, averaging 3.48% and 2.94% against 2.36% for all sectors. The four stocks are among the most favorably rated names in those sectors. That is a reason to look at them, not a reason to buy them: seasonal edges are small, analyst ratings are often wrong and each stock has its own risks. Treat the list as research ideas, keep positions small and do not expect November to behave like the average.The Seasonality Case for Industrials and Materials
Kiplinger’s table uses the Select Sector SPDR funds as proxies for each sector and shows their 20-year average total return in November. Industrials (XLI) lead at 3.48%, followed by materials (XLB) at 2.94%, financials at 2.86%, healthcare at 2.67% and consumer discretionary at 2.57%. Technology averaged only 1.96% and utilities 0.96%, while the all-sector average was 2.36%. Two sectors, communication services and real estate, launched after 2015 and 2018, so their figures are approximations.Kiplinger notes that industrials and materials rank in the top five in all Novembers, election Novembers and midterm Novembers over 20 years. That is consistent, but the size matters: the industrials advantage over the all-sector average is about 1.1 percentage points, or $112 on $10,000 by my arithmetic, and the materials advantage about 0.6 points, or $58. Those are averages across 20 Novembers, a single month can be far better or worse and patterns can fade once widely known.
20-year average November total returns of 3.48% (industrials), 2.94% (materials) and 2.36% for all sectors. The industrials edge is about 1.1 points ($112 on $10,000); the materials edge about 0.6 points ($58). *Communication services and real estate figures are approximations.
The Backdrop Right Now
The sectors enter November in decent shape. The Materials Select Sector SPDR (XLB) closed at $52.53 on October 29, with a year-to-date return of about 15.8% according to one data provider, within a 52-week range of $42.04 to $54.19, and it had returned about 18.5% over a year versus about 13.8% for the SPY. The Industrial fund (XLI) closed at $170.13 and was up more than 9% for the year in early October. Valuations differ: XLB trades at about 17.8 times forward earnings with estimated 3-to-5-year earnings growth of about 23.9%, while XLI trades at about 24.7 times with about 16.3% estimated growth.The macro picture cuts both ways. The Fed held rates at 3.75% to 4.00% on October 28 with markets still pricing a possible December hike, the 10-year Treasury yield was about 4.93% and inflation was 3.7% in September. Industrial and materials companies are cyclical, so they benefit from growth and commodity strength and suffer when borrowing costs rise or demand slows. The S&P 500 was up about 11.4% for the year as of October 23, so these sectors are not the only game in town.
The Four Stocks at a Glance
Kiplinger picked four stocks with some of the highest average broker recommendations in their sectors, using S&P Global Market Intelligence data as of October 29. I have not independently verified current prices or financials, so check each company’s latest filings.
The Four Stocks, One by One
SPX Technologies makes HVAC equipment and detection and measurement tools. Its shares are down nearly 20% this year amid weakness in small- and mid-cap industrials, yet it has 13 Buys, one Hold and no Sells. Oppenheimer’s Bryan Blair wrote in early October that its confidence in sustained HVAC growth is unchanged and that recent weakness is a buying opportunity. At about 19 times next year’s earnings and a PEG ratio of 1, Kiplinger says it looks fairly priced, though Oppenheimer thinks it deserves a premium. The risk is that a stock that has fallen for months can keep falling, and acquisition-driven growth depends on execution.GXO Logistics provides warehousing, distribution and fulfillment. All 17 analysts rate it a Buy, and Jefferies calls it misunderstood and undervalued, citing a record $2.7 billion sales pipeline and wins in aerospace and life sciences. A potential catalyst is its Investor Day on Monday, November 16. But Kiplinger also notes that GXO fell with the market in March and never recovered, even after two better-than-expected quarters. Unanimous Buys with a lagging stock is a reminder that analysts and markets can disagree for a long time.
Smurfit Westrock makes containerboard and paper-based packaging and benefits from e-commerce. All 17 analysts rate it a Buy, Truist sees the Paperworks price increase of $60 a ton on recycled paperboard as positive for the industry, and it pays a dividend yielding about 4.4%, or about $440 a year on $10,000. Its fortunes depend on packaging demand and prices, which move with the economy, and Kiplinger says a strong holiday season would help but would not be confirmed until December.
Newmont is the world’s largest gold miner and also produces copper, silver, zinc and lead. It has the largest analyst following of the four, with 19 Buys, three Holds and one Sell, and the stock is up by double digits in what Kiplinger calls roller-coaster fashion. UBS’s Daniel Major argues that buybacks and rising production per share set it apart, and that its August settlement with Barrick removed an overhang. Gold prices drive the results, so Newmont is as much a bet on the metal as on the company. It is also about 6.4% of XLB, so sector-fund holders already own it.
What Analyst Ratings Do and Do Not Tell You
Two of the four stocks have unanimous Buy ratings, which is impressive, but ratings are opinions and the record of analyst price targets is humbling. Bradshaw, Brown and Huang found only 38% of 12-month targets were met at year-end, though 64% were reached at some point. Earlier work cited by Kerl and Walter put the figure at 24%, a Danish study found 51.9% and an Indian study 63%, with achievement falling as targets grew more optimistic. A Buy from every analyst signals broad optimism, not a guarantee.There are structural reasons for caution. Ratings can lag prices, and Kiplinger’s own October screen of 30 stocks with 50% or more upside showed how a rising implied upside can mean a falling price, as with NRG Energy. And the best-rated stock is not necessarily the best-performing stock. Use ratings to find ideas worth researching, then check the company’s earnings, debt, competition and valuation yourself.
The Math of Sizing the Risk
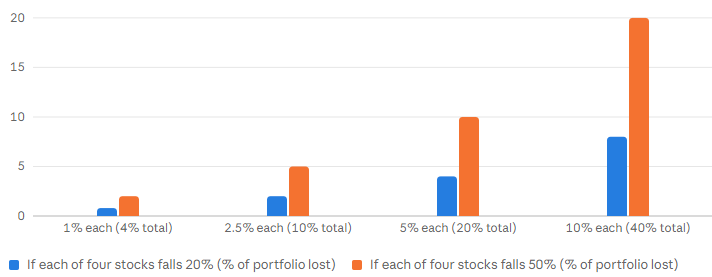
Position size decides how much a miss hurts. Suppose you put equal amounts into all four stocks and each fell 20%, about what SPXC has already done this year. At 1% of your portfolio each, you lose about 0.8% in total; at 2.5% each, about 2%; at 5% each, about 4%; at 10% each, about 8%. A 50% fall would more than double those losses. Four companies in two cyclical sectors also give less diversification than it seems, because industrials and materials often move together.Seasonality is a weak edge: about one point on average. A single position that falls 20% erases many Novembers of that advantage. Size positions so that a bad outcome would not change your plans.
Sector Funds vs. Individual Stocks
If the idea you like is the sector, a fund captures it with less single-company risk. The Industrial Select Sector SPDR (XLI) and Materials Select Sector SPDR (XLB) each charge 0.08%, according to data providers, and hold dozens of large companies. XLB already includes Newmont at about 6.4%. The trade-off is that a fund gives up the chance to beat the sector with a few good stock picks, and you should check its holdings, since only Newmont is confirmed in these funds.A broad index fund is the other alternative, and it has beaten most active managers: S&P Dow Jones Indices found 79% of active large-cap funds trailed the S&P 500 in 2025. Many investors keep most of their money in broad funds and use a small slice, perhaps 5% to 10%, for ideas like these.
A Checklist and the November Calendar
Before buying any of these, ask six questions. Why is the stock where it is, and what do the bears say? Is the company profitable, with manageable debt? How is it valued versus peers and its own history? What would make you sell, and at what loss? How large is the position? And what is your time horizon, since November seasonality says nothing about next year? If you cannot answer them, you are not ready to buy.Pick at most one or two names that you can explain in a sentence, set a position size you could lose without changing your plans, write down your reason for buying and your exit rule, and revisit it in December.
Conclusion
Kiplinger’s November list rests on a simple observation: over 20 years, industrials and materials have been the best-performing sectors in November, averaging 3.48% and 2.94% versus 2.36% for all sectors, and have ranked in the top five in every kind of November. Four stocks, SPX Technologies, GXO Logistics, Smurfit Westrock and Newmont, carry some of the highest analyst ratings in those sectors. That is enough to deserve research, though not enough to deserve your confidence.The edge from seasonality is about one point on average, and analyst targets are met only about a quarter to two-thirds of the time. The stocks are cyclical, one is down nearly 20% this year, another has lagged despite unanimous Buys and one depends on gold. Keep positions small, diversify, compare the idea with a plain index fund and let your own plan, not the calendar, drive the decision. A qualified adviser can help you decide what fits.
Frequently Asked Questions
Which sectors have historically done best in November?Over the past 20 years, industrials (XLI) have averaged a 3.48% total return in November and materials (XLB) 2.94%, the best two of the eleven sectors, versus an all-sector average of 2.36%, according to Kiplinger. Technology averaged 1.96% and utilities just 0.96%. These are historical averages, not forecasts, and the average month hides large variation.
Which four stocks does Kiplinger pick for November?
SPX Technologies (SPXC) and GXO Logistics (GXO) in industrials, and Smurfit Westrock (SW) and Newmont (NEM) in materials. Kiplinger chose names with some of the highest analyst ratings in their sectors, based on S&P Global Market Intelligence data as of October 29. These are examples drawn from analyst ratings, not recommendations from me.
Are unanimous analyst Buy ratings a good sign?
They show strong conviction, but not certainty. Academic studies find that only about 24% to 64% of 12-month analyst price targets are ever met, and accuracy falls as targets get more optimistic. GXO and Smurfit Westrock each have 17 ratings, all Buys, but GXO has struggled all year despite beating earnings expectations.
Should I buy individual stocks or a sector ETF?
An ETF spreads risk across dozens of companies; the Industrial Select Sector SPDR (XLI) and Materials Select Sector SPDR (XLB) each charge 0.08%, according to a data provider. Newmont is already about 6.4% of XLB. Individual stocks can outperform but carry company-specific risk, so keep each position small. This is general education, not personal advice.
What events could move these stocks in November?
The midterm elections on November 3, GXO’s Investor Day on November 16, Black Friday and Cyber Monday (Bain expects about $85 billion of spending, roughly 9% more than last year), and the Fed’s next meeting in December, where markets see a possible rate hike after the October hold. Commodity prices, especially gold, matter for Newmont.
0 Comments
Be the first to share your thoughts on this article.