
Investing
Dividend Kings: 50-Year Dividend Stocks, Yields & Risks

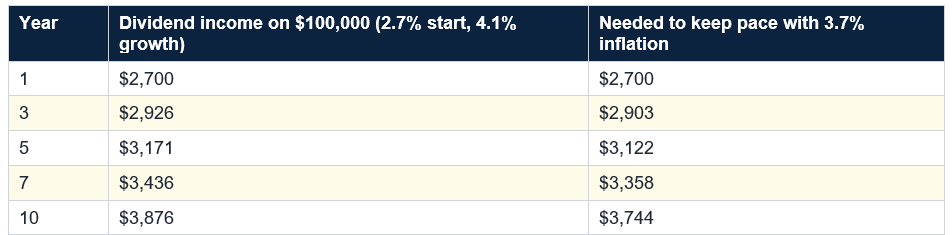
lists range from about 29 to 60 Kings (54 per Dividend Power; 57 per several sites); average yield about 2.4%–2.7%; average P/E about 24.5; longest streak 71 years (American States Water); no King cut its dividend during COVID-19 (Dividend Power). Performance (Aristocrats index, mid-2026): about 10.1% a year over 10 years vs 15.3% for the S&P 500; 1-year +13.9% vs +26.4%; about 3% technology vs over 20% in the S&P 500. One analyst had NOBL +12.9% vs SPY +7.88% year to date through July. Examples: American States Water 71 years (2.65% yield); Cincinnati Financial 65 (2.30%); California Water 59 (2.92%); Altria 56 (6.20% yield but 93.67% payout); PepsiCo 54th increase; S&P Global 53. My arithmetic: $100,000 at a 2.7% yield with 4.1% yearly dividend growth pays $2,700 in year 1 and about $3,876 in year 10 (3.88% yield on cost), about $132 ahead of 3.7% inflation; it passes today’s 4.46% T-bill income in about year 14.
But the title is easy to over-read. A long streak signals a durable business and a disciplined board, not a guarantee. This guide explains what Dividend Kings are, why even their number is disputed, who is on the list, how the group has performed and what to check before you buy, using 2026 data and flagging where sources disagree.
Even a single stock can be counted differently: MarketBeat shows Lowe’s with 53 years of increases while another list shows 63. Check the company’s own investor relations page before relying on a list, and treat any exact count as approximate. The group is small either way, about 0.9% of listed companies according to Dividend Power.
Counts of Dividend Kings in 2026 range from 29 to 60 depending on the source. Longest streak: American States Water at 71 years. Average yield: about 2.4%–2.7%. Dividend Power: no King cut its dividend during COVID-19.
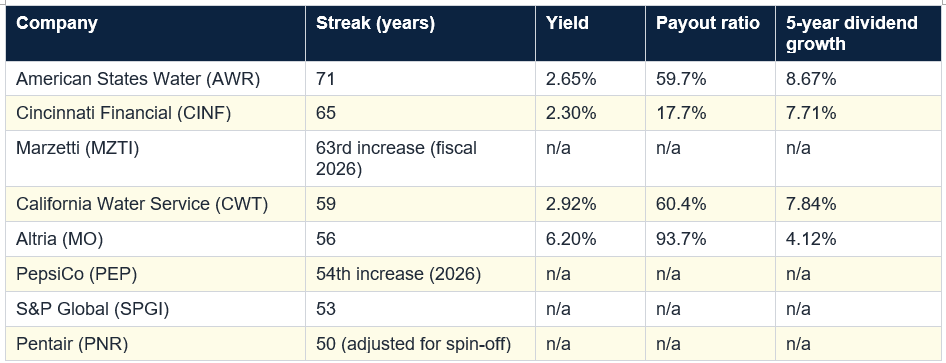
Yields and payout ratios are from MarketBeat’s listing on one day, and not every company’s figures were in my sources. Treat the table as an illustration, not a shopping list.
The resilience claim is the main attraction: Dividend Power notes that no Dividend King cut its dividend during COVID-19. But the yield is modest next to cash, since a 52-week Treasury bill paid about 4.46% in October. Kings are not a cash substitute. They are a bet that growing income plus modest share-price growth will beat inflation over the long run.
But leadership rotates. ProShares says the Aristocrats have outperformed since November 2025, and one analyst reported NOBL up 12.9% year to date through July versus 7.88% for SPY. Since then the S&P 500 had climbed to about 11.4% for the year by October 23, so the lead may have narrowed. Since inception, NOBL has compounded about 10.38% a year to March 2026, a good result even if it trails the tech-led market. The pattern: dividend growers tend to lag in tech rallies and hold up better in downturns.
Dividend Aristocrats vs S&P 500 (mid-2026): 10-year about 10.1% a year vs 15.3%; 1-year +13.9% vs +26.4%; technology about 3% vs over 20%. On $10,000 over ten years: about $26,300 vs about $41,700 (my arithmetic). Kings are not an index, so Aristocrat data are a proxy.
There is a catch. A T-bill at 4.46% pays $4,460 on $100,000 today, and the King’s income would not pass that until about year 14, if growth holds. The T-bill’s income is fixed and its principal does not grow, whereas the King’s income rises and its share price can appreciate, with risk. An S&P 500 fund at a 1.0% yield pays only about $1,000. The point of Kings is the growth, not the starting yield.
Other risks are subtler. Sector concentration: Kings lean toward utilities, staples and industrials, which can lag when growth stocks lead. Valuation: an average P/E of 24.5 means paying a full price for stability. Interest rates: with 10-year Treasuries near 5.2% and T-bills at 4.46%, safe alternatives compete with a 2.6% yield. And taxes: qualified dividends are generally taxed at 0%, 15% or 20% federally, with a possible 3.8% surcharge for higher earners.
Keep in mind: Dividend growth does not guarantee a rising share price. A company can keep raising a dividend by a penny a year while its stock stagnates or falls. Judge the whole business, not just the streak.
Sixth, the business itself: is demand durable, does it have pricing power and could technology or regulation disrupt it? A water utility and a tobacco company have very different long-term risks, even with similar streaks. Use the streak as a starting filter, then do the work, and diversify.
Whichever route you choose, check the holdings, fees, sector mix and yield. Holding dividend payers in an IRA can shelter the tax on distributions, and it is worth comparing any dividend strategy with a plain broad index fund, which has beaten most alternatives over the past decade.
Use Kings as one tool, not a religion. Check payout ratios and cash flow, avoid chasing the highest yields, diversify across sectors and remember that a long streak is a track record, not a promise. If you want income that grows, they are a sensible place to look. If you want certainty, a Treasury or CD may be a better fit. This is general education, not personalized advice, and a qualified adviser can help you decide.
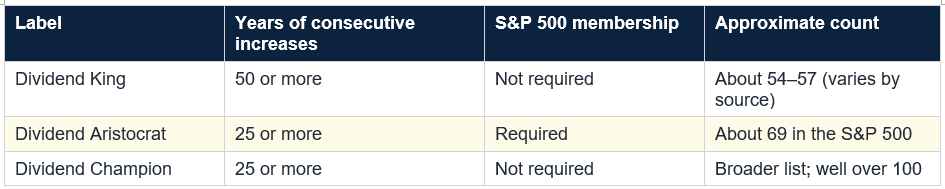
A Dividend King is a US-listed company that has raised its dividend every year for at least 50 consecutive years. Unlike Dividend Aristocrats, which need 25 years of increases and S&P 500 membership, Kings have no index requirement, so smaller utilities and industrial companies can qualify. There is no official Dividend Kings index, so lists differ by source.
How many Dividend Kings are there?
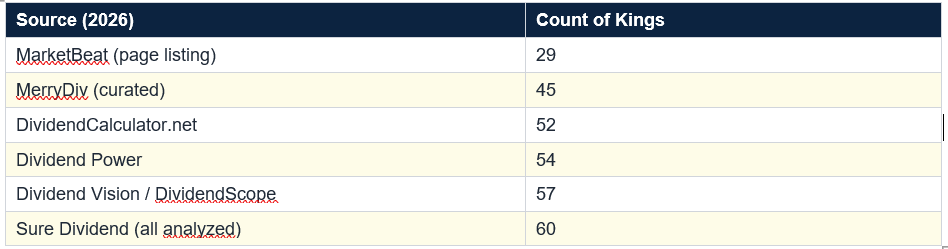
It depends on who is counting. Recent 2026 lists range from about 29 to 60 companies: Dividend Power counts 54, several sites count 57 and Sure Dividend analyzes 60. The differences come from methodology, such as how spin-offs, mergers and data gaps are handled, and from whether a list is complete or a curated subset.
Are Dividend Kings safe investments?
They are among the most durable dividend payers, but not risk-free. A streak shows resilience, not that a dividend is safe today. Altria, for example, has raised its dividend for 56 years but pays out about 94% of earnings. Kings can lose the title after a dividend cut, as Telephone and Data Systems and Leggett & Platt reportedly did in 2024, and their shares can fall like any stock.
Do Dividend Kings beat the S&P 500?
Not recently over long stretches. The related S&P 500 Dividend Aristocrats index returned about 10.1% a year over ten years versus about 15.3% for the S&P 500, largely because it holds little technology. Dividend growers have led at times in 2026, with one analyst showing NOBL up 12.9% versus 7.88% for SPY through July, but leadership rotates.
How can I invest in Dividend Kings?
You can buy individual stocks, which requires research and diversification, or use dividend-growth ETFs such as NOBL (0.35%), VIG or SDY, which hold Aristocrats or similar dividend growers rather than a pure Kings list. Check the holdings, fees, yield and sector mix before buying. This is general education, not personal advice.
Table of Contents
- Why Dividend Kings Capture the Imagination
- The Short Answer
- What Exactly Is a Dividend King?
- How Many Kings Are There? It Depends
- Meet Some of the Kings
- What the Numbers Say
- Kings vs. the Market
- The Income Math
- What Can Go Wrong
- How to Evaluate a King: A Six-Point Checklist
- Ways to Invest
- Who Kings Suit, and Who They Do Not
- Conclusion
- Frequently Asked Questions
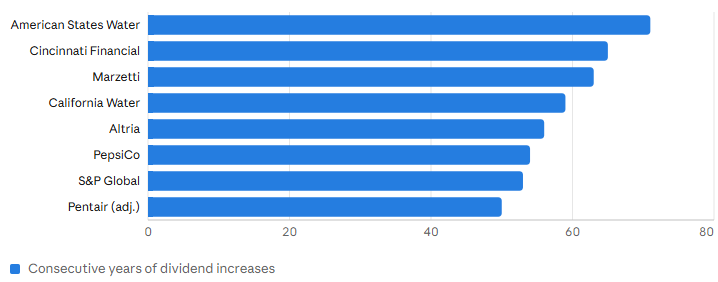
Meet some Dividend Kings: length of dividend-increase streaks (years)
Years of consecutive increases by Sure Dividend (Oct 1, 2026) and MarketBeat; streaks as reported; Pentair adjusted for the nVent spin-off
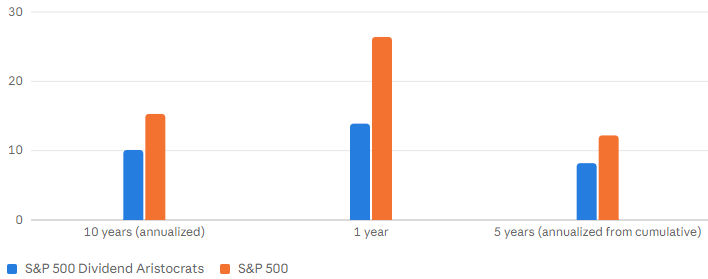
Dividend growers vs. the S&P 500 (mid-2026): annualized total return (%)
Total return (%) by Walnut Invest / Sure Dividend; Aristocrats index is a proxy (no official Kings index); 5-year annualized by my arithmetic
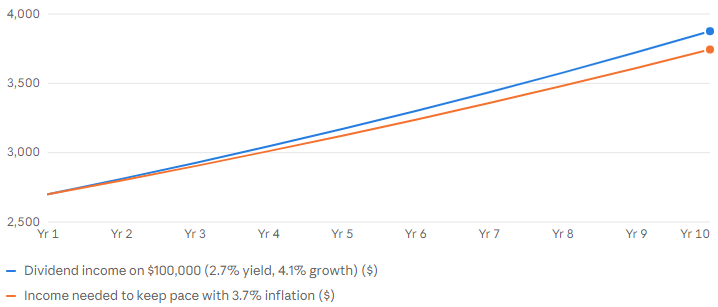
The income math: growing dividends vs. inflation over 10 years ($ a year)
Annual dividend income ($) by Author's illustration; the dividend stays about $132 ahead of inflation by year 10 (3.88% yield on cost)
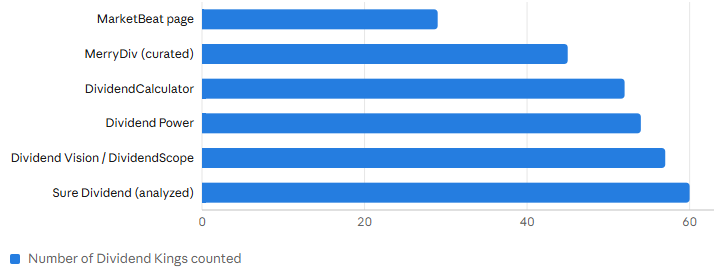
How many Dividend Kings are there? It depends on who counts (2026)
Companies counted by No official Kings index exists; counts differ by methodology, spin-off adjustments and coverage
Why Dividend Kings Capture the Imagination
Imagine a company that has given its shareholders a raise every year since the 1970s or earlier. Through oil shocks, recessions, the dot-com bust, 2008 and a pandemic, the check kept growing. That is a Dividend King, and the idea has a powerful pull, especially in a year when inflation is 3.7% and markets feel jumpy.But the title is easy to over-read. A long streak signals a durable business and a disciplined board, not a guarantee. This guide explains what Dividend Kings are, why even their number is disputed, who is on the list, how the group has performed and what to check before you buy, using 2026 data and flagging where sources disagree.
The Short Answer
Dividend Kings are companies that have raised their dividend for at least 50 consecutive years. They tend to be steady, mature businesses in utilities, consumer staples, industrials and insurance, with average yields around 2.4% to 2.7%. They suit reliable, growing income. But they have lagged the tech-driven market over the past decade, they are not immune to dividend cuts and the list varies from about 29 to 60 names depending on who counts.What Exactly Is a Dividend King?
A Dividend King is a US company that has increased its annual dividend for at least 50 consecutive years, double the 25 years needed for a Dividend Aristocrat. Aristocrats must also belong to the S&P 500, while Kings need no index membership, so smaller names such as water utilities qualify. There is no official Dividend Kings index, which is why websites publish different lists.
How Many Kings Are There? It Depends
Ask five websites and you get five answers: 29 on one MarketBeat page, 45 on a curated list, 52, 54 at Dividend Power, 57 on several sites and 60 analyzed at Sure Dividend. The differences are not random. Some lists are subsets, some adjust streaks for spin-offs (Sure Dividend counts Pentair’s 50 years adjusted for the nVent spin-off) and some flag discrepancies in how companies report their history, as Dividend Power does with Sysco.Even a single stock can be counted differently: MarketBeat shows Lowe’s with 53 years of increases while another list shows 63. Check the company’s own investor relations page before relying on a list, and treat any exact count as approximate. The group is small either way, about 0.9% of listed companies according to Dividend Power.
Counts of Dividend Kings in 2026 range from 29 to 60 depending on the source. Longest streak: American States Water at 71 years. Average yield: about 2.4%–2.7%. Dividend Power: no King cut its dividend during COVID-19.
Meet Some of the Kings
The roster is a tour of unglamorous excellence. American States Water, a water utility, has the longest streak at 71 years. Cincinnati Financial, an insurer, has 65 years and a payout ratio of only about 18%. Marzetti, the maker of dressings and bakery products, raised its dividend for the 63rd year in fiscal 2026. California Water Service has 59 years, Altria 56, PepsiCo marked its 54th increase in 2026 and S&P Global has 53. Procter & Gamble, Emerson, Dover, Parker-Hannifin and Genuine Parts are often cited near the top of lists.Yields and payout ratios are from MarketBeat’s listing on one day, and not every company’s figures were in my sources. Treat the table as an illustration, not a shopping list.
What the Numbers Say
As a group, Kings pay more than the market but not spectacularly: an average yield of about 2.4% to 2.7% against about 1.0% for the S&P 500, according to Fidelity. Dividend Power puts their average P/E at 24.5, which is not cheap. Dividend growth is steady rather than explosive: one analyst puts average growth among Aristocrats at 4.10% in 2026, with 5-year growth for the examples above from about 4% to nearly 9%.The resilience claim is the main attraction: Dividend Power notes that no Dividend King cut its dividend during COVID-19. But the yield is modest next to cash, since a 52-week Treasury bill paid about 4.46% in October. Kings are not a cash substitute. They are a bet that growing income plus modest share-price growth will beat inflation over the long run.
Kings vs. the Market
Here the story gets less flattering. With no official Kings index, the best data are for the S&P 500 Dividend Aristocrats, a closely related group. Through mid-2026 the index returned about 10.1% a year over ten years versus about 15.3% for the S&P 500, and about 13.9% versus 26.4% over the last year, according to Walnut Invest. The reason: the S&P 500 is more than 20% technology, while Aristocrats hold only about 3%, because most tech giants are too young to have long dividend streaks.But leadership rotates. ProShares says the Aristocrats have outperformed since November 2025, and one analyst reported NOBL up 12.9% year to date through July versus 7.88% for SPY. Since then the S&P 500 had climbed to about 11.4% for the year by October 23, so the lead may have narrowed. Since inception, NOBL has compounded about 10.38% a year to March 2026, a good result even if it trails the tech-led market. The pattern: dividend growers tend to lag in tech rallies and hold up better in downturns.
Dividend Aristocrats vs S&P 500 (mid-2026): 10-year about 10.1% a year vs 15.3%; 1-year +13.9% vs +26.4%; technology about 3% vs over 20%. On $10,000 over ten years: about $26,300 vs about $41,700 (my arithmetic). Kings are not an index, so Aristocrat data are a proxy.
The Income Math
In my own illustration, $100,000 invested at a 2.7% yield, the middle of the range, with dividends growing 4.1% a year, pays $2,700 in year one. By year ten the payout reaches about $3,876, a 3.88% yield on cost, and total dividends over the decade add up to about $32,600. Keeping pace with 3.7% inflation would require about $3,744 by year ten, so the dividend stays about $132 ahead.There is a catch. A T-bill at 4.46% pays $4,460 on $100,000 today, and the King’s income would not pass that until about year 14, if growth holds. The T-bill’s income is fixed and its principal does not grow, whereas the King’s income rises and its share price can appreciate, with risk. An S&P 500 fund at a 1.0% yield pays only about $1,000. The point of Kings is the growth, not the starting yield.
What Can Go Wrong
The first risk is mistaking a streak for safety. A 56-year streak at Altria sounds bulletproof, but its payout is about 93.7% of earnings and its yield 6.20%, which leaves little cushion and suggests the market sees risk. A high yield is often a warning, not a prize. Kings can also lose the title: Telephone and Data Systems and Leggett & Platt were reportedly removed in 2024 after cutting dividends, according to one source.Other risks are subtler. Sector concentration: Kings lean toward utilities, staples and industrials, which can lag when growth stocks lead. Valuation: an average P/E of 24.5 means paying a full price for stability. Interest rates: with 10-year Treasuries near 5.2% and T-bills at 4.46%, safe alternatives compete with a 2.6% yield. And taxes: qualified dividends are generally taxed at 0%, 15% or 20% federally, with a possible 3.8% surcharge for higher earners.
Keep in mind: Dividend growth does not guarantee a rising share price. A company can keep raising a dividend by a penny a year while its stock stagnates or falls. Judge the whole business, not just the streak.
How to Evaluate a King: A Six-Point Checklist
Before buying any King, check six things. First, the payout ratio: a low ratio, like Cincinnati Financial’s 18%, leaves room to keep raising, while one near 100% is a warning. Second, free cash flow coverage, since dividends are paid in cash, not earnings. Third, debt and interest costs. Fourth, the pace of dividend growth, because tiny increases may not beat inflation. Fifth, valuation relative to history.Sixth, the business itself: is demand durable, does it have pricing power and could technology or regulation disrupt it? A water utility and a tobacco company have very different long-term risks, even with similar streaks. Use the streak as a starting filter, then do the work, and diversify.
Ways to Invest
You can buy individual Kings, which gives you control but requires research and diversification across sectors. Or you can use funds. There is no mainstream pure Kings ETF in the sources I reviewed, but dividend-growth ETFs offer related exposure. ProShares’ NOBL tracks the S&P 500 Dividend Aristocrats, charges 0.35% and yields about 2.03%. Vanguard’s VIG, with about $88 billion, and the SPDR S&P Dividend ETF, SDY, with about $20 billion, hold broader dividend growers, though ETF Trends notes VIG behaves much like the S&P 500.Whichever route you choose, check the holdings, fees, sector mix and yield. Holding dividend payers in an IRA can shelter the tax on distributions, and it is worth comparing any dividend strategy with a plain broad index fund, which has beaten most alternatives over the past decade.
Who Kings Suit, and Who They Do Not
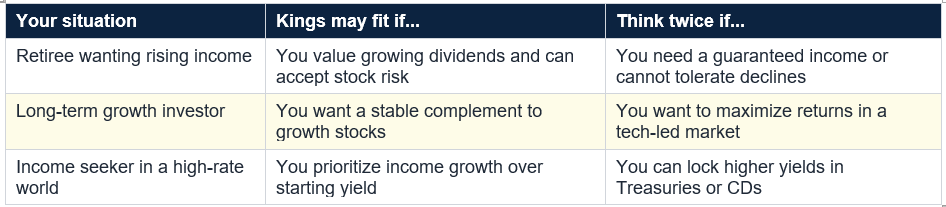
Kings tend to suit conservative and income-oriented investors, retirees who want a rising income stream and anyone who values stability over speed. They can also work as ballast alongside growth holdings. They are less suited to investors who need maximum growth, those who need high current income right now or anyone tempted to treat a long streak as a guarantee.
Conclusion
Dividend Kings are a remarkable club: companies that have raised dividends for 50 years or more, with average yields of about 2.4% to 2.7% and no cuts during COVID-19. They offer durability, rising income and a calming presence in a portfolio. But the club has fuzzy edges, with counts from 29 to 60, and it has lagged the S&P 500 over the past decade, about 10.1% versus 15.3% a year for the related Aristocrats, mostly because of technology.Use Kings as one tool, not a religion. Check payout ratios and cash flow, avoid chasing the highest yields, diversify across sectors and remember that a long streak is a track record, not a promise. If you want income that grows, they are a sensible place to look. If you want certainty, a Treasury or CD may be a better fit. This is general education, not personalized advice, and a qualified adviser can help you decide.
Frequently Asked Questions
What is a Dividend King?A Dividend King is a US-listed company that has raised its dividend every year for at least 50 consecutive years. Unlike Dividend Aristocrats, which need 25 years of increases and S&P 500 membership, Kings have no index requirement, so smaller utilities and industrial companies can qualify. There is no official Dividend Kings index, so lists differ by source.
How many Dividend Kings are there?
It depends on who is counting. Recent 2026 lists range from about 29 to 60 companies: Dividend Power counts 54, several sites count 57 and Sure Dividend analyzes 60. The differences come from methodology, such as how spin-offs, mergers and data gaps are handled, and from whether a list is complete or a curated subset.
Are Dividend Kings safe investments?
They are among the most durable dividend payers, but not risk-free. A streak shows resilience, not that a dividend is safe today. Altria, for example, has raised its dividend for 56 years but pays out about 94% of earnings. Kings can lose the title after a dividend cut, as Telephone and Data Systems and Leggett & Platt reportedly did in 2024, and their shares can fall like any stock.
Do Dividend Kings beat the S&P 500?
Not recently over long stretches. The related S&P 500 Dividend Aristocrats index returned about 10.1% a year over ten years versus about 15.3% for the S&P 500, largely because it holds little technology. Dividend growers have led at times in 2026, with one analyst showing NOBL up 12.9% versus 7.88% for SPY through July, but leadership rotates.
How can I invest in Dividend Kings?
You can buy individual stocks, which requires research and diversification, or use dividend-growth ETFs such as NOBL (0.35%), VIG or SDY, which hold Aristocrats or similar dividend growers rather than a pure Kings list. Check the holdings, fees, yield and sector mix before buying. This is general education, not personal advice.
0 Comments
Be the first to share your thoughts on this article.