

Investing
Stocks That Could Rally 50% or More: Look Before You Buy!

S&P Global Market Intelligence): 30 S&P 500 stocks with at least 50% implied upside; top rows NRG Energy (target $177; 85%; Buy 1.50) and Jabil ($425; 50%; Strong Buy 1.40); S&P 500 forward P/E 18.5 vs 23.5 at the end of last year. My arithmetic: NRG’s implied price fell from about $130.37 (June) to $120.61 (August) to $95.68 (October), down about 26.6%, while its target slipped about 11.3%; Jabil’s implied price fell about 12.2% from August to October. Accuracy research: only 38% of 12-month targets met at year-end but 64% at some point (Bradshaw, Brown and Huang); 24% in earlier work; about 52% in a Danish sample; 63% in an Indian one; implied returns exceed actual by about 15% on average. Recovery math: a stock that falls 20% needs +25% to recover; 33% needs +49%; 50% needs +100%. The 52-week T-bill pays about 4.46%; inflation 3.7%.
It is a useful list, but easy to misread: the numbers are opinions, not promises, and the biggest often belong to the most troubled stocks. This guide explains how the screen works, what I could and could not verify and how to treat a list like this as a place to start research, not a place to start buying.
A transparency note: I could retrieve only the top rows of the October 27 table, so I will not claim to know all 30 names or their figures. The article’s tags include companies such as Oracle, Micron, Broadcom, Nvidia, Boeing, Wynn Resorts, First Solar, Booking Holdings and DoorDash, but tags do not show who made the list or how much upside they carry. For the full table, go to the source. I can, however, use fully retrieved earlier editions of the screen to show how these lists behave.

S&P Global Market Intelligence, October 27, 2026: 30 S&P 500 stocks with at least 50% implied upside; NRG $177 target (85% upside); Jabil $425 (50%); S&P 500 forward P/E 18.5, down from 23.5 at the end of last year.
Notice what upside does not tell you: whether the target is realistic. A target is only as good as the earnings forecasts and valuation assumptions behind it. Kiplinger itself cautions that price targets are a blunt tool, that committing capital based on one data point is not an investment process and that the stocks with the most upside do not necessarily get consensus Buy ratings from the same analysts.
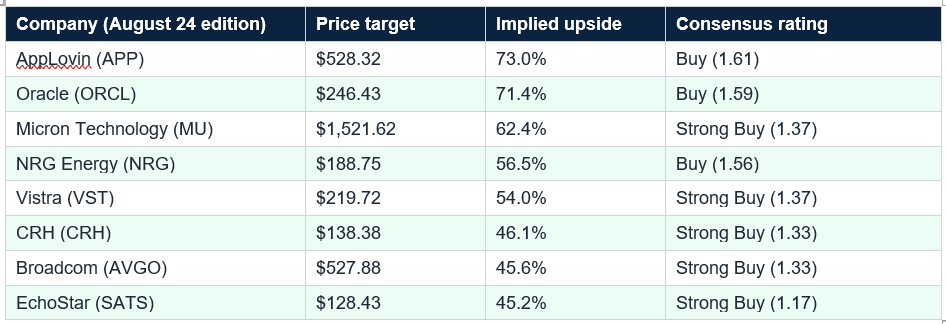
Two patterns jump out: NRG, Vistra and Trimble appeared in both the June and August editions, and the lists tilt toward whatever the market is debating, in 2026 artificial intelligence hardware and the power to run it.
That is the heart of the matter. A rising implied upside is not always better value; sometimes the stock is simply getting cheaper for a reason. Jabil shows the same effect on a smaller scale: from August to October its implied price fell about 12% while its target fell about 4%, lifting its upside from 36.8% to 50%. A bargain that keeps getting cheaper can be an opportunity or a falling knife, and the screen cannot tell you which.

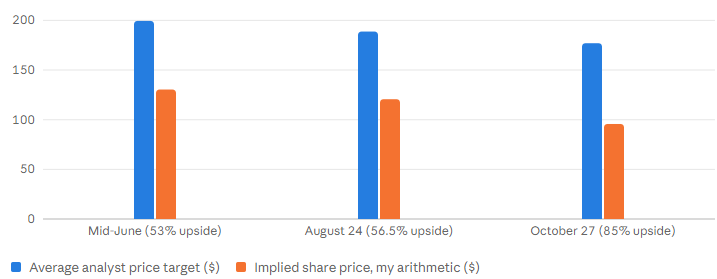
NRG Energy: implied upside 53% (June), 56.5% (August), 85% (October). Implied price about $130, $121, $96, down about 27%; target $199.47 to $177, down about 11%. Jabil: implied price down about 12% from August to October.
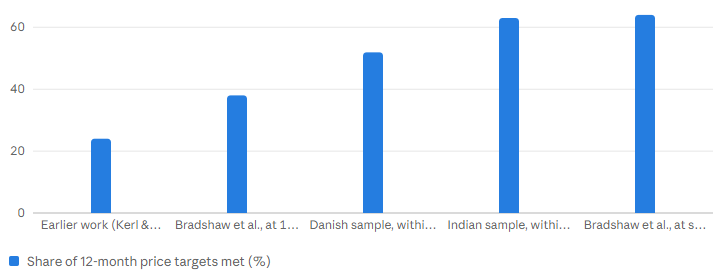
The research agrees with the instinct to be careful. A Danish study found targets were achieved within 12 months only 51.9% of the time, and a study of Indian markets found the achievement rate fell as predictions grew more optimistic. Kerl and Walter found that targets that deviate sharply from the current price, which is what a 50% upside target is, tend to be less accurate. The bigger the promise, the lower the odds of keeping it.
Put simply, targets are directionally useful but overstated. If a typical target overstates returns by 15 points, a 50% implied upside might be closer to 35% on average, with a wide spread. Treat targets as a rough ranking, not a forecast, and expect many of the 30 to disappoint even if a few do spectacularly well.


Position size decides whether a miss is a scratch or a wound. If you put 2% of your portfolio into a stock that falls 50%, you lose 1% of the portfolio; put 20% into it, and you lose 10%.
Valuation sources differ: Kiplinger cites a forward P/E of 18.5 from Yardeni Research, while another October source put it near 20. A screen that finds stocks at a discount to analysts’ targets is not the same as one that finds stocks at a discount to their true worth.
Fifth, size small and diversify across industries so you do not bet on one theme. Sixth, set a rule in advance for what would make you sell, and write down why you bought. Seventh, remember the alternative: 79% of active large-cap funds trailed the S&P 500 in 2025 (S&P Dow Jones Indices), and Bessembinder found that about 4.3% of stocks created all the market’s net wealth, an argument for owning many.
Pick no more than two or three names from any screen, write a one-paragraph reason you would own each, and cap each position at a size you could lose without changing your plans. If you cannot write the reason, you do not yet know enough to buy.
Use the list the way a prospector uses a metal detector: it beeps near interesting ground, but it does not tell you whether you have found gold or a bottle cap. Do the research, keep positions small, diversify and compare any idea with a plain index fund. A qualified adviser can help you decide what fits your situation.
It is the percentage gain needed for a stock to reach analysts’ average price target, calculated as the target divided by the current price, minus one. If the target is $177 and the implied upside is 85%, the current price is about $95.70. It is a measure of what analysts expect, not of what will happen.
Are these 30 stocks buy recommendations?
No. The list is a screen ranking S&P 500 stocks by the gap between price and analysts’ average target. Kiplinger itself warns that price targets are a blunt tool and that committing money on a single data point is not an investment process.
How often do analyst price targets come true?
Less often than headlines suggest. Bradshaw, Brown and Huang found only 38% of 12-month targets were met at year-end, though 64% were reached at some point. Other studies put it at 24%, about 52% (Danish sample) and 63% (Indian sample), with accuracy falling as targets get more optimistic.
Why would a stock have 50% upside?
Usually because its price has fallen, because analysts expect earnings to grow quickly or both. NRG Energy’s implied upside rose from about 53% in June to 85% in October mainly because its price fell about 27% by my arithmetic while its target slipped about 11%.
How should I use a list like this?
As a starting point for research, not a shopping list: check why the stock is cheap, read the results, keep each position small and diversify. A broad index fund is a reasonable alternative. This is general education, not personal advice.
Table of Contents
- The Headline That Stops You Scrolling
- The Short Answer
- What the Screen Actually Found
- How to Read the Numbers
- What These Lists Look Like Over Time
- The NRG Energy Lesson
- Where the Upside Clusters
- Why Big Upside Can Be a Warning
- What the Research Says About Price Targets
- The Math of Recovering From a Fall
- The Backdrop: Rates, Inflation and Valuation
- A Practical Checklist for Using a List Like This
- Conclusion
- Frequently Asked Questions
The NRG Energy lesson: target vs. implied price across three Kiplinger screens ($)
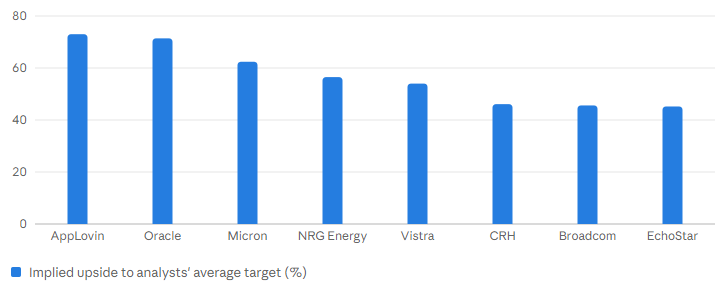
What these lists look like: top implied upside, Kiplinger's August 24 edition (%)
How often analyst price targets come true: studies of 12-month targets (%)
% of targets met by Different markets, periods and definitions; accuracy falls as targets get more optimisticThe Headline That Stops You Scrolling
Thirty stocks that could rally 50% or more. It is the kind of headline that makes you stop. Kiplinger’s latest screen of S&P 500 stocks, based on analysts’ average price targets and S&P Global Market Intelligence data as of October 27, found exactly that many: 30 companies with at least 50% implied upside over the next 12 months or so.It is a useful list, but easy to misread: the numbers are opinions, not promises, and the biggest often belong to the most troubled stocks. This guide explains how the screen works, what I could and could not verify and how to treat a list like this as a place to start research, not a place to start buying.
The Short Answer
The list shows where Wall Street analysts see the biggest gap between today’s price and where they think a stock should trade in a year. A large gap can mean a bargain, because the price has fallen more than the business has weakened, or a trap, because the market may be pricing in problems analysts have not. Academic studies suggest only about 24% to 64% of 12-month targets are ever met, with accuracy falling as targets get more optimistic. Use the list to find ideas, then do your own homework.What the Screen Actually Found
Kiplinger’s Dan Burrows screened the S&P 500 by implied upside to analysts’ average price targets; all 30 stocks clear a 50% bar. The top row is NRG Energy, with a $177 average target, 85% implied upside and a consensus rating score of 1.50 (Buy). Next is Jabil, with a $425 target, 50% upside and a score of 1.40 (Strong Buy). The article also notes the S&P 500’s forward price-to-earnings ratio is 18.5, according to Yardeni Research, down from 23.5 at the end of last year and below its 10-year average.A transparency note: I could retrieve only the top rows of the October 27 table, so I will not claim to know all 30 names or their figures. The article’s tags include companies such as Oracle, Micron, Broadcom, Nvidia, Boeing, Wynn Resorts, First Solar, Booking Holdings and DoorDash, but tags do not show who made the list or how much upside they carry. For the full table, go to the source. I can, however, use fully retrieved earlier editions of the screen to show how these lists behave.
S&P Global Market Intelligence, October 27, 2026: 30 S&P 500 stocks with at least 50% implied upside; NRG $177 target (85% upside); Jabil $425 (50%); S&P 500 forward P/E 18.5, down from 23.5 at the end of last year.
How to Read the Numbers
Three terms matter. The price target is the average of analysts’ 12-month price forecasts. The implied upside is the target divided by the current price, minus one. And the consensus rating score runs from 1 (Strong Buy) to 5 (Strong Sell). A little algebra recovers the current price: NRG’s $177 target with 85% upside implies about $95.70, and Jabil’s $425 target with 50% upside about $283. Those are my calculations, not quoted prices.Notice what upside does not tell you: whether the target is realistic. A target is only as good as the earnings forecasts and valuation assumptions behind it. Kiplinger itself cautions that price targets are a blunt tool, that committing capital based on one data point is not an investment process and that the stocks with the most upside do not necessarily get consensus Buy ratings from the same analysts.
What These Lists Look Like Over Time
Kiplinger runs this screen regularly, so we can see how it changes. The August 24 version covered 33 stocks with at least 33% upside, led by AppLovin (73.0%), Oracle (71.4%), Micron (62.4%), NRG Energy (56.5%) and Vistra (54.0%). About 15 of the 33 names, by my classification, were semiconductor or AI-hardware companies. An earlier version, from about mid-June, listed 25 stocks with at least 45% upside, led by Charter Communications at 80% with a Hold rating, then Intuit at 67%, Trimble at 61%, Boston Scientific at 60% and DoorDash at 58%.Two patterns jump out: NRG, Vistra and Trimble appeared in both the June and August editions, and the lists tilt toward whatever the market is debating, in 2026 artificial intelligence hardware and the power to run it.
The NRG Energy Lesson
NRG Energy is the best case study because it appears in three editions. In mid-June it showed 53% implied upside on a $199.47 target; in August, 56.5% on $188.75; by October 27, 85% on $177. Working backward, the implied share price went from about $130 to about $121 to about $96, a fall of roughly 27%, while analysts trimmed their target by about 11%. The upside got bigger because the price fell faster than the target.That is the heart of the matter. A rising implied upside is not always better value; sometimes the stock is simply getting cheaper for a reason. Jabil shows the same effect on a smaller scale: from August to October its implied price fell about 12% while its target fell about 4%, lifting its upside from 36.8% to 50%. A bargain that keeps getting cheaper can be an opportunity or a falling knife, and the screen cannot tell you which.
NRG Energy: implied upside 53% (June), 56.5% (August), 85% (October). Implied price about $130, $121, $96, down about 27%; target $199.47 to $177, down about 11%. Jabil: implied price down about 12% from August to October.
Where the Upside Clusters
In the earlier editions the pattern is clear. Upside concentrates in themes: AI hardware and semiconductors, power generators that serve data centers, software names that have sold off and a few consumer or travel companies. That concentration is itself a risk: buy ten of the “most upside” stocks and you may own one bet ten times, such as the AI buildout, rather than ten independent ideas. Always ask how a stock got where it is.Why Big Upside Can Be a Warning
Big implied upside usually means one of three things: the business is growing fast and analysts are modeling it; the stock has fallen and analysts have not cut their numbers as fast as the price; or the targets are too optimistic. Charter Communications is a cautionary example. A December 2025 article flagged it as a stock that could soar 49% in 2026; by mid-June it appeared with 80% implied upside and only a Hold consensus, which suggests the price fell further while targets stayed high.The research agrees with the instinct to be careful. A Danish study found targets were achieved within 12 months only 51.9% of the time, and a study of Indian markets found the achievement rate fell as predictions grew more optimistic. Kerl and Walter found that targets that deviate sharply from the current price, which is what a 50% upside target is, tend to be less accurate. The bigger the promise, the lower the odds of keeping it.
What the Research Says About Price Targets
Bradshaw, Brown and Huang found that only 38% of 12-month price targets were met at the end of the year, though 64% were reached at some point during it. A summary of their work adds that implied target-based returns exceeded actual returns by about 15% on average and that absolute target errors averaged about 45%. Earlier work cited by Kerl and Walter found only 24% of targets met at the 12-month mark.Put simply, targets are directionally useful but overstated. If a typical target overstates returns by 15 points, a 50% implied upside might be closer to 35% on average, with a wide spread. Treat targets as a rough ranking, not a forecast, and expect many of the 30 to disappoint even if a few do spectacularly well.
The Math of Recovering From a Fall
Losses are asymmetric, which matters most when you buy stocks that have already fallen. A stock that drops 20% needs to rise 25% to get back to even, a 33% fall needs a 49% gain and a 50% fall needs a 100% gain. A 50% gain on a stock that has halved only gets you back to about 75% of where it started.Position size decides whether a miss is a scratch or a wound. If you put 2% of your portfolio into a stock that falls 50%, you lose 1% of the portfolio; put 20% into it, and you lose 10%.
The Backdrop: Rates, Inflation and Valuation
Compare a 50% target with what safe money pays: a 52-week Treasury bill yielded about 4.46% in October, with inflation at 3.7% in September. A 50% upside is roughly eleven times the T-bill yield, but with a real chance of loss. The S&P 500 was up about 11.4% for the year as of October 23, and the Fed held rates at 3.75% to 4.00% on October 28, with markets still pricing a possible December hike. Higher rates tend to weigh on richly valued growth stocks, much of what appears on these lists.Valuation sources differ: Kiplinger cites a forward P/E of 18.5 from Yardeni Research, while another October source put it near 20. A screen that finds stocks at a discount to analysts’ targets is not the same as one that finds stocks at a discount to their true worth.
A Practical Checklist for Using a List Like This
First, ask why the stock is cheap: read the latest earnings and find the bear case. Second, check the numbers behind the target: is earnings growth realistic, and is the valuation multiple sensible? Third, look at the rating mix, since huge upside with a Hold consensus sends a different signal from one with a Strong Buy. Fourth, check the balance sheet and cash flow, since weak companies can turn a falling price into a permanent loss.Fifth, size small and diversify across industries so you do not bet on one theme. Sixth, set a rule in advance for what would make you sell, and write down why you bought. Seventh, remember the alternative: 79% of active large-cap funds trailed the S&P 500 in 2025 (S&P Dow Jones Indices), and Bessembinder found that about 4.3% of stocks created all the market’s net wealth, an argument for owning many.
Pick no more than two or three names from any screen, write a one-paragraph reason you would own each, and cap each position at a size you could lose without changing your plans. If you cannot write the reason, you do not yet know enough to buy.
Conclusion
The “30 stocks that could rally 50% or more” list is a useful map of where Wall Street sees the widest gaps between price and value, as of October 27. Its top rows, NRG Energy at 85% and Jabil at 50%, show what the screen produces. But NRG’s story, with upside rising from 53% to 85% as the price fell about 27%, shows why the biggest numbers deserve the most scrutiny, and research suggests only about a quarter to two-thirds of such targets are ever met.Use the list the way a prospector uses a metal detector: it beeps near interesting ground, but it does not tell you whether you have found gold or a bottle cap. Do the research, keep positions small, diversify and compare any idea with a plain index fund. A qualified adviser can help you decide what fits your situation.
Frequently Asked Questions
What does “implied upside” mean?It is the percentage gain needed for a stock to reach analysts’ average price target, calculated as the target divided by the current price, minus one. If the target is $177 and the implied upside is 85%, the current price is about $95.70. It is a measure of what analysts expect, not of what will happen.
Are these 30 stocks buy recommendations?
No. The list is a screen ranking S&P 500 stocks by the gap between price and analysts’ average target. Kiplinger itself warns that price targets are a blunt tool and that committing money on a single data point is not an investment process.
How often do analyst price targets come true?
Less often than headlines suggest. Bradshaw, Brown and Huang found only 38% of 12-month targets were met at year-end, though 64% were reached at some point. Other studies put it at 24%, about 52% (Danish sample) and 63% (Indian sample), with accuracy falling as targets get more optimistic.
Why would a stock have 50% upside?
Usually because its price has fallen, because analysts expect earnings to grow quickly or both. NRG Energy’s implied upside rose from about 53% in June to 85% in October mainly because its price fell about 27% by my arithmetic while its target slipped about 11%.
How should I use a list like this?
As a starting point for research, not a shopping list: check why the stock is cheap, read the results, keep each position small and diversify. A broad index fund is a reasonable alternative. This is general education, not personal advice.
0 Comments
Be the first to share your thoughts on this article.