

Finance
Average Income Falls in Real Terms: What Surveys Show
REAL WAGES 2026 | US real hourly earnings: down 0.7% since January 2021 despite 21.8% nominal growth (BLS). 45 US states: negative real wage growth Jun 2025-Jun 2026 (USA Facts, July 23, 2026). OECD: real wages below 2021 levels in half of developed economies (Q3 2025). UK real wage growth: 0.4-0.6% -- close to zero despite nominal pay rises.
The core number: Visual Capitalist (September 2025, citing BLS): 'Real hourly earnings are still down 0.7%, showing workers' purchasing power has slightly declined over four and a half years.' The Consumer Price Index rose 22.7% over the same period that wages rose 21.8%. The 0.9 percentage point gap translates into real purchasing power that is lower today than it was at the start of 2021, for the average American worker, despite a tight labour market and record corporate profits. USAFacts (updated July 23, 2026 -- the most current authoritative source, refreshed monthly): 'In 45 states and Washington DC, real wage growth was negative, meaning wages did not keep up with inflation' in the year to June 2026. Only five states saw positive real wage growth.
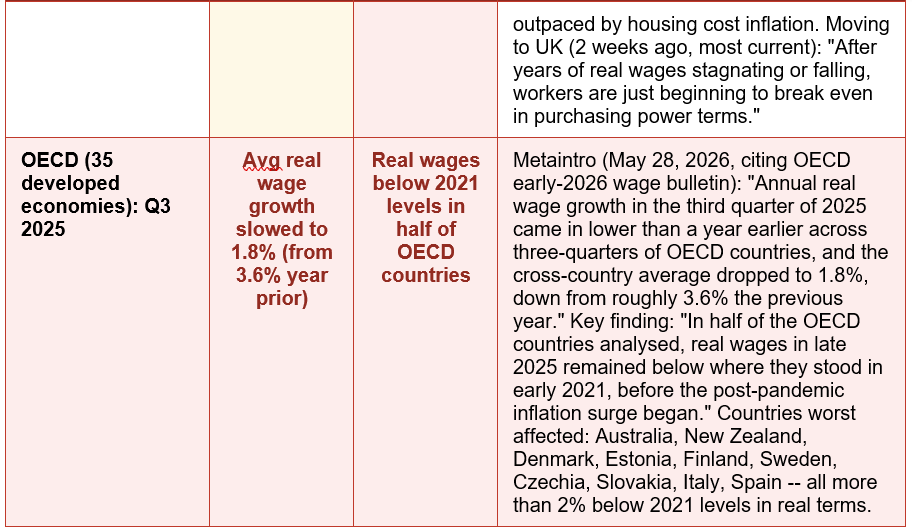
This is not simply a US story. The OECD's early-2026 wage bulletin (cited by Metaintro, May 28, 2026) found that in half of the 35+ developed economies it tracks, real wages in late 2025 remained below where they stood in early 2021. The global real wage average decelerated sharply: 1.8% real wage growth in Q3 2025, down from 3.6% a year earlier -- a halving of the recovery pace. Pew Research Center (May 28, 2026) documents the public sentiment this data produces: 66% of US adults say inflation is a very big problem facing the nation, up from 63% a year earlier. This guide presents the complete picture: the numbers, the geographies, the groups most affected, the mechanics of why real wages fall even when nominal wages rise, and what individuals can do about it.
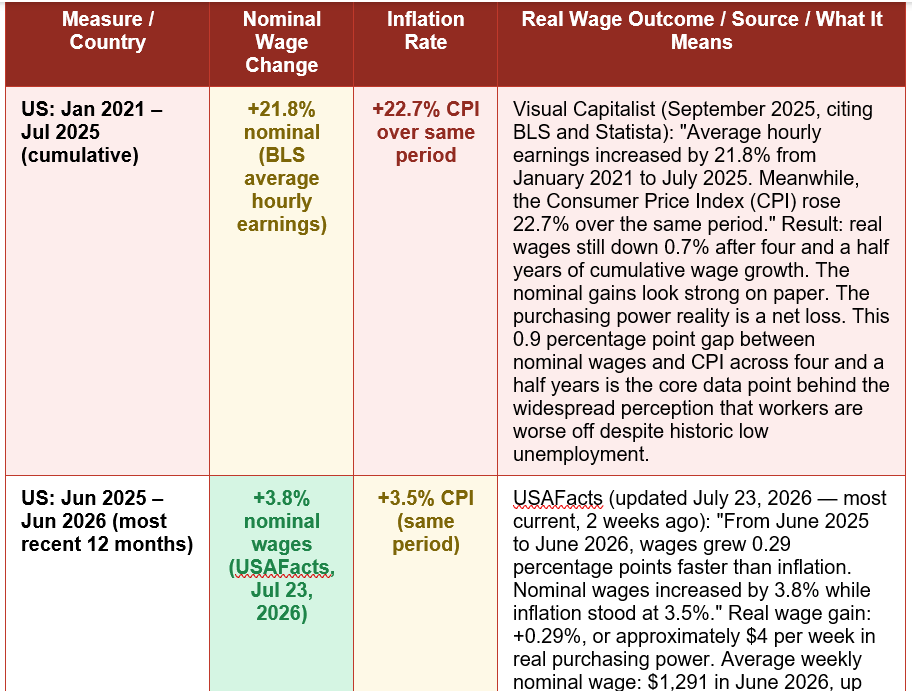
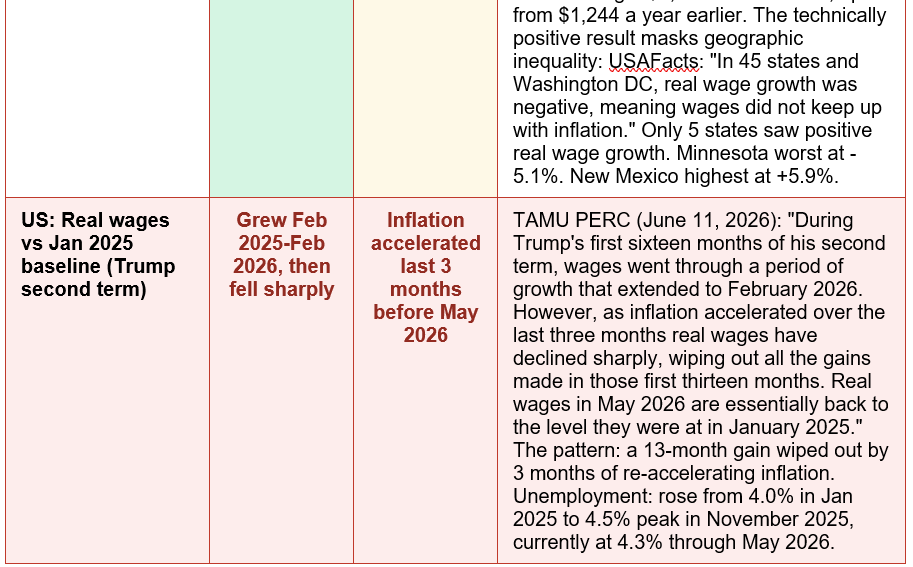
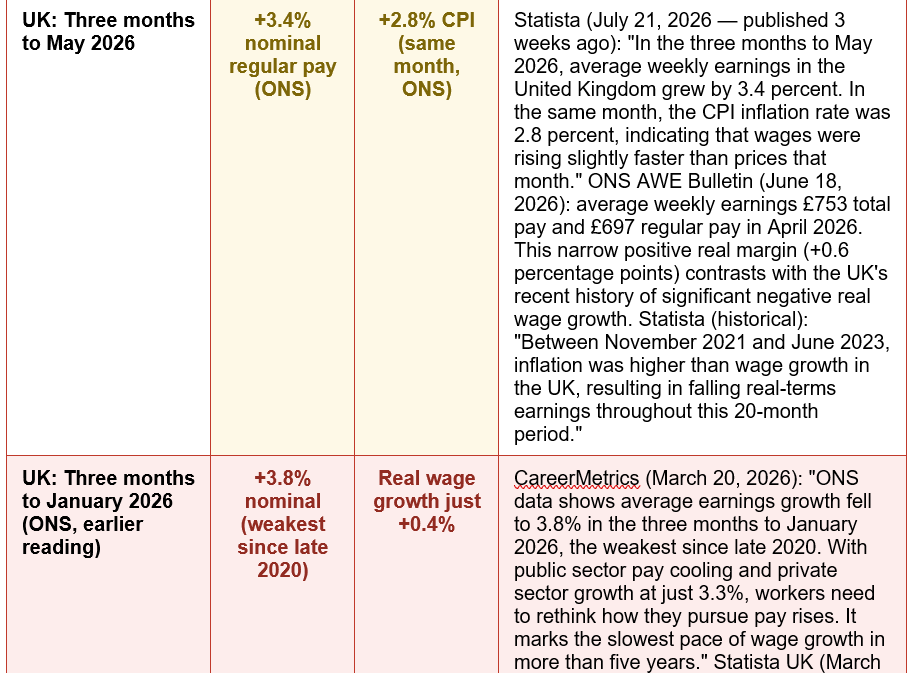
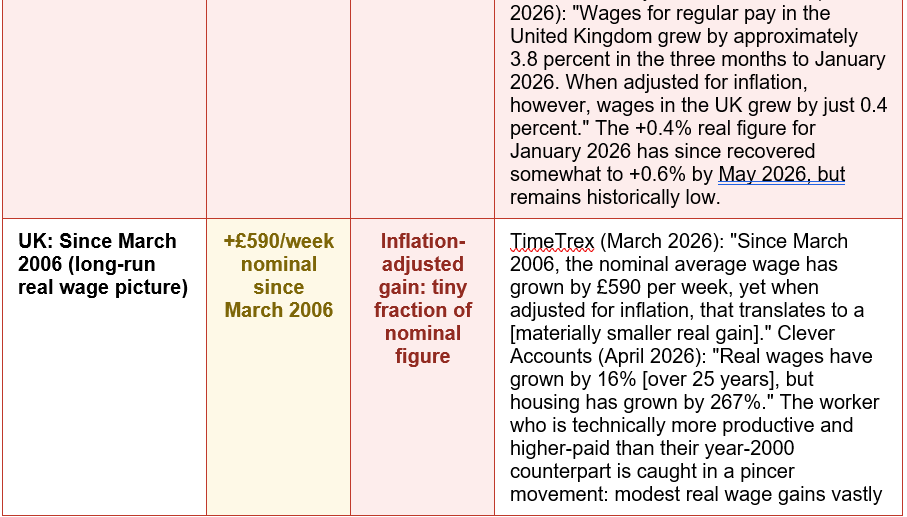
The defining numbers: US real wages: -0.7% cumulative 2021-Jul 2025. 45 states negative real growth 2026. OECD: half below 2021 levels. UK: real growth near zero. — Visual Capitalist (Sep 2025, BLS): 'Real hourly earnings still down 0.7% after four and a half years.' USAFacts (Jul 23, 2026 -- most current): '45 states negative real wage growth Jun 2025-Jun 2026. Only 5 states positive.' Metaintro (May 2026, OECD): 'Real wages below 2021 in half of OECD countries.' Statista (Jul 21, 2026, ONS): 'UK wages +3.4%, CPI 2.8% -- wages slightly ahead.' CareerMetrics (Mar 2026): 'UK AWE growth 3.8% in Jan 2026 -- weakest since 2020. Real: just 0.4%.'
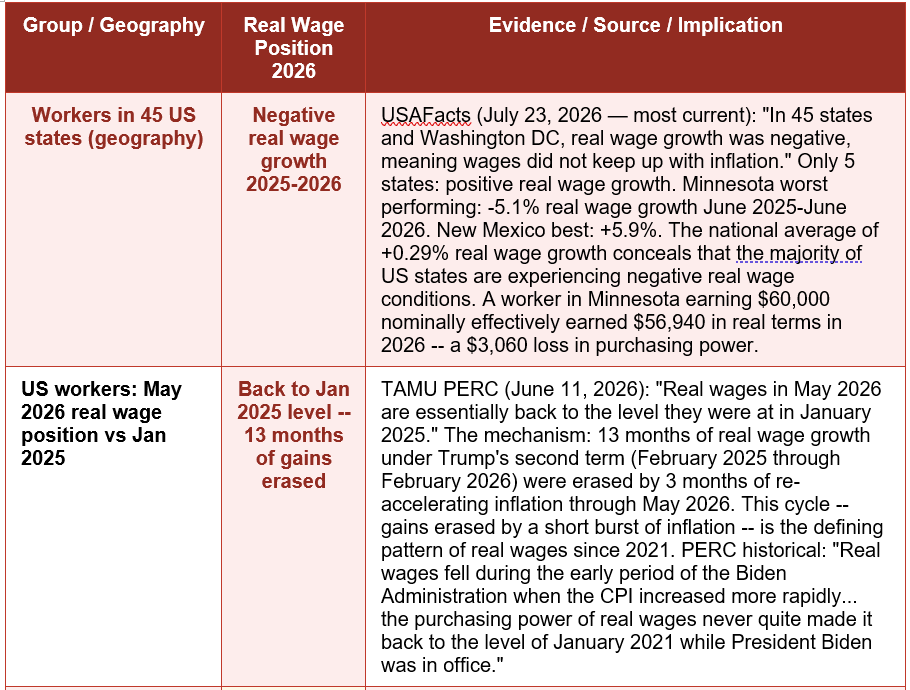
The geographic split: 45 of 50 US states: negative real wage growth. Minnesota worst: -5.1%. New Mexico best: +5.9%. — USAFacts (July 23, 2026 -- most current, refreshed monthly): 'Real wage growth varies geographically. Over 12 months ending Jun 2025-Jun 2026, wage growth outpaced inflation in 5 states. Highest real wage growth: New Mexico at 5.9%. In 45 states and Washington DC, real wage growth was negative. Minnesota steepest drop: -5.1%.' The national average of +0.29% real growth masks that 90% of US states are in negative real wage territory for the most recent 12-month period.
Pew Research Center (May 28, 2026): 'In a Pew Research Center survey conducted in April [2026], 66% of U.S. adults said inflation is a very big problem facing the nation, up from 63% last year.' This figure has risen despite nominal wages outpacing inflation in the most recent 12-month national average. The explanation: USAFacts (July 23, 2026): the national average conceals that 45 of 50 states saw negative real wage growth in the year to June 2026. For the majority of American workers, the national average is not their experience.
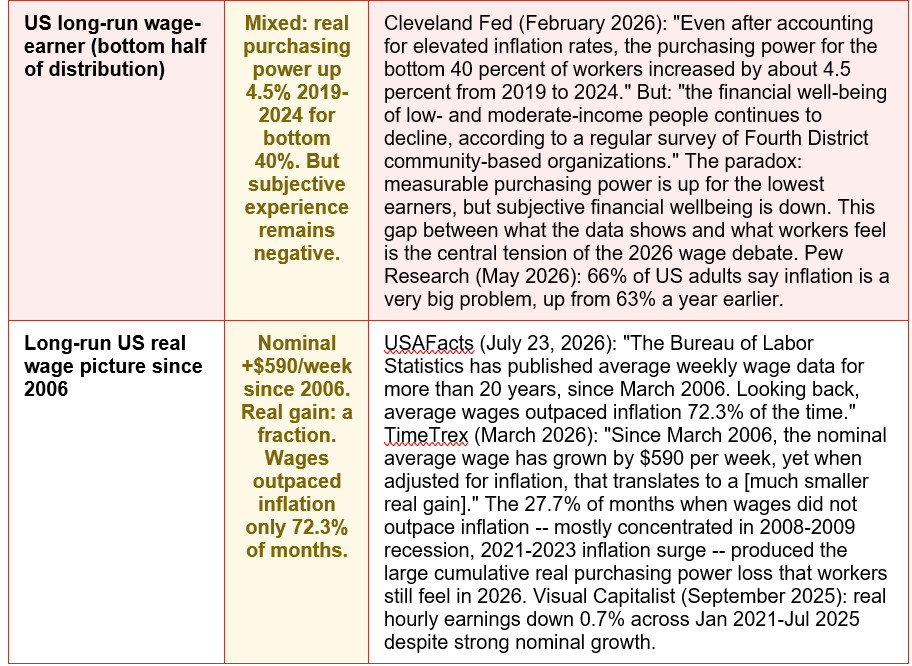
Cleveland Fed (February 2026) documents the paradox most clearly for low-to-moderate income workers: 'Despite this dour sentiment [among community organisations surveying low-income households], recent Cleveland Fed research shows that even after accounting for elevated inflation rates, the purchasing power for the bottom 40 percent of workers increased by about 4.5 percent from 2019 to 2024.' The bottom 40% had real purchasing power gains. But the financial well-being surveys still showed declining sentiment. The resolution: the Cleveland Fed asks the key question -- 'what does an additional 4.5 percent of purchasing power mean in the context of household budgets that are based on dollars and cents?' When housing, childcare, and healthcare absorb the majority of a low-income household's income, a 4.5% gain in purchasing power across 5 years is simply not enough to produce a sense of financial progress.
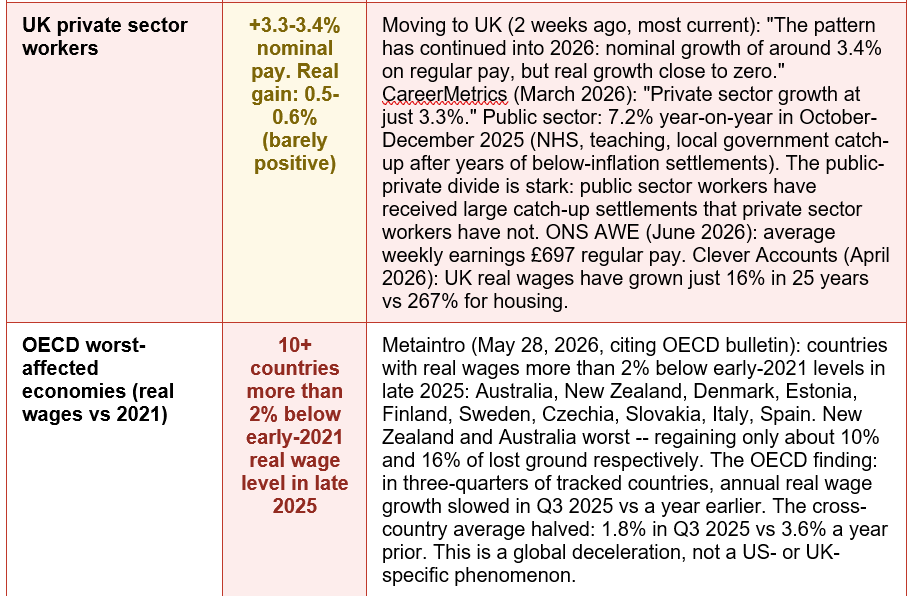
The UK picture from the ONS and Statista tells a similar story of narrow margins. Moving to UK (2 weeks ago, most current): 'After years of real wages stagnating or falling, workers are just beginning to break even in purchasing power terms.' The phrase 'just beginning to break even' captures the UK worker's experience after the 20-month period of falling real wages from November 2021 to June 2023. 'Breaking even' in purchasing power -- earning exactly what inflation costs you each month -- is not improvement. It is the absence of further decline. CareerMetrics (March 2026) notes that the 3.8% nominal wage growth figure for January 2026 was 'the weakest since late 2020' -- five years of deceleration returning wage growth to its post-financial-crisis normal, when real wage growth was chronically weak.
The paradox of the 2026 wage data: the US national average says real wages grew +0.29% year-on-year to June 2026. The state-level data says 45 of 50 states saw negative real wage growth. Both are true simultaneously. The national average is mathematically correct but geographically misleading. A worker in New Mexico experiencing +5.9% real wage growth and a worker in Minnesota experiencing -5.1% real wage growth are both captured in a national average of +0.29% -- a figure that accurately describes neither of their experiences. USAFacts (July 23, 2026): 'Real wage growth was negative, meaning wages did not keep up with inflation, in 45 states and Washington DC.' When 90% of US states are in negative real wage territory, the national average is not a useful description of the typical worker's experience. It is a mathematical artifact of a highly geographically uneven economy. The same principle applies to the UK: a public sector worker receiving a 7.2% settlement and a private sector worker receiving 3.3% nominal growth exist in entirely different real wage realities despite both being included in the ONS headline figure.
On the US: TAMU PERC (June 11, 2026): 'As inflation accelerated over the last three months real wages have declined sharply, wiping out all the gains made in those first thirteen months. Real wages in May 2026 are essentially back to the level they were at in January 2025.' The re-acceleration of inflation through spring 2026 -- driven, according to PERC, by the same inflation dynamics that characterised the early 2020s -- means the fragility of real wage gains has been demonstrated again in real time. USAFacts (July 23, 2026, most current) provides the most recent reading: nominal wages at +3.8%, inflation at +3.5% for the year to June 2026 -- a 0.29 percentage point positive margin that is the thinnest meaningful positive reading in the dataset. One quarter-point uptick in inflation wipes this margin to zero.
On the UK: Statista (July 21, 2026): in the three months to May 2026, UK wages grew 3.4% against CPI of 2.8% -- a more comfortable positive margin than the January 2026 reading. Moving to UK (2 weeks ago): 'The April 2026 National Living Wage rise to £12.71 will push up the bottom of the wage distribution, with knock-on effects on roles above the minimum as employers adjust differentials.' The National Living Wage increase is a structural upward shift that will improve real wages at the bottom of the UK distribution in 2026 regardless of broader inflation movements. But Clever Accounts (April 2026) places this in the longer context: 'Sustained improvements in living standards will require stronger alignment between wage growth, productivity gains, and measures to address affordability challenges, including housing.' The 16% real wage gain over 25 years against 267% housing price growth cannot be addressed by nominal wage policy alone.
On the global picture: Metaintro (May 2026, citing OECD): 'In most developed economies real wages are still technically growing year over year, but the OECD's early-2026 wage bulletin shows that growth is slowing in three-quarters of the countries it tracks.' The halving of average real wage growth from 3.6% to 1.8% between Q3 2024 and Q3 2025 across the OECD suggests a global deceleration that is not tied to any single country's policy choices. Australia and New Zealand have recovered only 10-16% of the real wage ground lost since 2021. Italy and Spain remain more than 2% below their 2021 real wage levels. The countries that fared best (some Scandinavian, Eastern European, and North American economies) did so through combinations of strong labour market tightening, above-CPI minimum wage legislations, and lower exposure to energy price shocks.
KEY STATISTICS SUMMARY -- AVERAGE INCOME IN REAL TERMS 2021-2026: US -- real hourly earnings down 0.7% from Jan 2021 to Jul 2025 (BLS via Visual Capitalist, September 2025) despite 21.8% nominal growth and 22.7% CPI rise. US -- real wage growth +0.29% in year to June 2026, or $4/week (USAFacts, July 23, 2026). 45 of 50 states: negative real wage growth in that period. Minnesota: -5.1%. New Mexico: +5.9%. US -- real wages in May 2026 back to January 2025 level, erasing 13 months of gains (TAMU PERC, June 11, 2026). UK -- real regular pay growth just 0.4% in January 2026 (weakest since late 2020) per ONS/CareerMetrics. UK -- real growth improved to +0.6% by May 2026 per Statista/ONS (July 21, 2026). UK average weekly earnings: £697 regular pay / £753 total pay in April 2026 (ONS AWE, June 18, 2026). UK median full-time salary: £39,039 in 2025 ASHE (ONS). UK real wages grown 16% in 25 years vs housing up 267% (Clever Accounts, April 2026). OECD -- real wage growth decelerated from 3.6% to 1.8% (Q3 2025 vs Q3 2024). Half of OECD economies below 2021 real wage level. Australia and New Zealand worst performers (Metaintro, May 2026). Global -- 66% of US adults say inflation is a very big problem, up from 63% (Pew, May 2026). Long run -- average wages outpaced inflation in 72.3% of months since March 2006 (USAFacts, July 2026).
PRACTICAL TOOLS FOR MONITORING YOUR OWN REAL WAGE POSITION -- 2026: US WORKERS: (1) BLS CPI Inflation Calculator: bls.gov/data/inflation_calculator.htm -- enter any dollar amount in any month and see its current real value. Use to verify whether your last pay rise beat inflation. (2) USAFacts Wage Tracker: usafacts.org -- monthly updates on nominal and real wage growth by state and nationally. Check your state against the national average. (3) BLS Occupational Employment Statistics: bls.gov/oes -- see median wages by occupation in your area to benchmark your current salary. (4) FRED (St. Louis Fed): fred.stlouisfed.org -- real personal income, real wages, and CPI data in one freely accessible database. UK WORKERS: (1) ONS Average Weekly Earnings bulletin: ons.gov.uk -- released monthly, covering nominal and real AWE. Most recent: June 18, 2026. (2) ONS ASHE (Annual Survey of Hours and Earnings): most recent April 2025, published November 2025. Benchmark salary by occupation and region. (3) CareerMetrics UK salary checker: careermetrics.co.uk -- 520 UK occupations with real ONS data. (4) Bank of England Inflation Calculator: bankofengland.co.uk -- calculates real value of any historical amount in current pounds. GLOBAL: (5) OECD Wage Bulletin: oecd.org/employment/wage-bulletin -- quarterly real wage data for 35+ countries. Check where your country sits in the global real wage league table.
HOW TO CHECK IF YOUR SALARY IS KEEPING UP WITH INFLATION IN 2026: STEP 1 -- FIND YOUR INFLATION RATE: US: BLS CPI (bls.gov) -- current rate 3.5% (year to June 2026, USAFacts). UK: ONS CPI -- 2.8% (May 2026, Statista/ONS). STEP 2 -- CALCULATE YOUR NOMINAL PAY RISE: If your salary went from $50,000 to $51,900 -- that is a 3.8% nominal increase. STEP 3 -- SUBTRACT INFLATION: US worker: 3.8% minus 3.5% = +0.3% real. Real gain: approximately $150 on $50,000. UK worker: 3.8% minus 2.8% = +1.0% real. Real gain: approximately £390 on £39,000. STEP 4 -- CHECK YOUR STATE/REGION: USAFacts (July 2026): 45 states have negative real wage growth. If your state is among the 45, your local inflation may be outpacing your wages even if the national figure says otherwise. Locally, food, housing and energy prices are the most relevant indicators. STEP 5 -- BENCHMARK YOUR OCCUPATION: Use BLS OES (US) or ONS ASHE (UK) to see whether your nominal wage is also falling relative to your occupation median -- a signal that you may need to change jobs to restore both nominal and real purchasing power.
The UK position is marginally better in the most recent reading -- Statista (July 21, 2026) shows nominal wages at +3.4% against CPI of 2.8% in the three months to May 2026 -- but this thin positive margin follows five years of below-inflation wage settlements that left workers, in Moving to UK's phrase, 'just beginning to break even in purchasing power terms.' The longer-run picture is sobering: Clever Accounts (April 2026) documents that UK real wages have grown just 16% over 25 years while housing has grown 267%. Globally, the OECD (Metaintro, May 2026) found real wages below 2021 levels in half of 35+ developed economies, with growth decelerating from 3.6% to 1.8% between Q3 2024 and Q3 2025.
The individual response to these conditions is not to accept them as fixed. Voluntary job changes typically outperform employer-provided pay rises by 10-20 percentage points. Geographic mobility within the US can shift a worker from a -5.1% real wage state (Minnesota) to a +5.9% state (New Mexico). Salary benchmarking against BLS and ONS data surfaces gaps between current pay and market rate. And above all: understanding the difference between nominal and real wages -- and checking your own position against the current CPI -- converts economic headlines into actionable personal information. The data says income is down in real terms for the majority. That is not the end of the story.
The most current official data (USAFacts, updated July 23, 2026 -- refreshed monthly) shows that nationally, US nominal wages grew 3.8% in the year to June 2026 while inflation stood at 3.5%, producing a +0.29% real wage gain -- approximately $4 per week in real purchasing power. However, this national average conceals dramatic geographic variation. USAFacts (July 2026): 'In 45 states and Washington DC, real wage growth was negative, meaning wages did not keep up with inflation.' Only five states (including New Mexico at +5.9%) saw positive real wage growth in the most recent 12-month period. Additionally, TAMU PERC (June 11, 2026) documents that real wages in May 2026 are back to their January 2025 level, as three months of inflation acceleration erased 13 months of real wage gains. The honest answer: nationally, US real wages are barely positive in the most recent reading -- but in 45 of 50 states, and as of May 2026, real wages are negative or flat. The long-run picture is worse: Visual Capitalist (September 2025, BLS data): real hourly earnings are down 0.7% from January 2021 to July 2025, despite 21.8% nominal growth and against 22.7% CPI inflation.
Are UK real wages rising or falling in 2026?
The UK picture in 2026 is marginally positive in the most recent reading but historically weak. Statista (July 21, 2026 -- 3 weeks ago, citing ONS): 'In the three months to May 2026, average weekly earnings in the United Kingdom grew by 3.4 percent. In the same month, the CPI inflation rate was 2.8 percent, indicating that wages were rising slightly faster than prices.' This produces a real wage gain of approximately 0.6 percentage points -- a narrow positive margin. Earlier in 2026 it was even thinner: CareerMetrics (March 20, 2026): 'ONS data shows average earnings growth fell to 3.8% in the three months to January 2026, the weakest since late 2020.' Adjusted for inflation, real wage growth in January 2026 was just 0.4% (Statista UK, March 2026). The ONS AWE Bulletin (June 18, 2026) reports average weekly earnings of £697 regular pay and £753 total pay in April 2026 -- both figures in nominal terms. Moving to UK (2 weeks ago, most current): 'After years of real wages stagnating or falling, workers are just beginning to break even in purchasing power terms.' The UK experienced 20 months of falling real wages from November 2021 to June 2023 (Statista, ONS historical data). Recovery since then has been slow and is not yet complete in a purchasing power sense for many workers, given that housing has inflated 267% against 16% real wage growth over 25 years (Clever Accounts, April 2026).
What does it mean for income to fall in real terms?
Income falling in real terms means that your paycheck, adjusted for inflation, buys less than it did before -- even if the number on your payslip has increased. The mechanism is straightforward: if your salary rises from $50,000 to $51,500 (a 3% nominal increase) but the Consumer Price Index rises by 4% in the same period, your purchasing power has declined. You earn more dollars, but those dollars buy fewer goods and services. Visual Capitalist (September 2025, BLS): 'Average hourly earnings increased by 21.8% from January 2021 to July 2025. Meanwhile, the Consumer Price Index rose 22.7% over the same period, leaving real wages -- the amount adjusted for inflation -- still down 0.7%.' The nominal figure (21.8% increase) looks strong. The real figure (-0.7% over four and a half years) tells the true story. This is what makes real terms the correct measure of whether living standards are improving or declining: nominal wage increases that lag inflation produce a mathematical decline in what money can buy, regardless of what the number on the payslip says. The BLS CPI Inflation Calculator (bls.gov/data/inflation_calculator.htm) allows anyone to calculate the real value of any historical dollar amount -- a practical tool for verifying whether a specific pay rise beat or lost to inflation.
Why do workers feel worse off even when official data shows wage growth?
The gap between what official data shows and what workers feel is the central tension in the 2026 real wages debate, and it has several explanations. First, geographic dispersion: USAFacts (July 23, 2026): 45 of 50 US states saw negative real wage growth in the year to June 2026. A worker in Minnesota with -5.1% real wage growth does not feel the national average of +0.29%. Second, the housing problem: Clever Accounts (April 2026): 'Real wages have grown by 16% [in 25 years], but housing has grown by 267%.' When housing -- the largest unavoidable expenditure for most households -- inflates vastly faster than wages, the average CPI figure understates the lived experience for renters and recent homebuyers. Third, the cumulative deficit: TAMU PERC (June 2026): 'The purchasing power of real wages never quite made it back to the level of January 2021 while President Biden was in office.' A +0.3% real gain in the most recent year does not erase a multi-year accumulated purchasing power deficit. Fourth, the distribution problem: TimeTrex (March 2026): 'The gap between average and median wages continues to widen slightly, indicating disproportionate wage growth in the upper economic deciles.' When high earners receive larger nominal increases, the average wage figure rises without reflecting the median worker's experience. Fifth, the measurement paradox documented by the Cleveland Fed (February 2026): even workers whose purchasing power measurably increased -- the bottom 40% by 4.5% from 2019-2024 -- reported declining financial wellbeing in surveys, because the gains were insufficient relative to the structural costs of housing, childcare, and healthcare that dominate their budgets.
How do I know if my own salary has kept up with inflation?
The calculation is straightforward. Identify your salary at two points in time (e.g. January 2024 and August 2026). Calculate the percentage change: (new salary - old salary) / old salary x 100 = your nominal wage growth rate. Then compare this to the CPI change over the same period. US: BLS reports 3.5% CPI inflation in the year to June 2026 (USAFacts, July 23, 2026). UK: ONS reports 2.8% CPI in May 2026 (Statista, July 21, 2026). If your nominal wage growth rate exceeds the CPI change: you have a real wage gain. If it is below: you have a real wage loss, regardless of how large the nominal number looks. Practical tools: the BLS CPI Inflation Calculator at bls.gov/data/inflation_calculator.htm (US); the Bank of England Inflation Calculator at bankofengland.co.uk (UK). Both are free and require only a starting amount and a date range. Additionally, benchmark your salary against market data: BLS Occupational Employment Statistics (bls.gov/oes) for US occupation and geographic wage data, and ONS ASHE (ons.gov.uk) for UK occupation wage data. If your salary has not kept pace with inflation AND is below the median for your occupation: you have both a real wage problem and a market position problem. Both require a negotiation or a job change to address -- macroeconomic conditions alone will not close either gap.
Table of Contents
- The Numbers Look Good. The Reality Does Not.
- The Data: US and UK Real Wage Tracker, 2021-2026
- Who Is Worst Affected: Geography, Sector, and Income Group
- Why Real Wages Fall Even When Paychecks Grow: The Mechanics
- What Workers Actually Feel: The Survey Evidence
- What Financial Experts and Research Bodies Say About the Outlook
- What Workers Can Do: Protecting Real Income in a Falling Real Wage Environment
- Conclusion: Nominally Richer, Really Poorer -- and the Recovery Is Fragile
- Frequently Asked Questions (FAQ)
- Are real wages rising or falling in the US in 2026?
- Are UK real wages rising or falling in 2026?
- What does it mean for income to fall in real terms?
- Why do workers feel worse off even when official data shows wage growth?
- How do I know if my own salary has kept up with inflation?
- External References & Further Reading
The Numbers Look Good. The Reality Does Not.
Workers in the United States and United Kingdom have received some of the largest nominal wage increases in decades. US average hourly earnings rose 21.8% between January 2021 and July 2025, according to Bureau of Labor Statistics data visualised by Statista. UK nominal regular pay grew 3.4-3.8% year-on-year through 2025-2026, according to the Office for National Statistics. By the headlines, workers are getting paid more. By the measure that actually determines whether people can afford their lives -- real wages, adjusted for the prices of things they buy -- the story is largely one of decline, erosion, and recovery that is thin, geographically uneven, and fragile.The core number: Visual Capitalist (September 2025, citing BLS): 'Real hourly earnings are still down 0.7%, showing workers' purchasing power has slightly declined over four and a half years.' The Consumer Price Index rose 22.7% over the same period that wages rose 21.8%. The 0.9 percentage point gap translates into real purchasing power that is lower today than it was at the start of 2021, for the average American worker, despite a tight labour market and record corporate profits. USAFacts (updated July 23, 2026 -- the most current authoritative source, refreshed monthly): 'In 45 states and Washington DC, real wage growth was negative, meaning wages did not keep up with inflation' in the year to June 2026. Only five states saw positive real wage growth.
This is not simply a US story. The OECD's early-2026 wage bulletin (cited by Metaintro, May 28, 2026) found that in half of the 35+ developed economies it tracks, real wages in late 2025 remained below where they stood in early 2021. The global real wage average decelerated sharply: 1.8% real wage growth in Q3 2025, down from 3.6% a year earlier -- a halving of the recovery pace. Pew Research Center (May 28, 2026) documents the public sentiment this data produces: 66% of US adults say inflation is a very big problem facing the nation, up from 63% a year earlier. This guide presents the complete picture: the numbers, the geographies, the groups most affected, the mechanics of why real wages fall even when nominal wages rise, and what individuals can do about it.
The Data: US and UK Real Wage Tracker, 2021-2026
The following table compiles the most authoritative available data on real wages across the US, UK, and OECD as of August 2026:The defining numbers: US real wages: -0.7% cumulative 2021-Jul 2025. 45 states negative real growth 2026. OECD: half below 2021 levels. UK: real growth near zero. — Visual Capitalist (Sep 2025, BLS): 'Real hourly earnings still down 0.7% after four and a half years.' USAFacts (Jul 23, 2026 -- most current): '45 states negative real wage growth Jun 2025-Jun 2026. Only 5 states positive.' Metaintro (May 2026, OECD): 'Real wages below 2021 in half of OECD countries.' Statista (Jul 21, 2026, ONS): 'UK wages +3.4%, CPI 2.8% -- wages slightly ahead.' CareerMetrics (Mar 2026): 'UK AWE growth 3.8% in Jan 2026 -- weakest since 2020. Real: just 0.4%.'
Who Is Worst Affected: Geography, Sector, and Income Group
The aggregate figures conceal dramatic variation by state, sector, income level, and country. The following table maps where real wage decline is most severe:The geographic split: 45 of 50 US states: negative real wage growth. Minnesota worst: -5.1%. New Mexico best: +5.9%. — USAFacts (July 23, 2026 -- most current, refreshed monthly): 'Real wage growth varies geographically. Over 12 months ending Jun 2025-Jun 2026, wage growth outpaced inflation in 5 states. Highest real wage growth: New Mexico at 5.9%. In 45 states and Washington DC, real wage growth was negative. Minnesota steepest drop: -5.1%.' The national average of +0.29% real growth masks that 90% of US states are in negative real wage territory for the most recent 12-month period.
Why Real Wages Fall Even When Paychecks Grow: The Mechanics
The gap between nominal wages (what appears on the payslip) and real wages (what that payslip can actually buy) is one of the most consistently misunderstood economic concepts in public discourse. Understanding the mechanics matters because it determines whether current conditions represent a temporary correction or a structural problem.- The CPI measurement lag: Consumer prices are measured monthly, but wages typically adjust annually through salary reviews, collective bargaining cycles, or minimum wage legislation. When inflation accelerates suddenly -- as it did in 2021-2022 and again in early 2026 -- wages cannot respond fast enough. TAMU PERC (June 11, 2026) documented that as inflation accelerated over the three months through May 2026, real wages declined sharply, wiping out all the gains made in the prior thirteen months. The acceleration of inflation in early 2026 produced exactly this pattern: wages that had caught up over 13 months were outpaced again within 3 months.
- Housing and energy as non-optional inflation: The CPI basket averages across all goods and services, but not all inflation is equal in its impact on households. Clever Accounts (April 2026): "Real wages have grown by 16% [over 25 years], but housing has grown by 267%." When the largest unavoidable expense in a household budget inflates at 267% while wages grow at 16%, the average CPI figure dramatically understates the lived experience of purchasing power loss for renters and recent buyers. Pew Research (May 2026): 66% of US adults describe inflation as a very big problem -- a perception shaped more by grocery bills, rent, and energy costs than by the average CPI figure.
- The income distribution problem: USAFacts (July 23, 2026): "The gap between average and median wages continues to widen slightly, indicating disproportionate wage growth in the upper economic deciles compared to middle-income earners." (TimeTrex, March 2026.) When the highest earners receive outsized nominal wage increases, the average nominal wage growth figure is pulled upward in a way that misrepresents the typical worker's experience. A world in which the top 10% of earners receive 8% nominal increases while the bottom 50% receive 3% shows strong "average" wage growth but widespread real wage loss for the majority.
- The accumulated deficit from 2021-2023: TAMU PERC (June 2026): "Real wages fell during the early period of the Biden Administration when the CPI increased more rapidly than growth rate of wages, resulting in a large decline in the purchasing power of wages. This occurred during the period from January 2021 to summer 2022. Afterwards, real wages increased, slowly, for the remainder of President Biden's term in office. However, the purchasing power of real wages never quite made it back to the level of January 2021 while President Biden was in office." The same dynamic applies globally. Metaintro (May 2026, citing OECD): "Even where pay is climbing again, many workers are still digging out of a hole that opened four years ago." The cumulative deficit from 2021-2023 is not a closed account -- it is an ongoing drag on real purchasing power that current nominal wage growth is only slowly and unevenly addressing.
- The gig economy and income volatility: Average and median wage figures measure employed workers, not the self-employed, gig workers, or those in involuntary part-time work. TimeTrex (March 2026): the gap between average and median wages is widening, and neither figure captures self-employed income. Moving to UK (2 weeks ago): "Neither [ONS average earnings measure] captures self-employed income -- if you plan to freelance in the UK, treat all of these as a reference point rather than a direct comparison." For gig and self-employed workers -- approximately 36% of the US workforce per recent BLS data -- the real wage picture is not captured in any of the headline figures, and anecdotal and survey evidence suggests their real income position has deteriorated faster than that of employed workers.
What Workers Actually Feel: The Survey Evidence
The most striking feature of the real wages data in 2026 is the gap between what the official statistics show and what workers report experiencing. This gap is not a measurement error -- it reflects several real phenomena that the headline figures do not fully capture.Pew Research Center (May 28, 2026): 'In a Pew Research Center survey conducted in April [2026], 66% of U.S. adults said inflation is a very big problem facing the nation, up from 63% last year.' This figure has risen despite nominal wages outpacing inflation in the most recent 12-month national average. The explanation: USAFacts (July 23, 2026): the national average conceals that 45 of 50 states saw negative real wage growth in the year to June 2026. For the majority of American workers, the national average is not their experience.
Cleveland Fed (February 2026) documents the paradox most clearly for low-to-moderate income workers: 'Despite this dour sentiment [among community organisations surveying low-income households], recent Cleveland Fed research shows that even after accounting for elevated inflation rates, the purchasing power for the bottom 40 percent of workers increased by about 4.5 percent from 2019 to 2024.' The bottom 40% had real purchasing power gains. But the financial well-being surveys still showed declining sentiment. The resolution: the Cleveland Fed asks the key question -- 'what does an additional 4.5 percent of purchasing power mean in the context of household budgets that are based on dollars and cents?' When housing, childcare, and healthcare absorb the majority of a low-income household's income, a 4.5% gain in purchasing power across 5 years is simply not enough to produce a sense of financial progress.
The UK picture from the ONS and Statista tells a similar story of narrow margins. Moving to UK (2 weeks ago, most current): 'After years of real wages stagnating or falling, workers are just beginning to break even in purchasing power terms.' The phrase 'just beginning to break even' captures the UK worker's experience after the 20-month period of falling real wages from November 2021 to June 2023. 'Breaking even' in purchasing power -- earning exactly what inflation costs you each month -- is not improvement. It is the absence of further decline. CareerMetrics (March 2026) notes that the 3.8% nominal wage growth figure for January 2026 was 'the weakest since late 2020' -- five years of deceleration returning wage growth to its post-financial-crisis normal, when real wage growth was chronically weak.
The paradox of the 2026 wage data: the US national average says real wages grew +0.29% year-on-year to June 2026. The state-level data says 45 of 50 states saw negative real wage growth. Both are true simultaneously. The national average is mathematically correct but geographically misleading. A worker in New Mexico experiencing +5.9% real wage growth and a worker in Minnesota experiencing -5.1% real wage growth are both captured in a national average of +0.29% -- a figure that accurately describes neither of their experiences. USAFacts (July 23, 2026): 'Real wage growth was negative, meaning wages did not keep up with inflation, in 45 states and Washington DC.' When 90% of US states are in negative real wage territory, the national average is not a useful description of the typical worker's experience. It is a mathematical artifact of a highly geographically uneven economy. The same principle applies to the UK: a public sector worker receiving a 7.2% settlement and a private sector worker receiving 3.3% nominal growth exist in entirely different real wage realities despite both being included in the ONS headline figure.
What Financial Experts and Research Bodies Say About the Outlook
The forward outlook on real wages in 2026 is mixed, conditional, and more fragile than the surface-level recovery numbers suggest.On the US: TAMU PERC (June 11, 2026): 'As inflation accelerated over the last three months real wages have declined sharply, wiping out all the gains made in those first thirteen months. Real wages in May 2026 are essentially back to the level they were at in January 2025.' The re-acceleration of inflation through spring 2026 -- driven, according to PERC, by the same inflation dynamics that characterised the early 2020s -- means the fragility of real wage gains has been demonstrated again in real time. USAFacts (July 23, 2026, most current) provides the most recent reading: nominal wages at +3.8%, inflation at +3.5% for the year to June 2026 -- a 0.29 percentage point positive margin that is the thinnest meaningful positive reading in the dataset. One quarter-point uptick in inflation wipes this margin to zero.
On the UK: Statista (July 21, 2026): in the three months to May 2026, UK wages grew 3.4% against CPI of 2.8% -- a more comfortable positive margin than the January 2026 reading. Moving to UK (2 weeks ago): 'The April 2026 National Living Wage rise to £12.71 will push up the bottom of the wage distribution, with knock-on effects on roles above the minimum as employers adjust differentials.' The National Living Wage increase is a structural upward shift that will improve real wages at the bottom of the UK distribution in 2026 regardless of broader inflation movements. But Clever Accounts (April 2026) places this in the longer context: 'Sustained improvements in living standards will require stronger alignment between wage growth, productivity gains, and measures to address affordability challenges, including housing.' The 16% real wage gain over 25 years against 267% housing price growth cannot be addressed by nominal wage policy alone.
On the global picture: Metaintro (May 2026, citing OECD): 'In most developed economies real wages are still technically growing year over year, but the OECD's early-2026 wage bulletin shows that growth is slowing in three-quarters of the countries it tracks.' The halving of average real wage growth from 3.6% to 1.8% between Q3 2024 and Q3 2025 across the OECD suggests a global deceleration that is not tied to any single country's policy choices. Australia and New Zealand have recovered only 10-16% of the real wage ground lost since 2021. Italy and Spain remain more than 2% below their 2021 real wage levels. The countries that fared best (some Scandinavian, Eastern European, and North American economies) did so through combinations of strong labour market tightening, above-CPI minimum wage legislations, and lower exposure to energy price shocks.
KEY STATISTICS SUMMARY -- AVERAGE INCOME IN REAL TERMS 2021-2026: US -- real hourly earnings down 0.7% from Jan 2021 to Jul 2025 (BLS via Visual Capitalist, September 2025) despite 21.8% nominal growth and 22.7% CPI rise. US -- real wage growth +0.29% in year to June 2026, or $4/week (USAFacts, July 23, 2026). 45 of 50 states: negative real wage growth in that period. Minnesota: -5.1%. New Mexico: +5.9%. US -- real wages in May 2026 back to January 2025 level, erasing 13 months of gains (TAMU PERC, June 11, 2026). UK -- real regular pay growth just 0.4% in January 2026 (weakest since late 2020) per ONS/CareerMetrics. UK -- real growth improved to +0.6% by May 2026 per Statista/ONS (July 21, 2026). UK average weekly earnings: £697 regular pay / £753 total pay in April 2026 (ONS AWE, June 18, 2026). UK median full-time salary: £39,039 in 2025 ASHE (ONS). UK real wages grown 16% in 25 years vs housing up 267% (Clever Accounts, April 2026). OECD -- real wage growth decelerated from 3.6% to 1.8% (Q3 2025 vs Q3 2024). Half of OECD economies below 2021 real wage level. Australia and New Zealand worst performers (Metaintro, May 2026). Global -- 66% of US adults say inflation is a very big problem, up from 63% (Pew, May 2026). Long run -- average wages outpaced inflation in 72.3% of months since March 2006 (USAFacts, July 2026).
What Workers Can Do: Protecting Real Income in a Falling Real Wage Environment
The individual cannot control macroeconomic inflation or national wage policy. But the individual can make decisions that protect and grow their real purchasing power even when aggregate real wages are falling. Financial experts consistently identify five categories of action:- Negotiate aggressively and at the right moment: CareerMetrics (March 2026): "With public sector pay cooling and private sector growth at just 3.3%, workers need to rethink how they pursue pay rises." The annual review cycle is not the only opportunity. Research shows that workers who change jobs typically receive 10-20% salary increases -- significantly above the 3.3-3.8% market average. In a negative real wage environment, voluntary job changes are one of the most effective personal strategies for restoring real purchasing power. USAFacts (July 23, 2026): New Mexico's +5.9% real wage growth vs Minnesota's -5.1% illustrates that geography matters -- workers in high-growth states have structurally better real wage environments.
- Understand the difference between nominal and real salary offers: A 3.8% nominal pay rise in an environment of 3.5% inflation is a +0.3% real increase -- approximately $150/year on a $50,000 salary in real purchasing power terms. Workers who accept 3-4% nominal increases as "inflation-beating" without checking the current CPI rate may be accepting real pay cuts without realising it. The BLS CPI calculator (bls.gov/data/inflation_calculator.htm) allows anyone to calculate whether a specific pay offer preserves, increases, or decreases their real purchasing power. In the UK, the ONS inflation dashboard (ons.gov.uk) provides the same capability.
- Invest the 20%+ savings rate before inflation erodes it: Cash savings lose real value at the inflation rate. A $10,000 emergency fund in a savings account at 2% interest in a 3.5% inflation environment loses approximately $150 in real value annually. TimeTrex (March 2026): "On a macro scale, average wages outpaced inflation in every month dating back to June 2023, signalling a sustained, albeit gradual, recovery of domestic purchasing power." Workers who capture wage growth above inflation and invest the surplus -- in equity markets, real estate, or other inflation-beating assets -- can compound real purchasing power even in a low-real-wage-growth environment. High-yield savings accounts (currently 4-5% APY at Ally, Marcus, SoFi) at least partially offset inflation on the emergency fund.
- Audit fixed costs against real income, not nominal income: The Cleveland Fed (February 2026) asks the key question: what does a purchasing power change mean in the context of household budgets that are based on dollars and cents? For workers whose real wages are falling, the correct response is a systematic audit of fixed costs -- rent/mortgage, subscriptions, insurance, loan payments -- with the goal of identifying contracts that can be renegotiated or replaced with lower-cost alternatives. In the UK, the National Living Wage rise to £12.71 from April 2026 (Moving to UK, 2 weeks ago) means workers at or near the minimum wage may have more negotiating power with employers adjusting differentials. Use ONS salary benchmarking data or BLS wage data to understand where your salary sits within your occupation and geography.
- Build income diversification to reduce dependence on one inflation-sensitive wage: The 36% of the US workforce in the gig economy demonstrates both the risk and the opportunity of multiple income streams. A single employer wage is exposed 100% to whatever real wage growth that employer delivers. A worker with a primary wage plus dividend income from an equity portfolio, plus freelance income from a professional skill, has three separate real income streams -- only one of which is directly exposed to employer wage policy. The Cleveland Fed note on the bottom 40%'s purchasing power gains (4.5% from 2019-2024) illustrates that nominal income gains at the low end of the distribution outperformed the CPI in aggregate -- but only for those with stable employment.
PRACTICAL TOOLS FOR MONITORING YOUR OWN REAL WAGE POSITION -- 2026: US WORKERS: (1) BLS CPI Inflation Calculator: bls.gov/data/inflation_calculator.htm -- enter any dollar amount in any month and see its current real value. Use to verify whether your last pay rise beat inflation. (2) USAFacts Wage Tracker: usafacts.org -- monthly updates on nominal and real wage growth by state and nationally. Check your state against the national average. (3) BLS Occupational Employment Statistics: bls.gov/oes -- see median wages by occupation in your area to benchmark your current salary. (4) FRED (St. Louis Fed): fred.stlouisfed.org -- real personal income, real wages, and CPI data in one freely accessible database. UK WORKERS: (1) ONS Average Weekly Earnings bulletin: ons.gov.uk -- released monthly, covering nominal and real AWE. Most recent: June 18, 2026. (2) ONS ASHE (Annual Survey of Hours and Earnings): most recent April 2025, published November 2025. Benchmark salary by occupation and region. (3) CareerMetrics UK salary checker: careermetrics.co.uk -- 520 UK occupations with real ONS data. (4) Bank of England Inflation Calculator: bankofengland.co.uk -- calculates real value of any historical amount in current pounds. GLOBAL: (5) OECD Wage Bulletin: oecd.org/employment/wage-bulletin -- quarterly real wage data for 35+ countries. Check where your country sits in the global real wage league table.
HOW TO CHECK IF YOUR SALARY IS KEEPING UP WITH INFLATION IN 2026: STEP 1 -- FIND YOUR INFLATION RATE: US: BLS CPI (bls.gov) -- current rate 3.5% (year to June 2026, USAFacts). UK: ONS CPI -- 2.8% (May 2026, Statista/ONS). STEP 2 -- CALCULATE YOUR NOMINAL PAY RISE: If your salary went from $50,000 to $51,900 -- that is a 3.8% nominal increase. STEP 3 -- SUBTRACT INFLATION: US worker: 3.8% minus 3.5% = +0.3% real. Real gain: approximately $150 on $50,000. UK worker: 3.8% minus 2.8% = +1.0% real. Real gain: approximately £390 on £39,000. STEP 4 -- CHECK YOUR STATE/REGION: USAFacts (July 2026): 45 states have negative real wage growth. If your state is among the 45, your local inflation may be outpacing your wages even if the national figure says otherwise. Locally, food, housing and energy prices are the most relevant indicators. STEP 5 -- BENCHMARK YOUR OCCUPATION: Use BLS OES (US) or ONS ASHE (UK) to see whether your nominal wage is also falling relative to your occupation median -- a signal that you may need to change jobs to restore both nominal and real purchasing power.
Conclusion
The survey and official data agree: average income in real terms has fallen significantly since 2021 and the recovery is thin, geographically uneven, and fragile. US real hourly earnings remain 0.7% below their January 2021 level despite four and a half years of strong nominal wage growth. Forty-five of fifty US states saw negative real wage growth in the year to June 2026, according to USAFacts (July 23, 2026 -- the most current official data). Real wages in May 2026 are back to their January 2025 level, with 13 months of gains erased by three months of re-accelerating inflation (TAMU PERC, June 11, 2026).The UK position is marginally better in the most recent reading -- Statista (July 21, 2026) shows nominal wages at +3.4% against CPI of 2.8% in the three months to May 2026 -- but this thin positive margin follows five years of below-inflation wage settlements that left workers, in Moving to UK's phrase, 'just beginning to break even in purchasing power terms.' The longer-run picture is sobering: Clever Accounts (April 2026) documents that UK real wages have grown just 16% over 25 years while housing has grown 267%. Globally, the OECD (Metaintro, May 2026) found real wages below 2021 levels in half of 35+ developed economies, with growth decelerating from 3.6% to 1.8% between Q3 2024 and Q3 2025.
The individual response to these conditions is not to accept them as fixed. Voluntary job changes typically outperform employer-provided pay rises by 10-20 percentage points. Geographic mobility within the US can shift a worker from a -5.1% real wage state (Minnesota) to a +5.9% state (New Mexico). Salary benchmarking against BLS and ONS data surfaces gaps between current pay and market rate. And above all: understanding the difference between nominal and real wages -- and checking your own position against the current CPI -- converts economic headlines into actionable personal information. The data says income is down in real terms for the majority. That is not the end of the story.
Frequently Asked Questions (FAQ)
Are real wages rising or falling in the US in 2026?The most current official data (USAFacts, updated July 23, 2026 -- refreshed monthly) shows that nationally, US nominal wages grew 3.8% in the year to June 2026 while inflation stood at 3.5%, producing a +0.29% real wage gain -- approximately $4 per week in real purchasing power. However, this national average conceals dramatic geographic variation. USAFacts (July 2026): 'In 45 states and Washington DC, real wage growth was negative, meaning wages did not keep up with inflation.' Only five states (including New Mexico at +5.9%) saw positive real wage growth in the most recent 12-month period. Additionally, TAMU PERC (June 11, 2026) documents that real wages in May 2026 are back to their January 2025 level, as three months of inflation acceleration erased 13 months of real wage gains. The honest answer: nationally, US real wages are barely positive in the most recent reading -- but in 45 of 50 states, and as of May 2026, real wages are negative or flat. The long-run picture is worse: Visual Capitalist (September 2025, BLS data): real hourly earnings are down 0.7% from January 2021 to July 2025, despite 21.8% nominal growth and against 22.7% CPI inflation.
Are UK real wages rising or falling in 2026?
The UK picture in 2026 is marginally positive in the most recent reading but historically weak. Statista (July 21, 2026 -- 3 weeks ago, citing ONS): 'In the three months to May 2026, average weekly earnings in the United Kingdom grew by 3.4 percent. In the same month, the CPI inflation rate was 2.8 percent, indicating that wages were rising slightly faster than prices.' This produces a real wage gain of approximately 0.6 percentage points -- a narrow positive margin. Earlier in 2026 it was even thinner: CareerMetrics (March 20, 2026): 'ONS data shows average earnings growth fell to 3.8% in the three months to January 2026, the weakest since late 2020.' Adjusted for inflation, real wage growth in January 2026 was just 0.4% (Statista UK, March 2026). The ONS AWE Bulletin (June 18, 2026) reports average weekly earnings of £697 regular pay and £753 total pay in April 2026 -- both figures in nominal terms. Moving to UK (2 weeks ago, most current): 'After years of real wages stagnating or falling, workers are just beginning to break even in purchasing power terms.' The UK experienced 20 months of falling real wages from November 2021 to June 2023 (Statista, ONS historical data). Recovery since then has been slow and is not yet complete in a purchasing power sense for many workers, given that housing has inflated 267% against 16% real wage growth over 25 years (Clever Accounts, April 2026).
What does it mean for income to fall in real terms?
Income falling in real terms means that your paycheck, adjusted for inflation, buys less than it did before -- even if the number on your payslip has increased. The mechanism is straightforward: if your salary rises from $50,000 to $51,500 (a 3% nominal increase) but the Consumer Price Index rises by 4% in the same period, your purchasing power has declined. You earn more dollars, but those dollars buy fewer goods and services. Visual Capitalist (September 2025, BLS): 'Average hourly earnings increased by 21.8% from January 2021 to July 2025. Meanwhile, the Consumer Price Index rose 22.7% over the same period, leaving real wages -- the amount adjusted for inflation -- still down 0.7%.' The nominal figure (21.8% increase) looks strong. The real figure (-0.7% over four and a half years) tells the true story. This is what makes real terms the correct measure of whether living standards are improving or declining: nominal wage increases that lag inflation produce a mathematical decline in what money can buy, regardless of what the number on the payslip says. The BLS CPI Inflation Calculator (bls.gov/data/inflation_calculator.htm) allows anyone to calculate the real value of any historical dollar amount -- a practical tool for verifying whether a specific pay rise beat or lost to inflation.
Why do workers feel worse off even when official data shows wage growth?
The gap between what official data shows and what workers feel is the central tension in the 2026 real wages debate, and it has several explanations. First, geographic dispersion: USAFacts (July 23, 2026): 45 of 50 US states saw negative real wage growth in the year to June 2026. A worker in Minnesota with -5.1% real wage growth does not feel the national average of +0.29%. Second, the housing problem: Clever Accounts (April 2026): 'Real wages have grown by 16% [in 25 years], but housing has grown by 267%.' When housing -- the largest unavoidable expenditure for most households -- inflates vastly faster than wages, the average CPI figure understates the lived experience for renters and recent homebuyers. Third, the cumulative deficit: TAMU PERC (June 2026): 'The purchasing power of real wages never quite made it back to the level of January 2021 while President Biden was in office.' A +0.3% real gain in the most recent year does not erase a multi-year accumulated purchasing power deficit. Fourth, the distribution problem: TimeTrex (March 2026): 'The gap between average and median wages continues to widen slightly, indicating disproportionate wage growth in the upper economic deciles.' When high earners receive larger nominal increases, the average wage figure rises without reflecting the median worker's experience. Fifth, the measurement paradox documented by the Cleveland Fed (February 2026): even workers whose purchasing power measurably increased -- the bottom 40% by 4.5% from 2019-2024 -- reported declining financial wellbeing in surveys, because the gains were insufficient relative to the structural costs of housing, childcare, and healthcare that dominate their budgets.
How do I know if my own salary has kept up with inflation?
The calculation is straightforward. Identify your salary at two points in time (e.g. January 2024 and August 2026). Calculate the percentage change: (new salary - old salary) / old salary x 100 = your nominal wage growth rate. Then compare this to the CPI change over the same period. US: BLS reports 3.5% CPI inflation in the year to June 2026 (USAFacts, July 23, 2026). UK: ONS reports 2.8% CPI in May 2026 (Statista, July 21, 2026). If your nominal wage growth rate exceeds the CPI change: you have a real wage gain. If it is below: you have a real wage loss, regardless of how large the nominal number looks. Practical tools: the BLS CPI Inflation Calculator at bls.gov/data/inflation_calculator.htm (US); the Bank of England Inflation Calculator at bankofengland.co.uk (UK). Both are free and require only a starting amount and a date range. Additionally, benchmark your salary against market data: BLS Occupational Employment Statistics (bls.gov/oes) for US occupation and geographic wage data, and ONS ASHE (ons.gov.uk) for UK occupation wage data. If your salary has not kept pace with inflation AND is below the median for your occupation: you have both a real wage problem and a market position problem. Both require a negotiation or a job change to address -- macroeconomic conditions alone will not close either gap.

0 Comments Comments