
Investing
Best Small-Cap ETFs to Buy in 2026: Top 7 Ranked
Small-cap stocks entered 2026 at their largest valuation discount to large caps in 30 years. The Russell 2000 has gained 40.8% in the year through June 30, 2026 — nearly double the large-cap benchmark. Small-cap value has crushed growth by 9 percentage points. And one ETF that screens for cheap, profitable small companies has beaten the standard Russell 2000 benchmark by 36 percentage points over five years. This guide covers the seven best small-cap ETFs to buy in 2026: what each one holds, what it costs, who it is for, and exactly how each has performed in the year that small caps finally roared back.
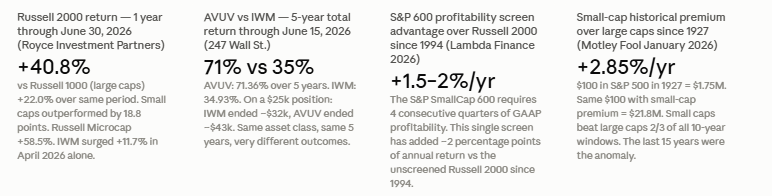
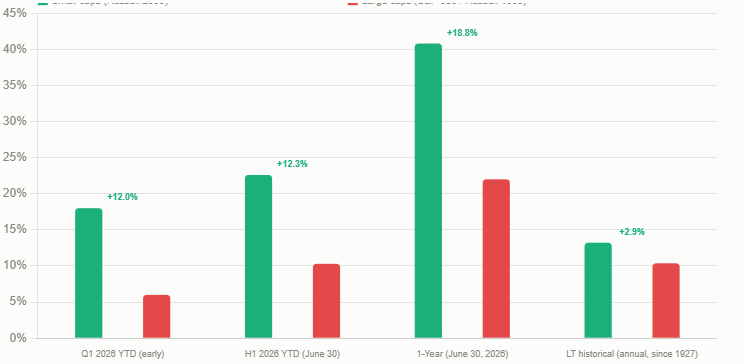
The Russell 2000, which tracks approximately 2,000 of the smallest publicly traded US companies, gained 22.6% in the first half of 2026 and 40.8% in the trailing twelve months through June 30 — nearly double the 22% return of the Russell 1000 large-cap index over the same period, according to Royce Investment Partners' market overview published June 30, 2026. The S&P 500 gained approximately 6% year-to-date in early 2026 while IWM — the flagship Russell 2000 ETF — was up 18% over the same period, a divergence that trade-ideas.com described in February 2026 as not seen since the 2003-2007 small-cap boom. In January 2026, the Russell 2000 outperformed the Nasdaq for 15 consecutive sessions — the longest such streak since 1996.
The reasons for the rotation are structural, not random. Small-cap stocks entered 2026 at their largest valuation discount to large caps in 30 years, with the Russell 2000 trading at a forward P/E of approximately 18x versus 26x for the S&P 500 — a 30% discount at a historically extreme level. As of June 30, 2026, the Russell 2000 accounted for only 4.5% of the Russell 3000's total market capitalisation, versus its long-term average of 7.6%. The companies were cheap, their earnings prospects for 2026 and 2027 were being revised upward faster than large-cap estimates, and the Federal Reserve's rate environment had shifted from a headwind to a tailwind for smaller companies with more floating-rate debt. This guide identifies the seven best ETFs to capture that opportunity.
Russell 2000 YTD gain through June 30, 2026: +22.6%. Russell 2000 1-year gain through June 30, 2026: +40.8% (Royce Investment Partners). IWM surged +11.7% in April 2026 alone. Small caps entered 2026 at largest valuation discount to large caps in 30 years. Russell 2000 forward P/E at start of 2026: 18x vs S&P 500's 26x — 30% discount. Small caps have outperformed large caps by 2.85%/year since 1927 (Motley Fool January 2026). For every 10-year window, small caps beat large caps two-thirds of the time. AVUV beat IWM by 36 percentage points over 5 years through June 15, 2026 (247 Wall St.).
A small-cap ETF pools money from many investors to purchase a basket of these smaller stocks, typically tracking an index that defines the small-cap universe. The two most widely used small-cap indexes are the Russell 2000 (which contains approximately 2,000 of the smallest stocks in the Russell 3000) and the S&P SmallCap 600 (which applies a quality screen requiring four consecutive quarters of GAAP profitability before a company can be included). The choice of index is one of the most important investment decisions in this category — and the S&P 600's profitability screen has historically made a meaningful difference.
If you already own a total market fund like VTI (Vanguard Total Stock Market ETF), you already have small-cap exposure: approximately 7% of VTI's holdings are small-cap stocks. A dedicated small-cap ETF is a deliberate tilt toward smaller companies — an intentional overweight relative to market cap, not a gap being filled, as ETF BFF's May 2026 guide notes explicitly. Understanding whether you want broad market exposure or a deliberate small-cap tilt is the first question to answer before choosing among the seven ETFs in this guide.
The single most important design choice in a small-cap ETF is the profitability screen. The S&P SmallCap 600, tracked by IJR, requires four consecutive quarters of GAAP profitability before including a company. The Russell 2000 has no such requirement — it includes any company of the right size regardless of whether it is profitable. Lambda Finance's 2026 analysis of all major small-cap ETFs states directly: 'That single rule has historically added 1.5-2 percentage points a year vs the unscreened Russell 2000.' Over a 30-year investing horizon, the compounding difference between 8% and 10% annual return is enormous. The screen matters.
The practical impact of the screen is quantified clearly in Lambda Finance's 2026 comprehensive comparison: the S&P 600's profitability requirement has added approximately 1.5 to 2 percentage points of annualised return versus the unscreened Russell 2000 since 1994. ETF Beacon's July 2026 ranking calls IJR its top pick for long-term small-cap exposure: 'The S&P SmallCap 600 Index's profitability requirement filters out money-losing speculative companies that drag on returns. This quality screen has given IJR a meaningful performance edge over the Russell 2000 historically, making it the smartest choice for buy-and-hold investors who want small-cap exposure.'
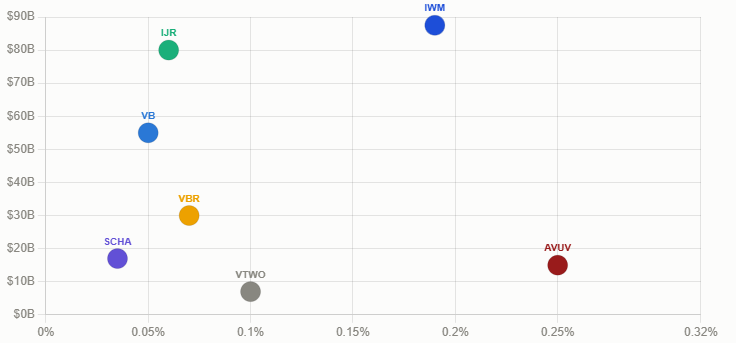
On cost, IJR charges 0.06% per year — just $6 per $10,000 invested annually. AUM stands at approximately $80 billion, making it one of the largest small-cap ETFs in the world. With 600 holdings, the portfolio is concentrated enough to skip the pre-revenue biotech and speculative names that populate the lower end of the Russell 2000, while remaining diversified enough to avoid single-stock concentration risk. In 2026, IJR outperformed IWM over certain periods, including a 4.53% gain versus IWM's 2.26% in specific windows noted by intellectia.ai in April 2026.
IJR at a glance. Ticker: IJR. Index: S&P SmallCap 600. Expense ratio: 0.06%/year. AUM: approximately $80 billion. Holdings: 600. Profitability screen: YES (4 consecutive quarters of GAAP profitability required). 2026 performance: outperformed IWM in multiple measured periods. Historical advantage: ~2% annual outperformance vs Russell 2000 since 1994 (Lambda Finance 2026). Best for: long-term buy-and-hold investors who want the highest-quality small-cap exposure at a very low cost. Source: iShares; Lambda Finance 2026; ETF Beacon July 2026; intellectia.ai April 2026. Not financial advice.
IJR: Best overall small-cap ETF for long-term investors in 2026. The S&P 600 profitability screen is the most important feature — it has historically delivered 1.5-2% additional annual return vs the Russell 2000 by excluding unprofitable speculative companies. At 0.06% expense ratio and $80B AUM, it combines quality screening with institutional-grade liquidity and very low cost. The primary trade-off: 600 holdings vs 2,000 in Russell 2000 ETFs means slightly less exposure to the very smallest and most speculative end of the market.
IWM tracks the Russell 2000 Index, which contains approximately 2,000 of the smallest stocks in the Russell 3000. It is the most liquid small-cap ETF by a significant margin — its daily trading volume, depth of options market, and bid-ask spread tightness make it the tool of choice for institutional investors, hedge funds, and anyone who needs to enter or exit a large small-cap position quickly. ETF Beacon's July 2026 analysis frames it this way: 'IWM is the small-cap ETF of choice for active traders and institutional investors.'
The performance case for IWM in 2026 is strong in absolute terms: the fund has delivered approximately 18-20% year-to-date depending on the measurement date, with a particularly impressive +11.7% surge in April 2026 alone. Over the 30 years through March 2026, IWM delivered an 8.55% compound annual return, according to Kavout's June 2026 analysis. The Motley Fool / Nasdaq January 2026 article cites an 8.05% average annual return since its May 2000 inception.
The structural trade-off in IWM is the lack of a profitability screen. The Russell 2000 includes every company in its size range regardless of financial quality — pre-revenue biotech, cash-burning technology startups, and zombie companies that survive on low interest rates are all included at market weight. This 'junk drag' is the reason analysts like those at Lambda Finance and 247 Wall St. recommend IJR or AVUV for long-term buy-and-hold investors, while recommending IWM specifically for tactical or trading use.
IWM at a glance. Ticker: IWM. Index: Russell 2000. Expense ratio: 0.19%/year. AUM: approximately $85-$90 billion (largest small-cap ETF by AUM). Holdings: approximately 2,000. Profitability screen: NO. 5-year return through June 15, 2026: 34.93% (vs AVUV's 71.36%). 30-year compound annual return: 8.55%. 2026 April surge: +11.7%. Best for: active traders, options strategies, short-term tactical allocation, institutional-scale liquidity. Source: Kavout June 26, 2026; 247 Wall St. June 21, 2026; ETF Beacon July 2026. Not financial advice.
At 0.05% per year — just $5 per $10,000 invested annually — VB is among the cheapest small-cap ETFs available. Its $55 billion in AUM puts it in the institutional-grade tier. One specific structural advantage: VB includes companies that bridge the gap into mid-cap territory, which ETF investsnips.com's June 2026 guide notes makes VB slightly less volatile than a pure-play small-cap fund like IJR. For investors using Vanguard as their primary brokerage platform, VB is a natural core holding with Vanguard's characteristically low turnover rate and tax efficiency in taxable accounts.
The distinction between VB and its Vanguard sibling SCHA (the Schwab fund) is minimal in practice. Both are extremely low-cost, both cast wide nets across the small-cap universe, and their performance tracks closely. VB charges 0.05% and SCHA charges 0.03-0.04%, with SCHA holding approximately 1,800 stocks versus VB's 1,400. My ETF Journey's 2026 analysis cites SCHA's 10.50% 5-year annualised return at a beta of 1.18 as the best risk-adjusted performance in the category.
VB is for: long-term investors who want the broadest possible small-cap exposure at very low cost, use Vanguard as their primary platform, or want a tax-efficient holding in a taxable brokerage account. The slightly higher mid-cap overlap vs pure small-cap funds like IJR means slightly lower volatility, which makes VB a good choice for investors who want small-cap exposure without the maximum volatility of the pure-play small-cap universe. Not financial advice.
The Motley Fool's May 2026 showdown between SCHA and IJR frames the distinction clearly: 'The Schwab fund casts a wide net across nearly the entire small-cap universe, while the iShares fund focuses on a more selective set of companies that must meet S&P's specific financial viability standards.' SCHA's breadth means it captures every segment of the small-cap universe — including pre-revenue companies and speculative names that IJR's screen excludes — which makes it a better vehicle for investors who want pure small-cap market beta at the lowest possible cost.
investsnips.com's June 2026 assessment describes SCHA's 2026 performance as 'exceptional, benefiting from the widest possible net during the sector's recovery.' When small caps broadly rally, as they have in 2026, a broader index like SCHA's can capture more of the upswing. In 2026's environment where even lower-quality small companies have participated in the rally, breadth has been an advantage. For Schwab clients or any investor who wants the cheapest institutional-grade small-cap exposure available, SCHA is the natural choice.
SCHA: Best for pure cost minimisation and maximum breadth. At 0.03-0.04% expense ratio, it is effectively free. 1,800 holdings covers more than the Russell 2000. Performance in 2026 was exceptional benefiting from broadest possible coverage during sector recovery. Trade-off: no profitability screen; includes the full spectrum including pre-revenue companies. For Schwab clients, it may also carry transaction cost advantages on the platform. Source: Motley Fool May 2026; investsnips.com June 2026; My ETF Journey 2026. Not financial advice.
In 2026, the value tilt has been rewarding. Small-cap value crushed small-cap growth by 9 percentage points in 2026, according to 247 Wall St.'s June 2, 2026 analysis. VBR returned 11% year-to-date and 26% over the trailing year as of the June 2026 analysis. These are exceptional results in absolute terms, even as they lagged the more targeted value funds AVUV and IJS in the same period.
247 Wall St.'s factor analysis identifies exactly why VBR lagged AVUV in a year when small-cap value was working: 'VBR is the broadest and cheapest option, and its 2026 performance shows what happens when a factor is delivering, and a fund's screen is loose.' VBR uses a multifactor value definition but includes a wider range of names and a weaker profitability filter than either AVUV or IJS. That dilutes the value factor signal. The trade-off is explicit: VBR offers the lowest holding cost (0.07%) and broadest diversification in the value category, but gives up some incremental return when the value premium is concentrated in the highest-quality names — as it was in 2026.
VBR at a glance. Ticker: VBR. Index: CRSP US Small Cap Value Index. Expense ratio: 0.07%/year. 2026 YTD return: +11%. Trailing 1-year return: +26% (247 Wall St. June 2, 2026). Holdings: several hundred (value-screened subset of CRSP small cap universe). vs AVUV: VBR is cheaper (0.07% vs 0.25%) and more diversified; AVUV has stronger profitability screen and better 2026 and 5-year performance. vs IJS: IJS (iShares S&P Small-Cap 600 Value) is the middle path per 247 Wall St. Not financial advice.
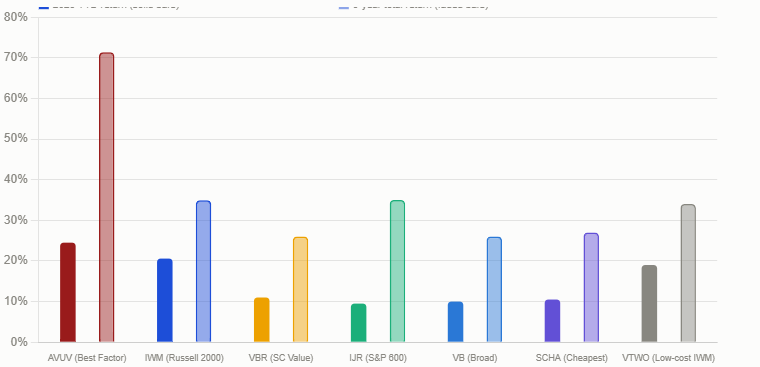
The 2026 performance case for AVUV is extraordinary. Year-to-date through mid-2026, AVUV returned 24.50% versus 20.58% for IWM — outperforming the benchmark by nearly 4 percentage points, according to 247 Wall St.'s July 17, 2026 analysis. But the five-year comparison is the headline number: AVUV returned 71.36% over the five years through June 15, 2026, versus IWM's 34.93% — beating the Russell 2000 benchmark by 36.43 percentage points over half a decade, per 247 Wall St.'s June 21, 2026 analysis. On a $25,000 starting position, the IWM holder finished around $32,000 while the AVUV holder finished around $43,000. Same asset class, same five years, very different outcomes.
AVUV trades at a P/E of 12.23x and a price-to-book ratio of 1.41x — dramatically cheaper than the S&P 500 and significantly cheaper than the broader Russell 2000 — because its screen deliberately concentrates in the cheapest, most profitable companies in the small-cap universe. The fund launched in 2019 and has outperformed VB (its closest passive peer) since inception, though 247 Wall St. notes the sample period is short.
The cost is the primary trade-off. AVUV charges 0.25% per year — 2.5 times what IJR charges (0.06%) and more than 8 times what SCHA charges (0.03%). For an investor with $100,000 in AVUV versus $100,000 in IJR, the annual cost difference is $190. Whether AVUV's historical outperformance justifies that ongoing cost premium is the central question — and 247 Wall St.'s June 2026 analysis argues that for investors who believe in the small-cap value factor, it does: 'AVUV has the best recent record but you're paying active management fees against a factor that may not persist.'
AVUV: Best factor performance of any small-cap ETF in 2026. 5-year return through June 15, 2026: 71.36% (vs IWM 34.93%). YTD 2026: +24.50% (vs IWM 20.58%). Strongest academic tilt: actively managed systematic screen for small + cheap + profitable. Best for: investors who strongly believe in the small-cap value premium and are willing to pay 0.25% for the tightest possible factor screen. The 2026 data makes the strongest case this factor has made in years. Not financial advice.
The trade-off for the lower fee is less liquidity. IWM's massive daily trading volume and deep options market make it the preferred instrument for institutional investors, active traders, and anyone using options strategies around small-cap exposure. VTWO, while perfectly liquid for individual investors making long-term purchases, does not have the same derivatives ecosystem that makes IWM the institutional default.
For individual investors with a long-term, buy-and-hold approach to small-cap exposure who want Russell 2000 index methodology (rather than the S&P 600's quality screen), VTWO is the smarter cost choice. The 0.09% annual fee saving relative to IWM amounts to $90 per year on a $100,000 position — a genuine saving that compounds over decades without any difference in index methodology or portfolio composition.
VTWO is for: individual long-term investors who want Russell 2000 exposure at lower cost than IWM, do not need IWM's institutional liquidity or options market depth, and are not actively trading their small-cap position. If you are buying to hold for 5-20 years, the fee saving vs IWM is real and meaningful over time. If you are actively trading, hedging with options, or need institutional-scale liquidity, use IWM. Not financial advice. Expense ratios change — verify current pricing at Vanguard.com.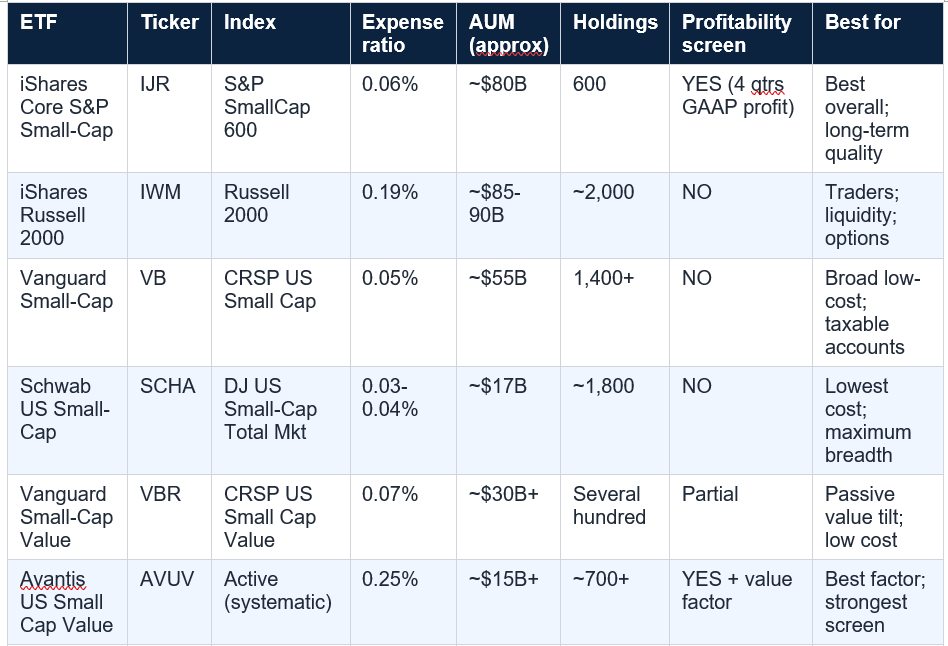

AUM figures are approximations from published 2026 sources and fluctuate daily with market movements. Expense ratios verified from published 2026 sources but can change — always verify at the fund's official website before investing. 'Best for' descriptions are simplifications — always read the fund prospectus and consult a financial adviser. Not financial advice.
Small-cap stocks are significantly more volatile than large-cap stocks and are subject to greater business risk, liquidity risk, and economic sensitivity. IWM's 30-year standard deviation is 20.19% versus the S&P 500's lower figure. In recessions and credit contractions, small caps typically underperform severely before recovering. The 2026 outperformance does not guarantee continued outperformance. The 15-year period of large-cap dominance from 2010 to 2025 — itself historically anomalous — demonstrates that the small-cap premium is not guaranteed in any given decade. Investors should allocate to small caps only with capital they can hold through extended periods of underperformance. Not financial advice.
The seven ETFs in this guide represent the full spectrum of small-cap investment philosophy: from the quality-screened IJR at 0.06% for the careful long-term investor, to the factor-focused AVUV at 0.25% for the academically-oriented value investor, to the brutally cheap SCHA at 0.03% for the cost-obsessed index purist, to the institutional-liquidity-first IWM for the active trader. Each is the right tool for a different type of investor.
The best small-cap ETF is the one you will actually hold through the inevitable corrections, the quarter when small caps underperform by 15%, the year when the tech giants start their next run and everyone wonders if the rotation is over. Small caps have outperformed large caps by 2.85% per year since 1927, but that premium has come bundled with significantly higher volatility — 20.19% annualised standard deviation for IWM over 30 years versus a lower figure for the S&P 500. The investor who buys the right fund but sells at the wrong time captures none of the premium. Conviction about the holding matters as much as the ticker selection.
Not financial advice. All investments involve risk including possible loss of principal. Past performance is not indicative of future results. Consult a qualified financial adviser before investing.
For most long-term buy-and-hold investors, IJR (iShares Core S&P Small-Cap ETF) is the consensus top recommendation in 2026. It tracks the S&P SmallCap 600 Index, which applies a profitability screen requiring four consecutive quarters of GAAP profitability before including a company. Lambda Finance's 2026 analysis notes this screen has historically added approximately 1.5 to 2 percentage points of annual return versus the unscreened Russell 2000 since 1994, while IJR charges just 0.06% per year with approximately $80 billion in AUM. For investors who believe strongly in the small-cap value factor and want the most aggressive factor screen, AVUV (Avantis U.S. Small Cap Value ETF) has the strongest recent performance record — 71.36% over five years through June 15, 2026 versus IWM's 34.93% — but costs 0.25% per year. For pure cost minimisation with maximum breadth, SCHA at 0.03-0.04% is the cheapest option. Not financial advice.
What is the difference between IJR and IWM?
The most important difference is the index each fund tracks and whether it applies a profitability screen. IJR tracks the S&P SmallCap 600, which requires companies to report four consecutive quarters of GAAP profitability before inclusion — filtering out money-losing speculative companies. IWM tracks the Russell 2000, which has no such requirement and includes any company of the right size regardless of profitability. This distinction matters enormously over time: the S&P 600's screen has historically added approximately 2 percentage points of annual outperformance versus the Russell 2000 since 1994 (Lambda Finance 2026). IWM is the better choice for active traders and institutional investors who need deep liquidity and a robust options market. IJR is the better choice for long-term buy-and-hold investors who want quality screening. IJR charges 0.06%; IWM charges 0.19%. Not financial advice.
Have small-cap stocks outperformed in 2026?
Yes — substantially. The Russell 2000 returned 22.6% year-to-date through June 30, 2026, and 40.8% over the trailing twelve months through that date, according to Royce Investment Partners' June 30, 2026 US Small Cap Market Overview. That compares to 22.0% for the Russell 1000 (large caps) over the same one-year period — a significant outperformance. IWM, the Russell 2000's flagship ETF, surged 11.7% in April 2026 alone. The 'Great Rotation' of 2026 saw the Russell 2000 outperform the Nasdaq for 15 consecutive sessions in January 2026, the longest such streak since 1996. Small caps entered 2026 at their largest valuation discount to large caps in 30 years, which created the conditions for the rotation. AVUV returned 24.50% YTD through mid-2026 versus IWM's 20.58% in the same period. Not financial advice — past performance is not indicative of future results.
How has AVUV performed compared to IWM?
AVUV has significantly outperformed IWM over both short and longer-term periods measured through 2026. Year-to-date through mid-2026: AVUV returned 24.50% versus IWM's 20.58% (247 Wall St. July 17, 2026). Over three years annualised: AVUV returned 18.25%. Over five years annualised: AVUV returned 14.00%. Over the five-year period through June 15, 2026 on a total return basis: AVUV returned 71.36% versus IWM's 34.93% — outperforming by 36.43 percentage points (247 Wall St. June 21, 2026). On a $25,000 starting position over those five years: the IWM investor finished around $32,000 while the AVUV investor finished around $43,000. The trade-off: AVUV charges 0.25% per year versus IWM's 0.19%, and AVUV launched in 2019, giving a shorter performance history than IWM. AVUV is actively managed and its outperformance reflects its systematic tilt toward small, cheap, profitable companies — the small-cap value factor. Not financial advice. Past performance is not indicative of future results.
Do I need a small-cap ETF if I already own VTI?
Not necessarily — and this is an important point that many investors overlook. VTI (Vanguard Total Stock Market ETF) already holds small-cap stocks: approximately 7% of VTI's portfolio is in small-cap names, at their natural market-cap weight. A dedicated small-cap ETF is a deliberate overweight tilt toward smaller companies, not a gap that VTI leaves unfilled. As ETF BFF's May 2026 guide states: 'A dedicated small-cap ETF is a deliberate tilt, not a gap-fill.' If you believe small caps will outperform over your investment horizon and want more exposure than market weight provides, adding IJR, SCHA, or AVUV alongside VTI makes sense as a deliberate overweight. If you are satisfied with market-weight small-cap exposure and do not want to take an active view on the small-cap factor, VTI alone is sufficient. Not financial advice — consult a financial adviser about appropriate asset allocation for your situation.
Table of Contents
- Why 2026 Is the Year Small Caps Finally Came Back
- What Is a Small-Cap ETF? The Basics You Need to Know
- ETF #1 — IJR: iShares Core S&P Small-Cap ETF (Best Overall)
- ETF #2 — IWM: iShares Russell 2000 ETF (Best for Liquidity and Trading)
- ETF #3 — VB: Vanguard Small-Cap ETF (Best for Broad, Low-Cost Exposure)
- ETF #4 — SCHA: Schwab U.S. Small-Cap ETF (Best Expense Ratio)
- ETF #5 — VBR: Vanguard Small-Cap Value ETF (Best Passive Value Tilt)
- ETF #6 — AVUV: Avantis U.S. Small Cap Value ETF (Best Factor Performance)
- ETF #7 — VTWO: Vanguard Russell 2000 ETF (Best Low-Cost IWM Alternative)
- Side-by-Side Comparison: All Seven ETFs at a Glance
- The Case for Small Caps in 2026: Valuation, Earnings, and the Great Rotation
- How to Choose the Right Small-Cap ETF for Your Portfolio
- Conclusion: The Best Small-Cap ETF Is the One You Will Hold Through the Volatility
- Frequently Asked Questions
Performance: 2026 YTD And 5 -Year Returns By ETF
Cost and size: expense ratios, AUM, holdings
The 2026 rotation: small caps vs large caps context
Why 2026 Is the Year Small Caps Finally Came Back
For fifteen years, small-cap stocks underperformed large-cap stocks. The Russell 2000 trailed the S&P 500 for more than a decade as a handful of mega-cap technology companies dominated market returns, attracted institutional capital, and inflated large-cap valuations to levels that had not been seen since the dot-com bubble. Then 2026 happened.The Russell 2000, which tracks approximately 2,000 of the smallest publicly traded US companies, gained 22.6% in the first half of 2026 and 40.8% in the trailing twelve months through June 30 — nearly double the 22% return of the Russell 1000 large-cap index over the same period, according to Royce Investment Partners' market overview published June 30, 2026. The S&P 500 gained approximately 6% year-to-date in early 2026 while IWM — the flagship Russell 2000 ETF — was up 18% over the same period, a divergence that trade-ideas.com described in February 2026 as not seen since the 2003-2007 small-cap boom. In January 2026, the Russell 2000 outperformed the Nasdaq for 15 consecutive sessions — the longest such streak since 1996.
The reasons for the rotation are structural, not random. Small-cap stocks entered 2026 at their largest valuation discount to large caps in 30 years, with the Russell 2000 trading at a forward P/E of approximately 18x versus 26x for the S&P 500 — a 30% discount at a historically extreme level. As of June 30, 2026, the Russell 2000 accounted for only 4.5% of the Russell 3000's total market capitalisation, versus its long-term average of 7.6%. The companies were cheap, their earnings prospects for 2026 and 2027 were being revised upward faster than large-cap estimates, and the Federal Reserve's rate environment had shifted from a headwind to a tailwind for smaller companies with more floating-rate debt. This guide identifies the seven best ETFs to capture that opportunity.
Russell 2000 YTD gain through June 30, 2026: +22.6%. Russell 2000 1-year gain through June 30, 2026: +40.8% (Royce Investment Partners). IWM surged +11.7% in April 2026 alone. Small caps entered 2026 at largest valuation discount to large caps in 30 years. Russell 2000 forward P/E at start of 2026: 18x vs S&P 500's 26x — 30% discount. Small caps have outperformed large caps by 2.85%/year since 1927 (Motley Fool January 2026). For every 10-year window, small caps beat large caps two-thirds of the time. AVUV beat IWM by 36 percentage points over 5 years through June 15, 2026 (247 Wall St.).
What Is a Small-Cap ETF? The Basics You Need to Know
A small-cap stock is a publicly traded company with a market capitalisation — the total value of all its outstanding shares — of roughly $300 million to $2 billion, according to the commonly used industry definition cited by ETF BFF in its May 2026 small-cap ETF guide. Small caps are smaller businesses that move faster and fall harder than household names. They are domestically focused (which protects them from geopolitical and currency risks), tend to carry more floating-rate debt (which makes them more sensitive to interest rates), and historically benefit most when the domestic economy is growing and credit conditions are supportive.A small-cap ETF pools money from many investors to purchase a basket of these smaller stocks, typically tracking an index that defines the small-cap universe. The two most widely used small-cap indexes are the Russell 2000 (which contains approximately 2,000 of the smallest stocks in the Russell 3000) and the S&P SmallCap 600 (which applies a quality screen requiring four consecutive quarters of GAAP profitability before a company can be included). The choice of index is one of the most important investment decisions in this category — and the S&P 600's profitability screen has historically made a meaningful difference.
If you already own a total market fund like VTI (Vanguard Total Stock Market ETF), you already have small-cap exposure: approximately 7% of VTI's holdings are small-cap stocks. A dedicated small-cap ETF is a deliberate tilt toward smaller companies — an intentional overweight relative to market cap, not a gap being filled, as ETF BFF's May 2026 guide notes explicitly. Understanding whether you want broad market exposure or a deliberate small-cap tilt is the first question to answer before choosing among the seven ETFs in this guide.
The single most important design choice in a small-cap ETF is the profitability screen. The S&P SmallCap 600, tracked by IJR, requires four consecutive quarters of GAAP profitability before including a company. The Russell 2000 has no such requirement — it includes any company of the right size regardless of whether it is profitable. Lambda Finance's 2026 analysis of all major small-cap ETFs states directly: 'That single rule has historically added 1.5-2 percentage points a year vs the unscreened Russell 2000.' Over a 30-year investing horizon, the compounding difference between 8% and 10% annual return is enormous. The screen matters.
ETF #1 — IJR: iShares Core S&P Small-Cap ETF (Best Overall)
IJR is the consensus recommendation among analysts for long-term small-cap investing in 2026. It tracks the S&P SmallCap 600 Index, which is the only major small-cap index that applies a profitability screen: companies must report four consecutive quarters of GAAP profitability before being eligible for inclusion. This single structural feature is what separates IJR from every ETF tracking the Russell 2000.The practical impact of the screen is quantified clearly in Lambda Finance's 2026 comprehensive comparison: the S&P 600's profitability requirement has added approximately 1.5 to 2 percentage points of annualised return versus the unscreened Russell 2000 since 1994. ETF Beacon's July 2026 ranking calls IJR its top pick for long-term small-cap exposure: 'The S&P SmallCap 600 Index's profitability requirement filters out money-losing speculative companies that drag on returns. This quality screen has given IJR a meaningful performance edge over the Russell 2000 historically, making it the smartest choice for buy-and-hold investors who want small-cap exposure.'
On cost, IJR charges 0.06% per year — just $6 per $10,000 invested annually. AUM stands at approximately $80 billion, making it one of the largest small-cap ETFs in the world. With 600 holdings, the portfolio is concentrated enough to skip the pre-revenue biotech and speculative names that populate the lower end of the Russell 2000, while remaining diversified enough to avoid single-stock concentration risk. In 2026, IJR outperformed IWM over certain periods, including a 4.53% gain versus IWM's 2.26% in specific windows noted by intellectia.ai in April 2026.
IJR at a glance. Ticker: IJR. Index: S&P SmallCap 600. Expense ratio: 0.06%/year. AUM: approximately $80 billion. Holdings: 600. Profitability screen: YES (4 consecutive quarters of GAAP profitability required). 2026 performance: outperformed IWM in multiple measured periods. Historical advantage: ~2% annual outperformance vs Russell 2000 since 1994 (Lambda Finance 2026). Best for: long-term buy-and-hold investors who want the highest-quality small-cap exposure at a very low cost. Source: iShares; Lambda Finance 2026; ETF Beacon July 2026; intellectia.ai April 2026. Not financial advice.
IJR: Best overall small-cap ETF for long-term investors in 2026. The S&P 600 profitability screen is the most important feature — it has historically delivered 1.5-2% additional annual return vs the Russell 2000 by excluding unprofitable speculative companies. At 0.06% expense ratio and $80B AUM, it combines quality screening with institutional-grade liquidity and very low cost. The primary trade-off: 600 holdings vs 2,000 in Russell 2000 ETFs means slightly less exposure to the very smallest and most speculative end of the market.
ETF #2 — IWM: iShares Russell 2000 ETF (Best for Liquidity and Trading)
IWM is the most famous small-cap ETF in the world, the default instrument for institutional investors and active traders expressing views on the small-cap universe, and the ETF most people mean when they say 'I own small caps.' It has been the benchmark for small-cap performance since its launch in May 2000.IWM tracks the Russell 2000 Index, which contains approximately 2,000 of the smallest stocks in the Russell 3000. It is the most liquid small-cap ETF by a significant margin — its daily trading volume, depth of options market, and bid-ask spread tightness make it the tool of choice for institutional investors, hedge funds, and anyone who needs to enter or exit a large small-cap position quickly. ETF Beacon's July 2026 analysis frames it this way: 'IWM is the small-cap ETF of choice for active traders and institutional investors.'
The performance case for IWM in 2026 is strong in absolute terms: the fund has delivered approximately 18-20% year-to-date depending on the measurement date, with a particularly impressive +11.7% surge in April 2026 alone. Over the 30 years through March 2026, IWM delivered an 8.55% compound annual return, according to Kavout's June 2026 analysis. The Motley Fool / Nasdaq January 2026 article cites an 8.05% average annual return since its May 2000 inception.
The structural trade-off in IWM is the lack of a profitability screen. The Russell 2000 includes every company in its size range regardless of financial quality — pre-revenue biotech, cash-burning technology startups, and zombie companies that survive on low interest rates are all included at market weight. This 'junk drag' is the reason analysts like those at Lambda Finance and 247 Wall St. recommend IJR or AVUV for long-term buy-and-hold investors, while recommending IWM specifically for tactical or trading use.
IWM at a glance. Ticker: IWM. Index: Russell 2000. Expense ratio: 0.19%/year. AUM: approximately $85-$90 billion (largest small-cap ETF by AUM). Holdings: approximately 2,000. Profitability screen: NO. 5-year return through June 15, 2026: 34.93% (vs AVUV's 71.36%). 30-year compound annual return: 8.55%. 2026 April surge: +11.7%. Best for: active traders, options strategies, short-term tactical allocation, institutional-scale liquidity. Source: Kavout June 26, 2026; 247 Wall St. June 21, 2026; ETF Beacon July 2026. Not financial advice.
ETF #3 — VB: Vanguard Small-Cap ETF (Best for Broad, Low-Cost Exposure)
VB is Vanguard's broad small-cap fund and the choice most cited for investors who want comprehensive small-cap coverage at rock-bottom cost with the specific advantages of Vanguard's fund structure. It tracks the CRSP US Small Cap Index, which contains more than 1,400 holdings and provides exposure to essentially the full domestic small-cap universe.At 0.05% per year — just $5 per $10,000 invested annually — VB is among the cheapest small-cap ETFs available. Its $55 billion in AUM puts it in the institutional-grade tier. One specific structural advantage: VB includes companies that bridge the gap into mid-cap territory, which ETF investsnips.com's June 2026 guide notes makes VB slightly less volatile than a pure-play small-cap fund like IJR. For investors using Vanguard as their primary brokerage platform, VB is a natural core holding with Vanguard's characteristically low turnover rate and tax efficiency in taxable accounts.
The distinction between VB and its Vanguard sibling SCHA (the Schwab fund) is minimal in practice. Both are extremely low-cost, both cast wide nets across the small-cap universe, and their performance tracks closely. VB charges 0.05% and SCHA charges 0.03-0.04%, with SCHA holding approximately 1,800 stocks versus VB's 1,400. My ETF Journey's 2026 analysis cites SCHA's 10.50% 5-year annualised return at a beta of 1.18 as the best risk-adjusted performance in the category.
VB is for: long-term investors who want the broadest possible small-cap exposure at very low cost, use Vanguard as their primary platform, or want a tax-efficient holding in a taxable brokerage account. The slightly higher mid-cap overlap vs pure small-cap funds like IJR means slightly lower volatility, which makes VB a good choice for investors who want small-cap exposure without the maximum volatility of the pure-play small-cap universe. Not financial advice.
ETF #4 — SCHA: Schwab U.S. Small-Cap ETF (Best Expense Ratio)
SCHA competes directly with VB as the broadest, cheapest way to own domestic small-cap stocks. At 0.03% to 0.04% per year — depending on the source, tied with SPSM for lowest in the category — SCHA is effectively free for practical purposes: the annual cost of a $10,000 position is $3 to $4. The fund holds approximately 1,800 stocks, making it broader than the Russell 2000 itself.The Motley Fool's May 2026 showdown between SCHA and IJR frames the distinction clearly: 'The Schwab fund casts a wide net across nearly the entire small-cap universe, while the iShares fund focuses on a more selective set of companies that must meet S&P's specific financial viability standards.' SCHA's breadth means it captures every segment of the small-cap universe — including pre-revenue companies and speculative names that IJR's screen excludes — which makes it a better vehicle for investors who want pure small-cap market beta at the lowest possible cost.
investsnips.com's June 2026 assessment describes SCHA's 2026 performance as 'exceptional, benefiting from the widest possible net during the sector's recovery.' When small caps broadly rally, as they have in 2026, a broader index like SCHA's can capture more of the upswing. In 2026's environment where even lower-quality small companies have participated in the rally, breadth has been an advantage. For Schwab clients or any investor who wants the cheapest institutional-grade small-cap exposure available, SCHA is the natural choice.
SCHA: Best for pure cost minimisation and maximum breadth. At 0.03-0.04% expense ratio, it is effectively free. 1,800 holdings covers more than the Russell 2000. Performance in 2026 was exceptional benefiting from broadest possible coverage during sector recovery. Trade-off: no profitability screen; includes the full spectrum including pre-revenue companies. For Schwab clients, it may also carry transaction cost advantages on the platform. Source: Motley Fool May 2026; investsnips.com June 2026; My ETF Journey 2026. Not financial advice.
ETF #5 — VBR: Vanguard Small-Cap Value ETF (Best Passive Value Tilt)
VBR is the passive option for investors who want to tilt their small-cap exposure toward value stocks — companies that trade at lower prices relative to their earnings, book value, or sales than the broader small-cap market. It tracks the CRSP US Small Cap Value Index, which uses a multifactor value definition to identify value-oriented small-cap companies.In 2026, the value tilt has been rewarding. Small-cap value crushed small-cap growth by 9 percentage points in 2026, according to 247 Wall St.'s June 2, 2026 analysis. VBR returned 11% year-to-date and 26% over the trailing year as of the June 2026 analysis. These are exceptional results in absolute terms, even as they lagged the more targeted value funds AVUV and IJS in the same period.
247 Wall St.'s factor analysis identifies exactly why VBR lagged AVUV in a year when small-cap value was working: 'VBR is the broadest and cheapest option, and its 2026 performance shows what happens when a factor is delivering, and a fund's screen is loose.' VBR uses a multifactor value definition but includes a wider range of names and a weaker profitability filter than either AVUV or IJS. That dilutes the value factor signal. The trade-off is explicit: VBR offers the lowest holding cost (0.07%) and broadest diversification in the value category, but gives up some incremental return when the value premium is concentrated in the highest-quality names — as it was in 2026.
VBR at a glance. Ticker: VBR. Index: CRSP US Small Cap Value Index. Expense ratio: 0.07%/year. 2026 YTD return: +11%. Trailing 1-year return: +26% (247 Wall St. June 2, 2026). Holdings: several hundred (value-screened subset of CRSP small cap universe). vs AVUV: VBR is cheaper (0.07% vs 0.25%) and more diversified; AVUV has stronger profitability screen and better 2026 and 5-year performance. vs IJS: IJS (iShares S&P Small-Cap 600 Value) is the middle path per 247 Wall St. Not financial advice.
ETF #6 — AVUV: Avantis U.S. Small Cap Value ETF (Best Factor Performance)
AVUV is the ETF that serious small-cap investors argue about — and for good reason. It is the only actively managed ETF on this list, run by Avantis Investors (a subsidiary of American Century Investments, staffed largely by former Dimensional Fund Advisors researchers). Its mandate is to systematically identify and own small-cap US stocks that are both cheap (high value factor loading) and profitable (high profitability factor loading) — screening far harder on both dimensions than any passive small-cap value index.The 2026 performance case for AVUV is extraordinary. Year-to-date through mid-2026, AVUV returned 24.50% versus 20.58% for IWM — outperforming the benchmark by nearly 4 percentage points, according to 247 Wall St.'s July 17, 2026 analysis. But the five-year comparison is the headline number: AVUV returned 71.36% over the five years through June 15, 2026, versus IWM's 34.93% — beating the Russell 2000 benchmark by 36.43 percentage points over half a decade, per 247 Wall St.'s June 21, 2026 analysis. On a $25,000 starting position, the IWM holder finished around $32,000 while the AVUV holder finished around $43,000. Same asset class, same five years, very different outcomes.
AVUV trades at a P/E of 12.23x and a price-to-book ratio of 1.41x — dramatically cheaper than the S&P 500 and significantly cheaper than the broader Russell 2000 — because its screen deliberately concentrates in the cheapest, most profitable companies in the small-cap universe. The fund launched in 2019 and has outperformed VB (its closest passive peer) since inception, though 247 Wall St. notes the sample period is short.
The cost is the primary trade-off. AVUV charges 0.25% per year — 2.5 times what IJR charges (0.06%) and more than 8 times what SCHA charges (0.03%). For an investor with $100,000 in AVUV versus $100,000 in IJR, the annual cost difference is $190. Whether AVUV's historical outperformance justifies that ongoing cost premium is the central question — and 247 Wall St.'s June 2026 analysis argues that for investors who believe in the small-cap value factor, it does: 'AVUV has the best recent record but you're paying active management fees against a factor that may not persist.'
AVUV: Best factor performance of any small-cap ETF in 2026. 5-year return through June 15, 2026: 71.36% (vs IWM 34.93%). YTD 2026: +24.50% (vs IWM 20.58%). Strongest academic tilt: actively managed systematic screen for small + cheap + profitable. Best for: investors who strongly believe in the small-cap value premium and are willing to pay 0.25% for the tightest possible factor screen. The 2026 data makes the strongest case this factor has made in years. Not financial advice.
ETF #7 — VTWO: Vanguard Russell 2000 ETF (Best Low-Cost IWM Alternative)
VTWO tracks the same Russell 2000 Index as IWM but charges significantly less. At approximately 0.10% per year versus IWM's 0.19%, VTWO offers investors who want Russell 2000 exposure a meaningful cost saving — nearly half the annual fee — for what is effectively the same underlying portfolio. Lambda Finance's 2026 comparison makes the recommendation explicit: 'VTWO is the better Russell 2000 fund than IWM (half the fee, same index).'The trade-off for the lower fee is less liquidity. IWM's massive daily trading volume and deep options market make it the preferred instrument for institutional investors, active traders, and anyone using options strategies around small-cap exposure. VTWO, while perfectly liquid for individual investors making long-term purchases, does not have the same derivatives ecosystem that makes IWM the institutional default.
For individual investors with a long-term, buy-and-hold approach to small-cap exposure who want Russell 2000 index methodology (rather than the S&P 600's quality screen), VTWO is the smarter cost choice. The 0.09% annual fee saving relative to IWM amounts to $90 per year on a $100,000 position — a genuine saving that compounds over decades without any difference in index methodology or portfolio composition.
VTWO is for: individual long-term investors who want Russell 2000 exposure at lower cost than IWM, do not need IWM's institutional liquidity or options market depth, and are not actively trading their small-cap position. If you are buying to hold for 5-20 years, the fee saving vs IWM is real and meaningful over time. If you are actively trading, hedging with options, or need institutional-scale liquidity, use IWM. Not financial advice. Expense ratios change — verify current pricing at Vanguard.com.
Side-by-Side Comparison: All Seven ETFs at a Glance
AUM figures are approximations from published 2026 sources and fluctuate daily with market movements. Expense ratios verified from published 2026 sources but can change — always verify at the fund's official website before investing. 'Best for' descriptions are simplifications — always read the fund prospectus and consult a financial adviser. Not financial advice.
The Case for Small Caps in 2026: Valuation, Earnings, and the Great Rotation
The 2026 small-cap rally is not random noise. It is the convergence of several structural factors that had been building for years and are now unwinding simultaneously.- Valuation discount at 30-year extreme: Small caps entered 2026 at their cheapest relative to large caps in three decades, with the Russell 2000 forward P/E at approximately 18x versus the S&P 500's 26x — a 30% discount. As of June 30, 2026, the Russell 2000 accounted for only 4.5% of the Russell 3000's market capitalisation versus its long-term average of 7.6% (Royce Investment Partners June 2026). These are the conditions that historically precede mean reversion in small-cap performance.
- Earnings growth acceleration: Consensus EPS estimates for the Russell 2000 are considerably higher than for the Russell 1000 for the second half of 2026 and into 2027, according to Royce's June 2026 analysis. Small-cap companies have more operating leverage to domestic economic conditions — when the economy is growing, their earnings grow faster. The current earnings upgrade cycle is disproportionately benefiting the small-cap universe.
- Rate environment shift: Small-cap companies carry proportionally more floating-rate debt than large caps, making them more sensitive to interest rate changes. After years of fighting a headwind from rising rates, the Federal Reserve's rate environment has shifted toward certainty if not outright cuts — providing the first genuine interest rate tailwind for small caps in several years.
- Domestic revenue protection: Small-cap companies derive the vast majority of their revenue domestically. In an environment of geopolitical tensions, tariff uncertainty, and currency volatility, their domestic focus protects them from the global headwinds that affect multinational large caps.
- Historically elevated VIX and subsequent returns: Royce Investment Partners' analysis notes that higher market volatility has historically been associated with stronger subsequent small-cap returns, with 3-year annualised performance rising to an average of 13.2% when the VIX is above certain levels. The elevated VIX environment of 2025-2026 fits this historical pattern.
Small-cap stocks are significantly more volatile than large-cap stocks and are subject to greater business risk, liquidity risk, and economic sensitivity. IWM's 30-year standard deviation is 20.19% versus the S&P 500's lower figure. In recessions and credit contractions, small caps typically underperform severely before recovering. The 2026 outperformance does not guarantee continued outperformance. The 15-year period of large-cap dominance from 2010 to 2025 — itself historically anomalous — demonstrates that the small-cap premium is not guaranteed in any given decade. Investors should allocate to small caps only with capital they can hold through extended periods of underperformance. Not financial advice.
How to Choose the Right Small-Cap ETF for Your Portfolio
No single small-cap ETF is right for every investor. The right choice depends on your investment philosophy, time horizon, tax situation, existing holdings, and conviction about specific factor exposures.- If you want the best long-term risk-adjusted exposure: IJR. The S&P 600's profitability screen has added approximately 2 percentage points annually versus the Russell 2000 since 1994. At 0.06%, it is nearly as cheap as the cheapest alternatives. For a 20-year buy-and-hold investor, the quality screen is worth more than the 3-basis-point fee difference between IJR and SCHA.
- If you want the strongest factor performance and believe in the small-cap value premium: AVUV. The 5-year track record through June 2026 — 71.36% versus IWM's 34.93% — is the most compelling performance data in the small-cap ETF category. The 0.25% fee is higher than passive alternatives but justified by the track record for investors with strong factor conviction.
- If you want maximum breadth at minimum cost: SCHA. At 0.03-0.04%, approximately 1,800 holdings, and exceptional 2026 performance from its breadth capturing the full small-cap rally, SCHA is the choice for pure cost minimisation. VB at 0.05% is the Vanguard equivalent and adds slight mid-cap overlap for marginally lower volatility.
- If you trade actively or need options market access: IWM. No other small-cap ETF approaches IWM's liquidity, options market depth, or institutional trading infrastructure. For tactical or trading purposes, IWM is the default.
- If you want low-cost Russell 2000 exposure and are a long-term holder: VTWO over IWM. Same index, half the fee, appropriate for individual investors who do not need IWM's institutional liquidity.
- If you are already broadly diversified: Think carefully before adding any dedicated small-cap ETF. If you own VTI (total market), you already have approximately 7% small-cap exposure at market weight. A dedicated small-cap ETF adds an intentional overweight tilt — this is appropriate if you deliberately want more small-cap exposure than the market provides, not as a gap-fill.
Conclusion
The 2026 small-cap rally has validated what the data has shown for nearly a century: smaller companies, bought at a sufficient valuation discount, eventually close the gap. After 15 years of large-cap dominance — an historical anomaly that began with the post-2008 technology era and ended with the convergence of cheap valuations, accelerating earnings, and a more supportive rate environment — small caps are back.The seven ETFs in this guide represent the full spectrum of small-cap investment philosophy: from the quality-screened IJR at 0.06% for the careful long-term investor, to the factor-focused AVUV at 0.25% for the academically-oriented value investor, to the brutally cheap SCHA at 0.03% for the cost-obsessed index purist, to the institutional-liquidity-first IWM for the active trader. Each is the right tool for a different type of investor.
The best small-cap ETF is the one you will actually hold through the inevitable corrections, the quarter when small caps underperform by 15%, the year when the tech giants start their next run and everyone wonders if the rotation is over. Small caps have outperformed large caps by 2.85% per year since 1927, but that premium has come bundled with significantly higher volatility — 20.19% annualised standard deviation for IWM over 30 years versus a lower figure for the S&P 500. The investor who buys the right fund but sells at the wrong time captures none of the premium. Conviction about the holding matters as much as the ticker selection.
Not financial advice. All investments involve risk including possible loss of principal. Past performance is not indicative of future results. Consult a qualified financial adviser before investing.
Frequently Asked Questions
What is the best small-cap ETF to buy in 2026?For most long-term buy-and-hold investors, IJR (iShares Core S&P Small-Cap ETF) is the consensus top recommendation in 2026. It tracks the S&P SmallCap 600 Index, which applies a profitability screen requiring four consecutive quarters of GAAP profitability before including a company. Lambda Finance's 2026 analysis notes this screen has historically added approximately 1.5 to 2 percentage points of annual return versus the unscreened Russell 2000 since 1994, while IJR charges just 0.06% per year with approximately $80 billion in AUM. For investors who believe strongly in the small-cap value factor and want the most aggressive factor screen, AVUV (Avantis U.S. Small Cap Value ETF) has the strongest recent performance record — 71.36% over five years through June 15, 2026 versus IWM's 34.93% — but costs 0.25% per year. For pure cost minimisation with maximum breadth, SCHA at 0.03-0.04% is the cheapest option. Not financial advice.
What is the difference between IJR and IWM?
The most important difference is the index each fund tracks and whether it applies a profitability screen. IJR tracks the S&P SmallCap 600, which requires companies to report four consecutive quarters of GAAP profitability before inclusion — filtering out money-losing speculative companies. IWM tracks the Russell 2000, which has no such requirement and includes any company of the right size regardless of profitability. This distinction matters enormously over time: the S&P 600's screen has historically added approximately 2 percentage points of annual outperformance versus the Russell 2000 since 1994 (Lambda Finance 2026). IWM is the better choice for active traders and institutional investors who need deep liquidity and a robust options market. IJR is the better choice for long-term buy-and-hold investors who want quality screening. IJR charges 0.06%; IWM charges 0.19%. Not financial advice.
Have small-cap stocks outperformed in 2026?
Yes — substantially. The Russell 2000 returned 22.6% year-to-date through June 30, 2026, and 40.8% over the trailing twelve months through that date, according to Royce Investment Partners' June 30, 2026 US Small Cap Market Overview. That compares to 22.0% for the Russell 1000 (large caps) over the same one-year period — a significant outperformance. IWM, the Russell 2000's flagship ETF, surged 11.7% in April 2026 alone. The 'Great Rotation' of 2026 saw the Russell 2000 outperform the Nasdaq for 15 consecutive sessions in January 2026, the longest such streak since 1996. Small caps entered 2026 at their largest valuation discount to large caps in 30 years, which created the conditions for the rotation. AVUV returned 24.50% YTD through mid-2026 versus IWM's 20.58% in the same period. Not financial advice — past performance is not indicative of future results.
How has AVUV performed compared to IWM?
AVUV has significantly outperformed IWM over both short and longer-term periods measured through 2026. Year-to-date through mid-2026: AVUV returned 24.50% versus IWM's 20.58% (247 Wall St. July 17, 2026). Over three years annualised: AVUV returned 18.25%. Over five years annualised: AVUV returned 14.00%. Over the five-year period through June 15, 2026 on a total return basis: AVUV returned 71.36% versus IWM's 34.93% — outperforming by 36.43 percentage points (247 Wall St. June 21, 2026). On a $25,000 starting position over those five years: the IWM investor finished around $32,000 while the AVUV investor finished around $43,000. The trade-off: AVUV charges 0.25% per year versus IWM's 0.19%, and AVUV launched in 2019, giving a shorter performance history than IWM. AVUV is actively managed and its outperformance reflects its systematic tilt toward small, cheap, profitable companies — the small-cap value factor. Not financial advice. Past performance is not indicative of future results.
Do I need a small-cap ETF if I already own VTI?
Not necessarily — and this is an important point that many investors overlook. VTI (Vanguard Total Stock Market ETF) already holds small-cap stocks: approximately 7% of VTI's portfolio is in small-cap names, at their natural market-cap weight. A dedicated small-cap ETF is a deliberate overweight tilt toward smaller companies, not a gap that VTI leaves unfilled. As ETF BFF's May 2026 guide states: 'A dedicated small-cap ETF is a deliberate tilt, not a gap-fill.' If you believe small caps will outperform over your investment horizon and want more exposure than market weight provides, adding IJR, SCHA, or AVUV alongside VTI makes sense as a deliberate overweight. If you are satisfied with market-weight small-cap exposure and do not want to take an active view on the small-cap factor, VTI alone is sufficient. Not financial advice — consult a financial adviser about appropriate asset allocation for your situation.

0 Comments Comments