

Investing
$500 vs $1,500 vs $5,000 Invested Monthly: What Changes?

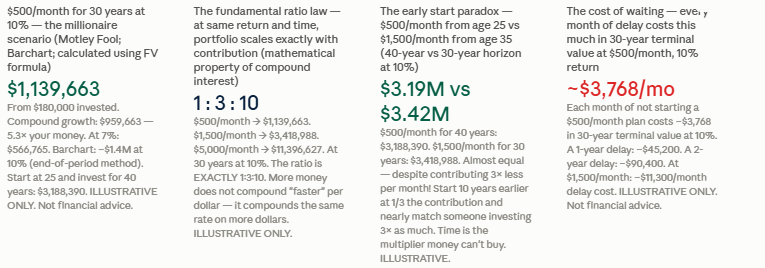
Here's what you get from $500 per month for 30 years at 10% grows to $1,139,663. The same discipline at $1,500 grows to $3,418,988. At $5,000, to $11,396,627. Let me break this down in a more simplier language you can understand. The ratios are exactly 1:3:10 — your final portfolio scales perfectly with your contribution. But here is the insight that changes everything: the $500/month investor who starts at 25 ends up with $3,188,390 by 65 — more than the $1,500/month investor who starts at 35 and ends up with $3,418,988, despite contributing one-third as much per month. In long-term investing, time is the multiplier that money cannot buy back. This article runs every scenario, shows you the numbers, and tells you what actually changes when you change the amount. Not financial advice.
This has a profound practical implication. The difference between investing $500/month and $1,500/month is exactly the same proportional difference at year 1 as it is at year 30. The gap in final portfolio value is driven entirely by the difference in contributions, not by any superior compounding efficiency at higher amounts. What does change is the relationship between contribution amount and time. Adding more money is one lever. Starting earlier is another — and it is the one lever that creates outcomes no amount of extra monthly contribution can replicate after a certain point.
This article runs every combination of the three contribution levels ($500, $1,500, and $5,000 per month) across four time horizons (10, 20, 30, and 40 years) at two return assumptions (7% conservative and 10% historical average), and shows you exactly what changes. The numbers are precise, the methodology is transparent, and the conclusions are grounded in how compound interest actually works. Not financial advice.
Two return assumptions are used throughout. The conservative case uses 7% per year — a widely cited inflation-adjusted real return for a diversified equity portfolio, approximating what the S&P 500 has historically delivered after accounting for inflation (historical S&P 500 nominal returns of approximately 10% minus approximately 3% long-run inflation). The optimistic case uses 10% per year — the approximate long-run nominal annualised return of the S&P 500 over the past three decades, as cited by Motley Fool and consistent with the Morningstar and Wells Fargo Investment Institute data used elsewhere in this series. The 30-year annualised return of the S&P 500 from 1995 to 2025 for a fully invested portfolio was 8.45% (Wells Fargo Investment Institute 2025, cited Masterworks June 2026). Real 2025 full-year S&P 500 return: +17.88% (Hartford Funds, January 2026).
All projections assume no taxes on investment gains (applicable in a Roth IRA or other tax-free account), no fees (which in a VOO or equivalent low-cost index ETF are 0.03–0.05%), and consistent contributions throughout. In reality, returns vary year to year, fees reduce outcomes, taxes may apply (depending on account type), and contributions are sometimes paused. The purpose of these projections is to illuminate the structural relationship between contribution amount, time, and return — not to provide a personalised financial forecast. Not financial advice.
S&P 500 return context: nominal 10-year CAGR 2010-2025 approximately 12.1% (AlphaTechFinance 2026); 30-year fully invested 1995-2025: 8.45% annualised (Wells Fargo Investment Institute 2025; Masterworks June 2026); full-year 2025: +17.88% (Hartford Funds CCWP174 January 2026). Conservative case: 7% real/inflation-adjusted return. S&P 500 historical nominal average (30+ years): approximately 10% (Motley Fool; Barchart). Barchart $500/month at 30 years: ~$922,237 at 8%, ~$1,139,663 at 9%, ~$1,415,114 at 10%. Not financial advice. Past performance does not predict future results.
The 10-year milestone ($103,276 at 10%) is modest but real: the total invested is $60,000, and compounding has added $43,276 in growth. But the compounding curve is still in its early stages at 10 years. The 20-year milestone ($382,848) is where the growth trajectory begins to visibly accelerate: $262,848 in compound growth on $120,000 invested. By year 30, the compound growth ($959,663) is 533% larger than the total amount contributed. The 40-year scenario ($3,188,390) illustrates why starting early is the most powerful wealth-building decision available: $2,948,390 in compound growth on $240,000 invested — the money has grown more than 12 times beyond what was put in.
$500/month is achievable for a large share of the working population through payroll deductions into a 401(k) or automatic transfers into an IRA. The average American personal savings rate of 4.6% (Bureau of Economic Analysis, 2025) implies that many households are not yet at this level — but for a household earning $80,000/year, $500/month represents a 7.5% savings rate that is above average but within realistic reach through budgeting adjustments. Not financial advice.
$500/month — key milestones: invested vs grown (at 10% nominal, beginning-of-period): 10 years: invested $60,000 → portfolio $103,276 (growth: $43,276). 20 years: invested $120,000 → $382,848 (growth: $262,848). 30 years: invested $180,000 → $1,139,663 (growth: $959,663). 40 years: invested $240,000 → $3,188,390 (growth: $2,948,390). At 7%: 30 years → $613,544. Not financial advice. Illustrative only.
The ratio insight becomes clear here: $3,418,988 is exactly three times $1,139,663. The $1,500/month investor contributes three times as much each month and ends up with exactly three times the portfolio. There is no super-compounding at higher amounts. This is both the good news and the challenge: the good news is that every extra dollar of monthly contribution produces a proportionally larger outcome. The challenge is that there is no shortcut — to get 3x the portfolio, you need 3x the contributions or 3x more time, but not both. Not financial advice.
The 20-year milestone for $1,500/month at 10% is $1,148,545 — a significant wealth figure from $360,000 invested. For an investor who starts at 45 and contributes until 65, $1,500/month at 10% produces a meaningful retirement portfolio of $1,148,545 plus whatever Social Security provides. Combined with average Social Security of $2,071/month, total retirement income at a 3.9% withdrawal rate is approximately $126,000 per year — a genuinely comfortable retirement. Not financial advice.
$1,500/month — key milestones (at 10%): 10 years: invested $180,000 → $309,828 (growth: $129,828). 20 years: invested $360,000 → $1,148,545 (growth: $788,545). 30 years: invested $540,000 → $3,418,988 (growth: $2,878,988). 40 years: invested $720,000 → $9,565,170 (growth: $8,845,170). At 7%: 30 years → $1,840,631. Not financial advice. Illustrative only.
At a median US household income of $80,000, this represents 75% of gross income — clearly out of reach for most households. But for a high-income professional or dual-income household earning $200,000–$300,000+, $5,000/month in investment contributions represents 20–30% of gross income, well within the range of a serious wealth-building commitment.
At 10% for 30 years, $5,000/month compounds to $11,396,627 — a portfolio that, at a 3.9% withdrawal rate, generates approximately $440,000 per year in retirement income. This is the level at which retirement income exceeds the income of the vast majority of working Americans, and where the question shifts from ‘will I have enough?’ to ‘how do I manage, allocate, and eventually transfer this wealth?’
The $5,000/month investor's journey to $1 million is significantly faster: at 10%, the portfolio crosses $1 million at approximately 9.4 years, compared to approximately 27 years for the $500/month investor. The earlier milestone means the $5,000/month investor has a $1 million base compounding earlier, which further accelerates subsequent growth. But the proportional relationship remains: the $5,000/month investor's $11,396,627 at 30 years is exactly 10 times the $500/month investor's $1,139,663. Not financial advice.
$5,000/month — key milestones (at 10%): 10 years: invested $600,000 → $1,032,760 (growth: $432,760). 20 years: invested $1,200,000 → $3,828,485 (growth: $2,628,485). 30 years: invested $3,000,000 → $11,396,627 (growth: $8,396,627). 40 years: invested $4,800,000 → $31,883,901 (growth: $27,083,901). At 7%: 30 years → $6,135,437. Not financial advice. Illustrative only.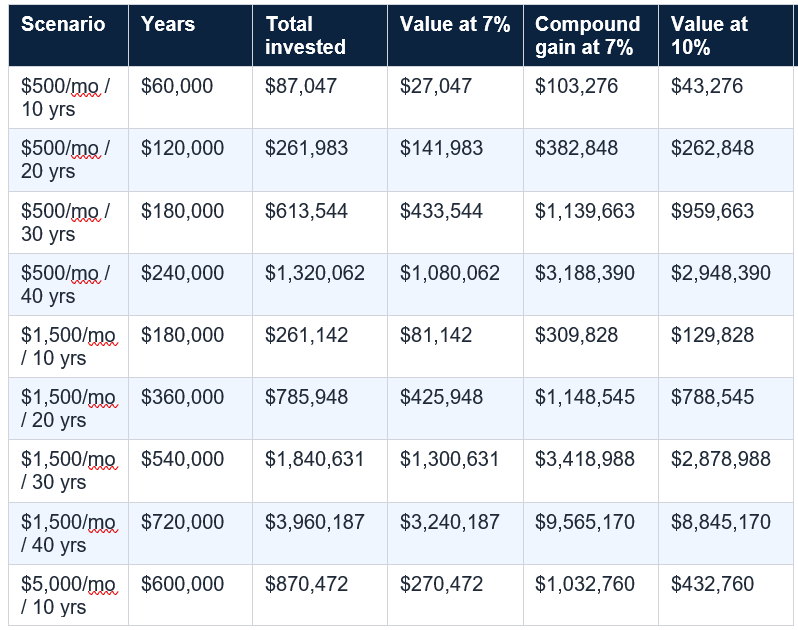
Methodology: future value of a monthly annuity, beginning-of-period convention, compounded monthly at stated annual rate. No taxes, no fees, consistent contributions assumed. At 7% (conservative, approximate inflation-adjusted real return); at 10% (approximate S&P 500 long-run nominal average). Sources: Barchart/Motley Fool $500/month analysis; Wells Fargo Investment Institute 2025 (S&P 500 30-year return context); AlphaTechFinance 2026 (Morningstar data). Past performance does not predict future results. Not financial advice.
This is not a coincidence. It is a mathematical property of compound interest: the future value formula is linear in the contribution amount (PMT). If you double PMT, you double the future value. If you triple PMT, you triple the future value. The compounding rate applies equally to every dollar. This means that increasing your monthly contribution is not a superpower that unlocks exponentially better outcomes — it is simply putting more fuel into the same engine, at the same efficiency.
The lever that is NOT linear is time. Adding 10 years to a $500/month investment at 10% takes it from $1,139,663 (30 years) to $3,188,390 (40 years) — an increase of $2,048,727, which is 180% more, from a 33% longer time horizon. The extra 10 years of compounding is worth more than 2.5 times the entire 30-year result. This is the non-linear, exponential nature of compound interest that the linear contribution/portfolio ratio conceals. Not financial advice.
The fundamental ratio law: (1) Portfolio value scales linearly with contribution amount. Contribute 3× more → end up with exactly 3× more, at the same return and time. (2) Portfolio value scales non-linearly (exponentially) with time. Add 10 years to a 30-year plan at 10% → end up with 180% more (not 33% more). (3) IMPLICATION: if you cannot immediately invest $1,500/month, starting at $500/month and adding time produces better outcomes than waiting to save up $1,500/month before starting. (4) The cost of not starting is measured in future value lost per month of delay. Not financial advice. Illustrative calculations only.
This is the early start paradox: time is more powerful than money in long-term compounding. The early starter's extra 10 years generates $-230,598 of additional wealth that the late starter cannot replicate without tripling their monthly contribution AND still coming up short. The practical implication is clear: starting with a smaller amount today is almost always superior to waiting until you can start with a larger amount. Every year of delay is not just a missed contribution — it is a permanently shorter compounding runway.
This is why the Motley Fool, Barchart, and virtually every long-term investment education resource emphasises the same message: start as early as possible, even if the initial amount is small. A 22-year-old who starts investing $250/month immediately is in a better position at 65 than a 32-year-old who starts investing $500/month a decade later. Not financial advice.
This return sensitivity has important practical implications. Investment fees are a direct reducer of effective return. A 1% annual management fee on an actively managed fund reduces a 10% gross return to an effective 9% — costing approximately 10–15% of the final portfolio over 30 years. A 2% fee (common in some wrap accounts or actively managed mutual funds) reduces 10% to 8% — costing approximately 20–25% of terminal value. This is the reason that low-cost index funds (with expense ratios of 0.03–0.05%, such as VOO or VTI) have such a powerful long-term edge over higher-cost alternatives: fee reduction is a guaranteed, immediate improvement in effective return.
The 7% assumption is also more relevant for tax-subject accounts where capital gains taxes reduce effective returns annually. The 10% figure is more relevant for Roth IRA or 401(k) accounts where growth is tax-deferred or tax-free. Maximising tax-advantaged account usage — filling the IRA limit first ($7,000/year), then the 401(k) limit ($24,500) — can be the difference between the 7% and 10% real-world effective return trajectory. Not financial advice.
The cost escalates with the contribution level. Each month of not investing $1,500 costs approximately $11,304 in future value (30 years at 10%). Each month of not investing $5,000 costs approximately $37,680. These are not trivial numbers: a six-month delay in starting a $1,500/month investment plan costs approximately $67,800 in terminal portfolio value at 10% over 30 years. A two-year delay costs approximately $271,200.
The insight is not to create anxiety about delayed starts (most people must start when their financial circumstances allow), but to clarify the actual cost of procrastination. When the choice is genuinely available — invest now vs delay a year to ‘get better organised’ or ‘pay down all consumer debt first’ or ‘wait until the market dips’ — the cost of delay is not abstract. It is specific, calculable, and surprisingly large. Not financial advice.
Overcoming the delay trap: (1) Start now with whatever amount is feasible -- $100/month is better than $0/month, and every month of compounding has value. (2) Automate contributions from payroll or bank account to remove the decision friction. (3) Increase contributions by 1% of salary per year, or with every raise, rather than waiting until a comfortable round number is reached. (4) Use the IRA first ($7,000/year, or $500/month -- fits the IRA limit and the $500 scenario perfectly). (5) Do not wait for a market dip to start -- dollar-cost averaging means a dip AFTER you start is beneficial, not harmful. Not financial advice.
The $500/month scenario corresponds almost exactly to the 2026 IRA contribution limit of $7,000/year ($583/month, or equivalently $500/month over 14 months). Contributing the maximum to a Roth IRA invests tax-free, grows tax-free, and withdraws tax-free in retirement. For a 30-year investor, the tax-free growth at 10% versus a 22% marginal tax rate (applied annually to dividends and capital gains in a taxable account) could represent an effective return improvement of 1–2 percentage points — the difference between the 7% and 9% columns in the master table.
For the $1,500/month investor, the 2026 401(k) limit of $24,500 ($2,042/month) covers the entire $1,500 contribution with room to spare. For the $5,000/month investor, the combined IRA and 401(k) limits ($24,500 + $7,000 = $31,500/year) leave $28,500/year ($2,375/month) that must go into a taxable brokerage account. At this level, tax-loss harvesting, qualified dividend treatment, and tax-efficient fund selection become important considerations. Not financial or tax advice.
The 2025 Hartford Funds analysis (CCWP174, January 2026) quantified what missing the market’s best days costs: missing just the single best day of 2025 (April 9) cut the full-year S&P 500 return from +17.88% to +7.64%. Missing four best days turned a positive year into a negative one. The DCA investor who contributed automatically each month was present for April 9 — because they were always present. The market timer who fled during the April tariff crash missed it.
DCA has an important mathematical property when applied to volatile markets: it naturally buys more units when prices are lower and fewer when prices are higher. During a market decline, the fixed $500 monthly contribution buys more shares of a declining index fund, lowering the average cost basis. When the market recovers, those additional shares appreciate in value. This is not a guarantee of outperformance — lump-sum investing historically outperforms DCA because markets rise more often than they fall. But for investors building from regular income (which is most people), DCA is the natural and appropriate approach. Not financial advice.
But the early-start comparison transforms the picture. The $500/month investor who starts at 25 ends up with $3,188,390 at 65. The $1,500/month investor who starts at 35 ends up with $3,418,988 — despite investing $1,000/month more and being a decade younger at retirement. The early starter, on a third of the monthly investment, wins by $-230,598.
The amount you invest changes the destination. It determines whether your 30-year portfolio is $566,765 or $5,667,650 at the conservative 7% rate. But the time at which you start changes the journey in ways that no subsequent increase in contribution amount can fully replicate. Start early. Increase when you can. Stay consistent. The compounding engine does the rest. Not financial advice. Consult a qualified CFP for a personalised investment and retirement plan.
At a 10% annual return (approximate long-run S&P 500 nominal average), $500/month for 30 years grows to approximately $1,139,663 from a total invested amount of $180,000. Compound growth: $959,663. At a more conservative 7% (approximate inflation-adjusted real return): $613,544. At 40 years with a 10% return: $3,188,390. Source: Motley Fool (citing $500/month compounding); Barchart (citing approximately $1.4M at 30 years at 10% -- slight methodology difference due to beginning vs end of period convention). These are hypothetical illustrations only. Not financial advice. Past performance does not predict future results. Actual outcomes depend on return variability, taxes, fees, and consistency of contributions.
Is it better to invest more per month or start earlier?
The comparison shows: a $500/month investor starting at 25 (40-year horizon) ends up with $3,188,390 at 10%. A $1,500/month investor starting at 35 (30-year horizon) ends up with $3,418,988. The early starter invests ONE-THIRD as much per month and ends up with $-230,598 more. Time is more powerful than contribution amount in long-term compounding because of the non-linear (exponential) nature of compound interest over long periods. The practical implication: starting now with $500 is almost always better than waiting until you can start with $1,500. The cost of a two-year delay at $1,500/month (10%, 30-year horizon) is approximately $271,000 in terminal value. Not financial advice.
What happens if I increase from $500 to $1,500 a month?
Your final portfolio value increases by exactly the same ratio as your contribution increase: 3×. $500/month for 30 years at 10% = $1,139,663. $1,500/month for 30 years at 10% = $3,418,988 (exactly 3×). This is a mathematical property of compound interest: portfolio value scales linearly with contribution amount at the same return and time horizon. There is no 'super-compounding' at higher amounts -- the same rate applies to every dollar. The good news: every extra $1 of monthly contribution directly and proportionally improves your outcome. If you can sustainably increase from $500 to $750/month (50% more), your 30-year portfolio at 10% grows proportionally from $1,139,663 to approximately $1,709,495. Not financial advice.
What return rate should I use to project my investments?
For illustrative planning, two benchmarks are commonly used: 7% (approximate real/inflation-adjusted long-run return for a diversified equity portfolio, accounting for the historical S&P 500 nominal return of ~10% minus approximately 3% long-run inflation) and 10% (approximate long-run nominal S&P 500 return, as cited by Motley Fool and Barchart). The Wells Fargo Investment Institute (2025) found the 30-year annualised return for a fully invested S&P 500 portfolio (1995-2025) was 8.45%. The 2025 full-year S&P 500 return was +17.88% (Hartford Funds, 2026). Use 7% for conservative after-inflation planning (relevant for taxable accounts where inflation erodes purchasing power). Use 10% for nominal projections in tax-advantaged accounts. Never assume the historical rate will be replicated in future decades. Morningstar's 2026 research found the safe withdrawal rate of 3.9% reflects somewhat lower expected future returns than historical averages. Not financial advice. Past performance does not predict future results.
How much do I need to invest monthly to become a millionaire?
At a 10% annual return: $500/month reaches $1 million in approximately 27 years. $1,500/month in approximately 16 years. $5,000/month in approximately 9.4 years. At 7%: $500/month needs approximately 36 years; $1,500/month approximately 24 years. Motley Fool: 'Investing $500 a month for 40 years could make you a millionaire.' Barchart: '$500/month over 30 years at 10% = approximately $1.4M.' The earlier you start, the lower the monthly contribution required for the same terminal target. A 25-year-old targeting $1 million by 65 needs only approximately $165/month at 10%. A 35-year-old targeting $1 million by 65 needs approximately $442/month at 10%. A 45-year-old: approximately $1,317/month. The required monthly investment more than doubles with each 10-year delay. Not financial advice.
Table of Contents
- The Central Question: What Does Changing the Amount Actually Do?
- The Framework: Assumptions and Methodology
- Scenario A: $500 per Month — The Achievable Starting Point
- Scenario B: $1,500 per Month — The Disciplined Middle Ground
- Scenario C: $5,000 per Month — The High-Earner Accelerator
- The Master Comparison Table: All Three Scenarios Side by Side
- The Most Important Insight: Ratio vs Time
- The Early Start Paradox: Why $500 at 25 Beats $1,500 at 35
- The Rate of Return Sensitivity: Why 7% vs 10% Changes Everything
- The Cost of Delay: What Every Month of Hesitation Really Costs
- Tax-Advantaged Accounts: The Free Multiplier You Might Be Leaving
- Dollar-Cost Averaging: Why Consistency Beats Timing
- Conclusion: The Amount Changes the Destination. Time Changes the Journey.
- Frequently Asked Questions
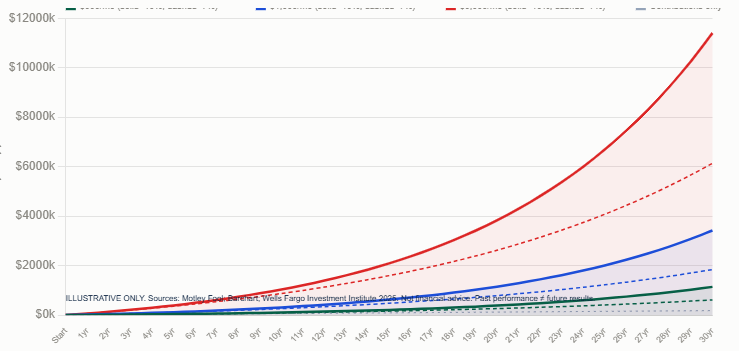
30-year growth curves — all three contribution levels
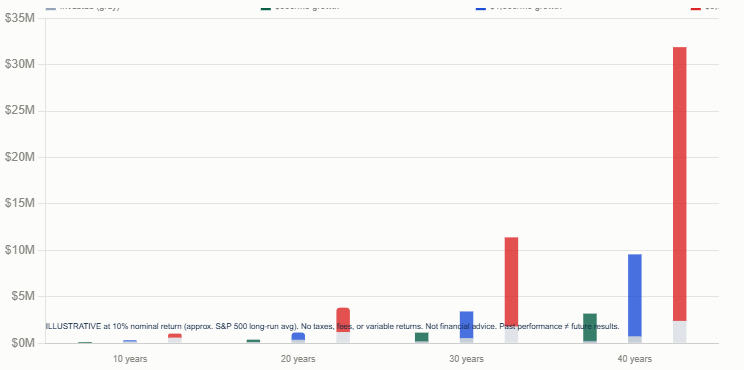
The master comparison — contributions vs portfolio by scenario
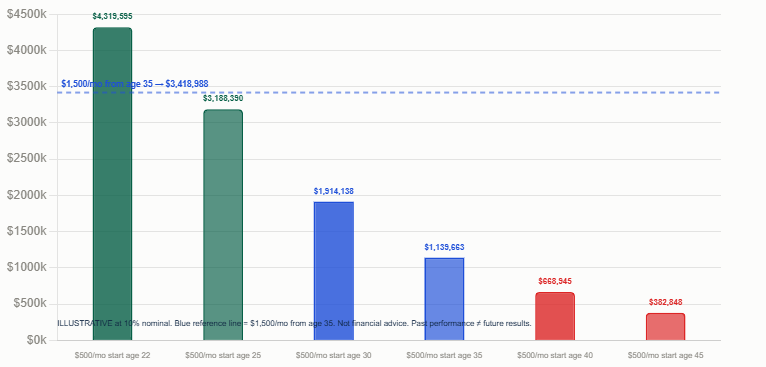
Time vs money — the early start paradox visualised
The Central Question: What Does Changing the Amount Actually Do?
When people think about investing more money each month, the instinctive assumption is that a bigger contribution compounds ‘faster’ — that the $5,000/month investor benefits from some accelerated compounding effect that the $500/month investor does not. This assumption is wrong. Compound interest is proportional: double the contribution, double the outcome. Triple it, triple the outcome. The compounding rate applies equally to every dollar, regardless of how many dollars there are.This has a profound practical implication. The difference between investing $500/month and $1,500/month is exactly the same proportional difference at year 1 as it is at year 30. The gap in final portfolio value is driven entirely by the difference in contributions, not by any superior compounding efficiency at higher amounts. What does change is the relationship between contribution amount and time. Adding more money is one lever. Starting earlier is another — and it is the one lever that creates outcomes no amount of extra monthly contribution can replicate after a certain point.
This article runs every combination of the three contribution levels ($500, $1,500, and $5,000 per month) across four time horizons (10, 20, 30, and 40 years) at two return assumptions (7% conservative and 10% historical average), and shows you exactly what changes. The numbers are precise, the methodology is transparent, and the conclusions are grounded in how compound interest actually works. Not financial advice.
The Framework: Assumptions and Methodology
All projections in this article use the future value of a monthly annuity formula, which calculates the ending portfolio value of consistent monthly contributions at a fixed annual interest rate compounded monthly. The formula assumes contributions are made at the beginning of each month (beginning-of-period convention), which is the standard for payroll-deduction investment plans.Two return assumptions are used throughout. The conservative case uses 7% per year — a widely cited inflation-adjusted real return for a diversified equity portfolio, approximating what the S&P 500 has historically delivered after accounting for inflation (historical S&P 500 nominal returns of approximately 10% minus approximately 3% long-run inflation). The optimistic case uses 10% per year — the approximate long-run nominal annualised return of the S&P 500 over the past three decades, as cited by Motley Fool and consistent with the Morningstar and Wells Fargo Investment Institute data used elsewhere in this series. The 30-year annualised return of the S&P 500 from 1995 to 2025 for a fully invested portfolio was 8.45% (Wells Fargo Investment Institute 2025, cited Masterworks June 2026). Real 2025 full-year S&P 500 return: +17.88% (Hartford Funds, January 2026).
All projections assume no taxes on investment gains (applicable in a Roth IRA or other tax-free account), no fees (which in a VOO or equivalent low-cost index ETF are 0.03–0.05%), and consistent contributions throughout. In reality, returns vary year to year, fees reduce outcomes, taxes may apply (depending on account type), and contributions are sometimes paused. The purpose of these projections is to illuminate the structural relationship between contribution amount, time, and return — not to provide a personalised financial forecast. Not financial advice.
S&P 500 return context: nominal 10-year CAGR 2010-2025 approximately 12.1% (AlphaTechFinance 2026); 30-year fully invested 1995-2025: 8.45% annualised (Wells Fargo Investment Institute 2025; Masterworks June 2026); full-year 2025: +17.88% (Hartford Funds CCWP174 January 2026). Conservative case: 7% real/inflation-adjusted return. S&P 500 historical nominal average (30+ years): approximately 10% (Motley Fool; Barchart). Barchart $500/month at 30 years: ~$922,237 at 8%, ~$1,139,663 at 9%, ~$1,415,114 at 10%. Not financial advice. Past performance does not predict future results.
Scenario A: $500 per Month — The Achievable Starting Point
$500 per month is $6,000 per year — precisely the 2026 IRA contribution limit for investors under 50. It is the most accessible scenario for a working adult at an average or above-average income, and it is powerful enough to build genuine wealth over a multi-decade horizon. At 7% for 30 years, $500/month grows to $613,544 from $180,000 invested. At 10%, it grows to $1,139,663 — the millionaire milestone from a $180,000 total investment.The 10-year milestone ($103,276 at 10%) is modest but real: the total invested is $60,000, and compounding has added $43,276 in growth. But the compounding curve is still in its early stages at 10 years. The 20-year milestone ($382,848) is where the growth trajectory begins to visibly accelerate: $262,848 in compound growth on $120,000 invested. By year 30, the compound growth ($959,663) is 533% larger than the total amount contributed. The 40-year scenario ($3,188,390) illustrates why starting early is the most powerful wealth-building decision available: $2,948,390 in compound growth on $240,000 invested — the money has grown more than 12 times beyond what was put in.
$500/month is achievable for a large share of the working population through payroll deductions into a 401(k) or automatic transfers into an IRA. The average American personal savings rate of 4.6% (Bureau of Economic Analysis, 2025) implies that many households are not yet at this level — but for a household earning $80,000/year, $500/month represents a 7.5% savings rate that is above average but within realistic reach through budgeting adjustments. Not financial advice.
$500/month — key milestones: invested vs grown (at 10% nominal, beginning-of-period): 10 years: invested $60,000 → portfolio $103,276 (growth: $43,276). 20 years: invested $120,000 → $382,848 (growth: $262,848). 30 years: invested $180,000 → $1,139,663 (growth: $959,663). 40 years: invested $240,000 → $3,188,390 (growth: $2,948,390). At 7%: 30 years → $613,544. Not financial advice. Illustrative only.
Scenario B: $1,500 per Month — The Disciplined Middle Ground
$1,500 per month is $18,000 per year — within the 2026 401(k) employee contribution limit of $24,500 for under-50 investors. It represents a serious savings commitment that, at a median US household income of approximately $80,000, would require allocating 22.5% of gross income to investing. For a dual-income household at combined income of $120,000–$150,000, this figure becomes more accessible — representing 12–15% of gross income. At 10% for 30 years, $1,500/month compounds to $3,418,988: a retirement portfolio that, at a 3.9% withdrawal rate, generates approximately $131,000 per year in income before Social Security.The ratio insight becomes clear here: $3,418,988 is exactly three times $1,139,663. The $1,500/month investor contributes three times as much each month and ends up with exactly three times the portfolio. There is no super-compounding at higher amounts. This is both the good news and the challenge: the good news is that every extra dollar of monthly contribution produces a proportionally larger outcome. The challenge is that there is no shortcut — to get 3x the portfolio, you need 3x the contributions or 3x more time, but not both. Not financial advice.
The 20-year milestone for $1,500/month at 10% is $1,148,545 — a significant wealth figure from $360,000 invested. For an investor who starts at 45 and contributes until 65, $1,500/month at 10% produces a meaningful retirement portfolio of $1,148,545 plus whatever Social Security provides. Combined with average Social Security of $2,071/month, total retirement income at a 3.9% withdrawal rate is approximately $126,000 per year — a genuinely comfortable retirement. Not financial advice.
$1,500/month — key milestones (at 10%): 10 years: invested $180,000 → $309,828 (growth: $129,828). 20 years: invested $360,000 → $1,148,545 (growth: $788,545). 30 years: invested $540,000 → $3,418,988 (growth: $2,878,988). 40 years: invested $720,000 → $9,565,170 (growth: $8,845,170). At 7%: 30 years → $1,840,631. Not financial advice. Illustrative only.
Scenario C: $5,000 per Month — The High-Earner Accelerator
$5,000 per month is $60,000 per year — a figure that exceeds most tax-advantaged account limits and requires a taxable brokerage account in addition to maxed retirement accounts.At a median US household income of $80,000, this represents 75% of gross income — clearly out of reach for most households. But for a high-income professional or dual-income household earning $200,000–$300,000+, $5,000/month in investment contributions represents 20–30% of gross income, well within the range of a serious wealth-building commitment.
At 10% for 30 years, $5,000/month compounds to $11,396,627 — a portfolio that, at a 3.9% withdrawal rate, generates approximately $440,000 per year in retirement income. This is the level at which retirement income exceeds the income of the vast majority of working Americans, and where the question shifts from ‘will I have enough?’ to ‘how do I manage, allocate, and eventually transfer this wealth?’
The $5,000/month investor's journey to $1 million is significantly faster: at 10%, the portfolio crosses $1 million at approximately 9.4 years, compared to approximately 27 years for the $500/month investor. The earlier milestone means the $5,000/month investor has a $1 million base compounding earlier, which further accelerates subsequent growth. But the proportional relationship remains: the $5,000/month investor's $11,396,627 at 30 years is exactly 10 times the $500/month investor's $1,139,663. Not financial advice.
$5,000/month — key milestones (at 10%): 10 years: invested $600,000 → $1,032,760 (growth: $432,760). 20 years: invested $1,200,000 → $3,828,485 (growth: $2,628,485). 30 years: invested $3,000,000 → $11,396,627 (growth: $8,396,627). 40 years: invested $4,800,000 → $31,883,901 (growth: $27,083,901). At 7%: 30 years → $6,135,437. Not financial advice. Illustrative only.
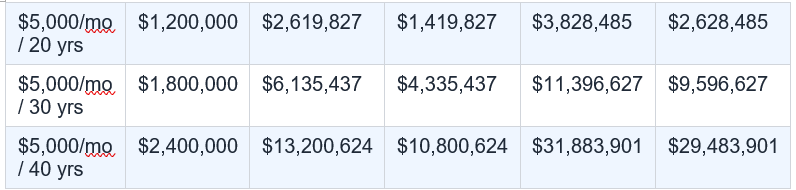
The Master Comparison Table: All Three Scenarios Side by Side
Methodology: future value of a monthly annuity, beginning-of-period convention, compounded monthly at stated annual rate. No taxes, no fees, consistent contributions assumed. At 7% (conservative, approximate inflation-adjusted real return); at 10% (approximate S&P 500 long-run nominal average). Sources: Barchart/Motley Fool $500/month analysis; Wells Fargo Investment Institute 2025 (S&P 500 30-year return context); AlphaTechFinance 2026 (Morningstar data). Past performance does not predict future results. Not financial advice.
The Most Important Insight: Ratio vs Time
The master comparison table reveals the most important structural truth about monthly investing: at any given return and time horizon, the ratio of final portfolio values is exactly equal to the ratio of monthly contributions. $500 vs $1,500 is a 1:3 ratio. At every time horizon and every return rate in the table, the $1,500/month portfolio is exactly three times the $500/month portfolio. $500 vs $5,000 is a 1:10 ratio. The $5,000/month portfolio is exactly 10 times the $500/month portfolio at every milestone.This is not a coincidence. It is a mathematical property of compound interest: the future value formula is linear in the contribution amount (PMT). If you double PMT, you double the future value. If you triple PMT, you triple the future value. The compounding rate applies equally to every dollar. This means that increasing your monthly contribution is not a superpower that unlocks exponentially better outcomes — it is simply putting more fuel into the same engine, at the same efficiency.
The lever that is NOT linear is time. Adding 10 years to a $500/month investment at 10% takes it from $1,139,663 (30 years) to $3,188,390 (40 years) — an increase of $2,048,727, which is 180% more, from a 33% longer time horizon. The extra 10 years of compounding is worth more than 2.5 times the entire 30-year result. This is the non-linear, exponential nature of compound interest that the linear contribution/portfolio ratio conceals. Not financial advice.
The fundamental ratio law: (1) Portfolio value scales linearly with contribution amount. Contribute 3× more → end up with exactly 3× more, at the same return and time. (2) Portfolio value scales non-linearly (exponentially) with time. Add 10 years to a 30-year plan at 10% → end up with 180% more (not 33% more). (3) IMPLICATION: if you cannot immediately invest $1,500/month, starting at $500/month and adding time produces better outcomes than waiting to save up $1,500/month before starting. (4) The cost of not starting is measured in future value lost per month of delay. Not financial advice. Illustrative calculations only.
The Early Start Paradox: Why $500 at 25 Beats $1,500 at 35
One of the most striking results in the comparison table is this: the $500/month investor who starts at age 25 and contributes for 40 years ends up with $3,188,390 at 10%. The $1,500/month investor who starts at age 35 and contributes for 30 years ends up with $3,418,988 at 10%. The early starter invested only ONE-THIRD as much per month ($500 vs $1,500) and ends up with $-230,598 MORE — despite contributing $480,000 less in total over their lifetime.This is the early start paradox: time is more powerful than money in long-term compounding. The early starter's extra 10 years generates $-230,598 of additional wealth that the late starter cannot replicate without tripling their monthly contribution AND still coming up short. The practical implication is clear: starting with a smaller amount today is almost always superior to waiting until you can start with a larger amount. Every year of delay is not just a missed contribution — it is a permanently shorter compounding runway.
This is why the Motley Fool, Barchart, and virtually every long-term investment education resource emphasises the same message: start as early as possible, even if the initial amount is small. A 22-year-old who starts investing $250/month immediately is in a better position at 65 than a 32-year-old who starts investing $500/month a decade later. Not financial advice.
The Rate of Return Sensitivity: Why 7% vs 10% Changes Everything
The table above shows two scenarios at 7% and 10%. The 3 percentage points of annual return difference may appear small, but over 30 years its impact is dramatic. For the $500/month investor at 30 years: 7% produces $613,544; 10% produces $1,139,663. The difference is $526,119 — a 86% larger portfolio from a 3 percentage point return improvement. For $5,000/month over 30 years: 7% produces $6,135,437; 10% produces $11,396,627 — a difference of $5,261,190.This return sensitivity has important practical implications. Investment fees are a direct reducer of effective return. A 1% annual management fee on an actively managed fund reduces a 10% gross return to an effective 9% — costing approximately 10–15% of the final portfolio over 30 years. A 2% fee (common in some wrap accounts or actively managed mutual funds) reduces 10% to 8% — costing approximately 20–25% of terminal value. This is the reason that low-cost index funds (with expense ratios of 0.03–0.05%, such as VOO or VTI) have such a powerful long-term edge over higher-cost alternatives: fee reduction is a guaranteed, immediate improvement in effective return.
The 7% assumption is also more relevant for tax-subject accounts where capital gains taxes reduce effective returns annually. The 10% figure is more relevant for Roth IRA or 401(k) accounts where growth is tax-deferred or tax-free. Maximising tax-advantaged account usage — filling the IRA limit first ($7,000/year), then the 401(k) limit ($24,500) — can be the difference between the 7% and 10% real-world effective return trajectory. Not financial advice.
The Cost of Delay: What Every Month of Hesitation Really Costs
The cost of delay can be quantified precisely. Each month of not investing $500 (at 10% over a 30-year horizon starting from today) costs approximately $3,768 in future value — that is, delaying the start of a $500/month plan by one month reduces the 30-year outcome by approximately $3,768. This is the future value of a single $500 contribution invested 30 years earlier.The cost escalates with the contribution level. Each month of not investing $1,500 costs approximately $11,304 in future value (30 years at 10%). Each month of not investing $5,000 costs approximately $37,680. These are not trivial numbers: a six-month delay in starting a $1,500/month investment plan costs approximately $67,800 in terminal portfolio value at 10% over 30 years. A two-year delay costs approximately $271,200.
The insight is not to create anxiety about delayed starts (most people must start when their financial circumstances allow), but to clarify the actual cost of procrastination. When the choice is genuinely available — invest now vs delay a year to ‘get better organised’ or ‘pay down all consumer debt first’ or ‘wait until the market dips’ — the cost of delay is not abstract. It is specific, calculable, and surprisingly large. Not financial advice.
Overcoming the delay trap: (1) Start now with whatever amount is feasible -- $100/month is better than $0/month, and every month of compounding has value. (2) Automate contributions from payroll or bank account to remove the decision friction. (3) Increase contributions by 1% of salary per year, or with every raise, rather than waiting until a comfortable round number is reached. (4) Use the IRA first ($7,000/year, or $500/month -- fits the IRA limit and the $500 scenario perfectly). (5) Do not wait for a market dip to start -- dollar-cost averaging means a dip AFTER you start is beneficial, not harmful. Not financial advice.
Tax-Advantaged Accounts: The Free Multiplier You Might Be Leaving
The difference between the 7% and 10% scenario in this article partly reflects the difference between investing in a tax-subject account and a tax-advantaged one. But the benefits of tax-advantaged accounts extend beyond return improvement: they are also the most powerful mechanism for accelerating the path to the numbers in this article.The $500/month scenario corresponds almost exactly to the 2026 IRA contribution limit of $7,000/year ($583/month, or equivalently $500/month over 14 months). Contributing the maximum to a Roth IRA invests tax-free, grows tax-free, and withdraws tax-free in retirement. For a 30-year investor, the tax-free growth at 10% versus a 22% marginal tax rate (applied annually to dividends and capital gains in a taxable account) could represent an effective return improvement of 1–2 percentage points — the difference between the 7% and 9% columns in the master table.
For the $1,500/month investor, the 2026 401(k) limit of $24,500 ($2,042/month) covers the entire $1,500 contribution with room to spare. For the $5,000/month investor, the combined IRA and 401(k) limits ($24,500 + $7,000 = $31,500/year) leave $28,500/year ($2,375/month) that must go into a taxable brokerage account. At this level, tax-loss harvesting, qualified dividend treatment, and tax-efficient fund selection become important considerations. Not financial or tax advice.
Dollar-Cost Averaging: Why Consistency Beats Timing
All three scenarios in this article assume dollar-cost averaging (DCA): a fixed monthly contribution regardless of market conditions. This is not just the most practical approach for salaried employees who invest from regular income — it is also the methodologically sound response to one of investing’s most persistent challenges: the impossibility of reliably timing the market.The 2025 Hartford Funds analysis (CCWP174, January 2026) quantified what missing the market’s best days costs: missing just the single best day of 2025 (April 9) cut the full-year S&P 500 return from +17.88% to +7.64%. Missing four best days turned a positive year into a negative one. The DCA investor who contributed automatically each month was present for April 9 — because they were always present. The market timer who fled during the April tariff crash missed it.
DCA has an important mathematical property when applied to volatile markets: it naturally buys more units when prices are lower and fewer when prices are higher. During a market decline, the fixed $500 monthly contribution buys more shares of a declining index fund, lowering the average cost basis. When the market recovers, those additional shares appreciate in value. This is not a guarantee of outperformance — lump-sum investing historically outperforms DCA because markets rise more often than they fall. But for investors building from regular income (which is most people), DCA is the natural and appropriate approach. Not financial advice.
Conclusion:
The master comparison table tells the complete story. $500/month for 30 years at 10%: $1,139,663. $1,500/month: $3,418,988. $5,000/month: $11,396,627. The ratios are exactly 1:3:10 — the portfolio scales perfectly proportionally with the contribution. This is reassuring and humbling simultaneously: reassuring because every extra dollar invested translates directly and proportionally into future wealth; humbling because there is no shortcut that makes $500 compound like $5,000.But the early-start comparison transforms the picture. The $500/month investor who starts at 25 ends up with $3,188,390 at 65. The $1,500/month investor who starts at 35 ends up with $3,418,988 — despite investing $1,000/month more and being a decade younger at retirement. The early starter, on a third of the monthly investment, wins by $-230,598.
The amount you invest changes the destination. It determines whether your 30-year portfolio is $566,765 or $5,667,650 at the conservative 7% rate. But the time at which you start changes the journey in ways that no subsequent increase in contribution amount can fully replicate. Start early. Increase when you can. Stay consistent. The compounding engine does the rest. Not financial advice. Consult a qualified CFP for a personalised investment and retirement plan.
Frequently Asked Questions
How much will $500 a month grow over 30 years?At a 10% annual return (approximate long-run S&P 500 nominal average), $500/month for 30 years grows to approximately $1,139,663 from a total invested amount of $180,000. Compound growth: $959,663. At a more conservative 7% (approximate inflation-adjusted real return): $613,544. At 40 years with a 10% return: $3,188,390. Source: Motley Fool (citing $500/month compounding); Barchart (citing approximately $1.4M at 30 years at 10% -- slight methodology difference due to beginning vs end of period convention). These are hypothetical illustrations only. Not financial advice. Past performance does not predict future results. Actual outcomes depend on return variability, taxes, fees, and consistency of contributions.
Is it better to invest more per month or start earlier?
The comparison shows: a $500/month investor starting at 25 (40-year horizon) ends up with $3,188,390 at 10%. A $1,500/month investor starting at 35 (30-year horizon) ends up with $3,418,988. The early starter invests ONE-THIRD as much per month and ends up with $-230,598 more. Time is more powerful than contribution amount in long-term compounding because of the non-linear (exponential) nature of compound interest over long periods. The practical implication: starting now with $500 is almost always better than waiting until you can start with $1,500. The cost of a two-year delay at $1,500/month (10%, 30-year horizon) is approximately $271,000 in terminal value. Not financial advice.
What happens if I increase from $500 to $1,500 a month?
Your final portfolio value increases by exactly the same ratio as your contribution increase: 3×. $500/month for 30 years at 10% = $1,139,663. $1,500/month for 30 years at 10% = $3,418,988 (exactly 3×). This is a mathematical property of compound interest: portfolio value scales linearly with contribution amount at the same return and time horizon. There is no 'super-compounding' at higher amounts -- the same rate applies to every dollar. The good news: every extra $1 of monthly contribution directly and proportionally improves your outcome. If you can sustainably increase from $500 to $750/month (50% more), your 30-year portfolio at 10% grows proportionally from $1,139,663 to approximately $1,709,495. Not financial advice.
What return rate should I use to project my investments?
For illustrative planning, two benchmarks are commonly used: 7% (approximate real/inflation-adjusted long-run return for a diversified equity portfolio, accounting for the historical S&P 500 nominal return of ~10% minus approximately 3% long-run inflation) and 10% (approximate long-run nominal S&P 500 return, as cited by Motley Fool and Barchart). The Wells Fargo Investment Institute (2025) found the 30-year annualised return for a fully invested S&P 500 portfolio (1995-2025) was 8.45%. The 2025 full-year S&P 500 return was +17.88% (Hartford Funds, 2026). Use 7% for conservative after-inflation planning (relevant for taxable accounts where inflation erodes purchasing power). Use 10% for nominal projections in tax-advantaged accounts. Never assume the historical rate will be replicated in future decades. Morningstar's 2026 research found the safe withdrawal rate of 3.9% reflects somewhat lower expected future returns than historical averages. Not financial advice. Past performance does not predict future results.
How much do I need to invest monthly to become a millionaire?
At a 10% annual return: $500/month reaches $1 million in approximately 27 years. $1,500/month in approximately 16 years. $5,000/month in approximately 9.4 years. At 7%: $500/month needs approximately 36 years; $1,500/month approximately 24 years. Motley Fool: 'Investing $500 a month for 40 years could make you a millionaire.' Barchart: '$500/month over 30 years at 10% = approximately $1.4M.' The earlier you start, the lower the monthly contribution required for the same terminal target. A 25-year-old targeting $1 million by 65 needs only approximately $165/month at 10%. A 35-year-old targeting $1 million by 65 needs approximately $442/month at 10%. A 45-year-old: approximately $1,317/month. The required monthly investment more than doubles with each 10-year delay. Not financial advice.
0 Comments
Be the first to share your thoughts on this article.