
Investing
How Fast Can $300,000 Double With Fidelity Index Funds?
FXAIX, Fidelity’s S&P 500 index fund, has returned +14.80% per year over the past 10 years and charges just 0.015%. Its zero-fee sibling FZROX is completely free to own. At the Rule of 72, $300,000 invested in FXAIX at its 10-year actual return rate would double in under five years — though past performance is not a guarantee of future results. This guide does the full maths, fund by fund, scenario by scenario, so you can see exactly what the numbers look like before you invest. Not financial advice.
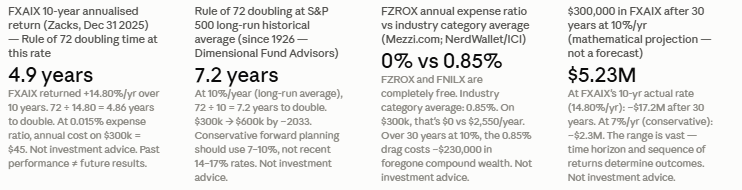
Fidelity is a natural home for this question. Its index fund lineup is among the cheapest, most widely accessible, and best-performing in the industry. FXAIX, the Fidelity 500 Index Fund, holds approximately $740 billion in net assets, charges just 0.015% in annual fees, and has returned +14.80% per year over the past decade with a percentile rank of 2nd in its category over 10 years (Zacks, December 31, 2025). FZROX, the Fidelity ZERO Total Market Index Fund, charges literally nothing — a 0.00% expense ratio — and has returned +10.06% per year since its August 2018 inception (TotalRealReturns.com).
This article does the maths you actually need: the Rule of 72 applied to each major Fidelity index fund at its recent return rates; the full compound growth table for $300,000 across 5, 10, 20, and 30 years; the fee savings comparison between zero-cost and low-cost funds; and the important caveats about sequence of returns risk that the headline numbers do not include. Not financial advice.
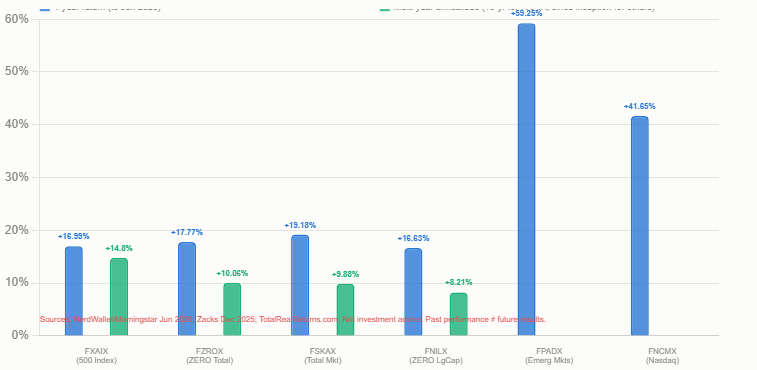
FXAIX 10-year annualised return: +14.80% (Zacks, December 31, 2025); +11.81%/yr CPI-adjusted (TotalRealReturns.com to June 2026). FXAIX 5-year: +14.41% (Zacks). FZROX since inception (Aug 2018 to June 2026): +10.06%/yr (TotalRealReturns.com). FZROX 1-year: +17.77% to June 29, 2026. FSKAX since Aug 2018: +9.88%/yr. Net assets FXAIX: ~$740bn. FXAIX expense ratio: 0.015%. FZROX expense ratio: 0.00%. Average index fund expense ratio 2025: 0.05% (Investment Company Institute). FXAIX Morningstar 10-year percentile rank: 2nd in category. Sources: Zacks; NerdWallet/Morningstar (June 2026); Mezzi.com; TotalRealReturns.com. Not investment advice.
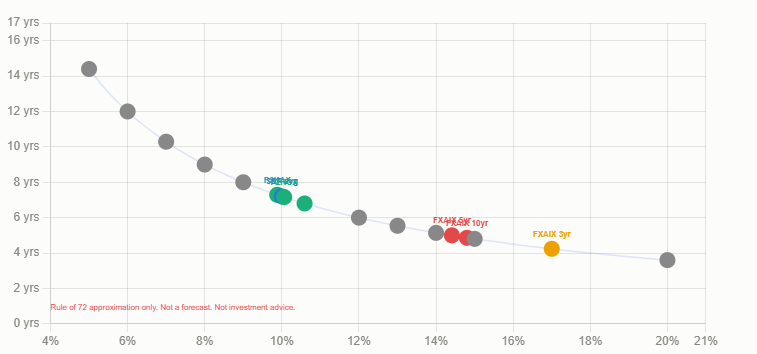
Applied to $300,000: at 10% annual return (the S&P 500’s long-run historical average), 72/10 = 7.2 years to double to $600,000. At 14.80% (FXAIX’s actual 10-year annualised return), 72/14.80 = 4.86 years to double. At 7% (a conservative forward estimate sometimes used in financial planning), 72/7 = 10.3 years. At the most recent 1-year FXAIX return of +16.99%, 72/16.99 = 4.24 years — but using single-year returns for projections is the most dangerous move in investment analysis.
The Rule of 72 also works backwards: if you want to know what return rate is needed to double your money in a specific time, divide 72 by the number of years. To double in 6 years: 72/6 = 12% annual return required. To double in 10 years: 7.2% required. To double in 5 years: 14.4% required. FXAIX’s 10-year actual return of 14.80% has been just above that 5-year doubling threshold, meaning an investor who bought $300,000 of FXAIX 10 years ago has seen it more than double using that actual rate. Not investment advice.
Rule of 72: The Rule of 72 applied to $300,000: at 7%/yr: doubles in 10.3 years ($300k → $600k by ~2036). At 8%/yr: doubles in 9 years ($300k → $600k by ~2035). At 10%/yr (S&P 500 long-run avg): doubles in 7.2 years ($300k → $600k by ~2033). At 12%/yr: doubles in 6 years ($300k → $600k by ~2032). At 14.80%/yr (FXAIX 10-yr actual): doubles in 4.86 years ($300k → $600k by ~2031). At 17%/yr (FXAIX 3-yr actual): doubles in 4.24 years ($300k → $600k by ~2030). CRITICAL CAVEAT: these are mathematical projections, not forecasts. Past returns are not indicative of future results. Not investment advice.
The performance record is remarkable by any measure. Over the 10 years to December 31, 2025 (Zacks), FXAIX has returned +14.80% per year annualised. Over 5 years: +14.41%. Over 3 years: +22.99%. Over 1 year (2025 full year): +17.86%. Since inception in May 2011 through December 2025: +13.89% per year. In the Morningstar database, FXAIX ranks in the 2nd percentile of its category over 10 years — meaning it has outperformed 98% of comparable funds over that period, almost entirely because of the compounding cost advantage of its near-zero expense ratio.
It is essential to contextualise these numbers. The 10-year and 5-year return periods in question both occurred during an extended bull market in US large-cap equities, driven particularly by the technology sector’s dominance in the S&P 500. The 3-year return of +22.99% per year includes the AI investment wave of 2023–2025. These are not ‘typical’ returns in the sense of what one should expect going forward — they are the returns of a specific, unusually strong period. The S&P 500’s long-run average since 1926 is approximately 10% per year, which is a more conservative basis for projections beyond current momentum. Not investment advice.
FXAIX — Fidelity 500 Index Fund (2026 snapshot): Expense ratio: 0.015%. Net assets: ~$740bn. Benchmark: S&P 500 Index. 1-year return (2025): +17.86%. 3-year annualised: +22.99%. 5-year annualised: +14.41%. 10-year annualised: +14.80%. Since inception (May 2011): +13.89%. Morningstar 10-year rank: 2nd percentile in category (top 2%). Annual cost on $300,000: $45. Rule of 72 at 10-yr actual: doubles every 4.86 years. Sources: Zacks (December 31, 2025); Yahoo Finance; Mezzi.com; NerdWallet/Morningstar (June 2026). Not investment advice. Past performance does not predict future results.
That caveat aside, the performance is competitive. From its inception on August 3, 2018, through June 23, 2026, FZROX returned +112.95% in total (+10.06% per year), compared to FXAIX’s +121.16% total (+10.59% per year) over the same period (TotalRealReturns.com). The 0.53% per year difference in total return over that period closely tracks the 0.015% fee advantage FXAIX does not actually have over FZROX — since FZROX is cheaper. The slight FXAIX outperformance reflects its focus on large-cap S&P 500 stocks, which outperformed smaller caps over this specific period.
FZROX holds Morningstar’s Gold Medalist Rating — its highest designation — reflecting confidence in the fund’s structural advantages and long-term prospects. Its 3-year annualised return is +20.29% (Mezzi.com, January 31, 2026) and its 1-year return is +17.77% to June 29, 2026 (TotalRealReturns.com). For a $300,000 investment using the since-inception rate of 10.06% per year, the Rule of 72 gives a doubling time of 72/10.06 = 7.16 years. Not investment advice.
FZROX — Fidelity ZERO Total Market Index Fund (2026 snapshot): Expense ratio: 0.00% (zero). Net assets: ~$33.5bn (February 2026). Benchmark: Fidelity U.S. Total Market Index (proprietary). 1-year return: +17.77% (to June 29, 2026). 3-year annualised: +20.29%. 5-year annualised: +13.75%. Since inception (Aug 2018): +10.06%/yr (+112.95% total). Annual cost on $300,000: $0.00. Rule of 72 at since-inception rate: doubles every 7.16 years. Morningstar rating: Gold Medalist. CAVEAT: Fidelity-only; not transferable to other brokers.
On $300,000 invested, the annual cost of FSKAX is $45 per year — compared to $0 for FZROX. For most investors, this $45 annual difference is immaterial, particularly in a tax-sheltered account. But over 30 years with compounding, even $45 per year at 10% growth represents a theoretical opportunity cost of approximately $7,400 compared to FZROX — still very small relative to the investment amount. The portability argument cuts both ways: if you never plan to leave Fidelity, FZROX’s zero fee makes it marginally preferable; if there is any chance you will transfer your account, FSKAX’s portability may be worth the $45 per year.
Performance: from August 3, 2018 to June 23, 2026, FSKAX returned +110.29% in total (+9.88% per year), closely tracking FZROX’s +112.95% over the same period. The near-identical performance confirms that the two funds provide essentially equivalent market exposure over time. At 9.88% per year, the Rule of 72 gives FSKAX a doubling time of 72/9.88 = 7.29 years for $300,000. Not investment advice.
Performance has been strong. To June 29, 2026 (TotalRealReturns.com), FNILX returned +16.63% over one year, with a 3-year annualised return of +17.17% per year and a 5-year annualised return of +8.21% per year. Morningstar rates it 4 stars with a Gold Medalist designation and ranks it in the 386th percentile out of 2,754 funds in the Growth & Income peer group for 5-year performance (Mezzi.com). Its expense ratio is 0.00% — like FZROX, completely free, and like FZROX, available only at Fidelity.
The key distinction between FNILX and FZROX is scope: FNILX focuses specifically on large-cap companies, while FZROX includes the entire US market (large, mid, and small caps). In a period when large-cap outperforms small-cap (as has generally been the case in recent years), FNILX and FXAIX tend to outperform FZROX and FSKAX. In periods when smaller companies lead, the broad market funds have an advantage. For a $300,000 investment, using FNILX’s 5-year actual rate of 8.21% per year, the Rule of 72 gives a doubling time of 72/8.21 = 8.77 years. Not investment advice.
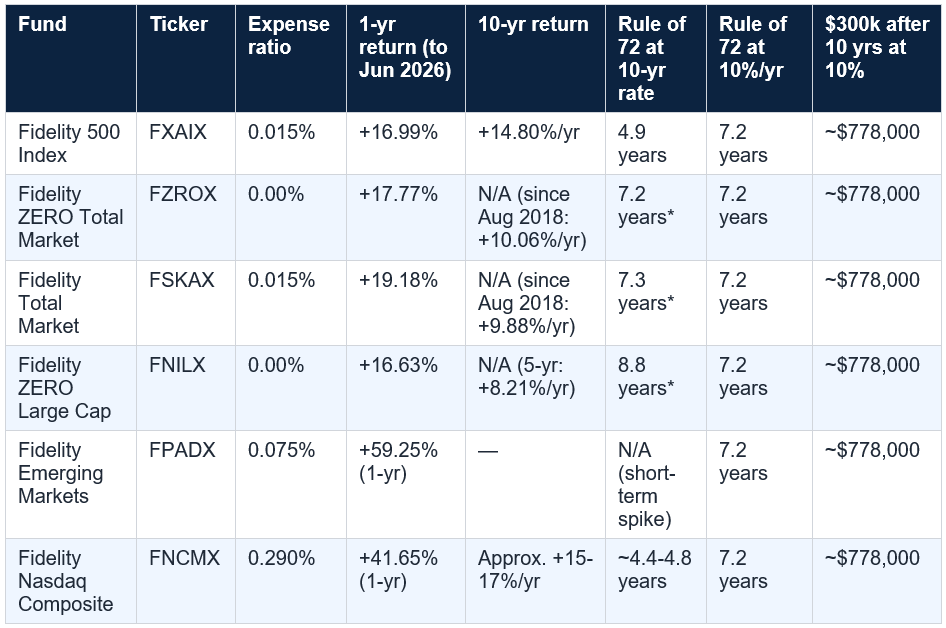
*FZROX and FSKAX inception: August 2018. FNILX: 5-year rate used for Rule of 72. Note: the 10% scenario column uses the S&P 500 long-run historical average for comparison. The $300k after 10 years at 10%/yr column is the same for all funds as it uses a uniform return assumption. Actual returns will differ. Sources: TotalRealReturns.com; Zacks; NerdWallet/Morningstar (June 2026); Mezzi.com. Not investment advice. Past performance does not predict future results.
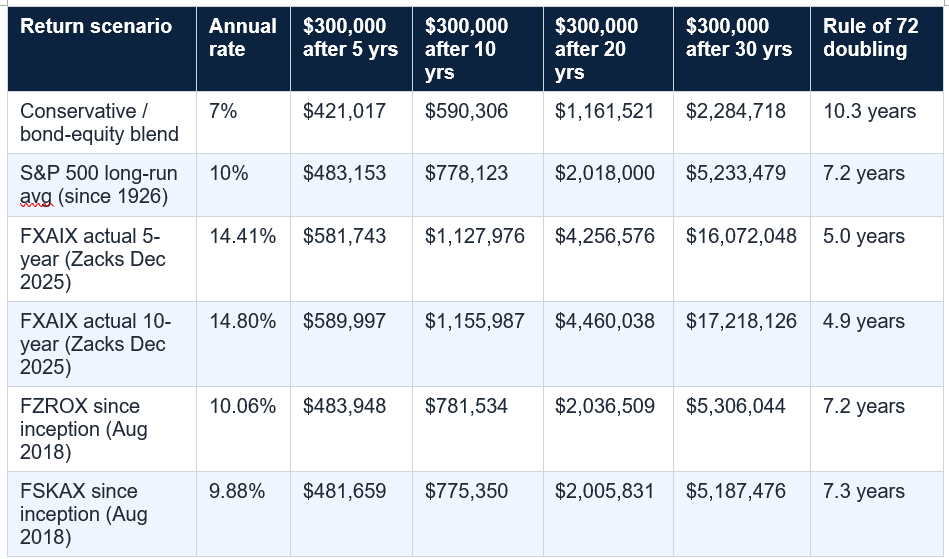
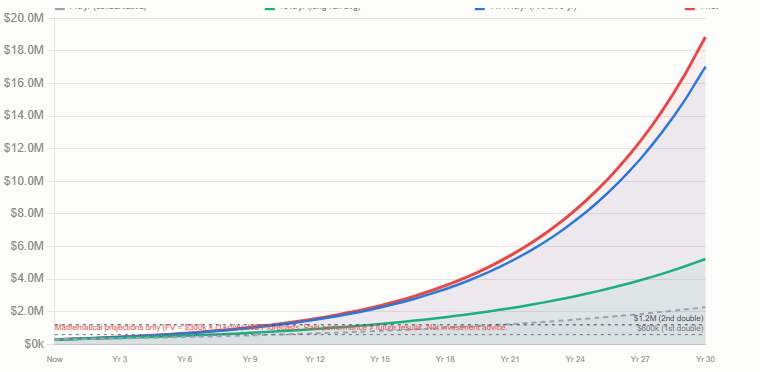
All figures are mathematical compound interest projections: FV = $300,000 × (1 + r)^n. These are not forecasts or guarantees. Actual returns will vary significantly year to year. The 14.41% and 14.80% scenarios reflect specific recent periods and may not be representative of future returns. The 7% and 10% scenarios are more defensible for long-run planning. Not investment advice.
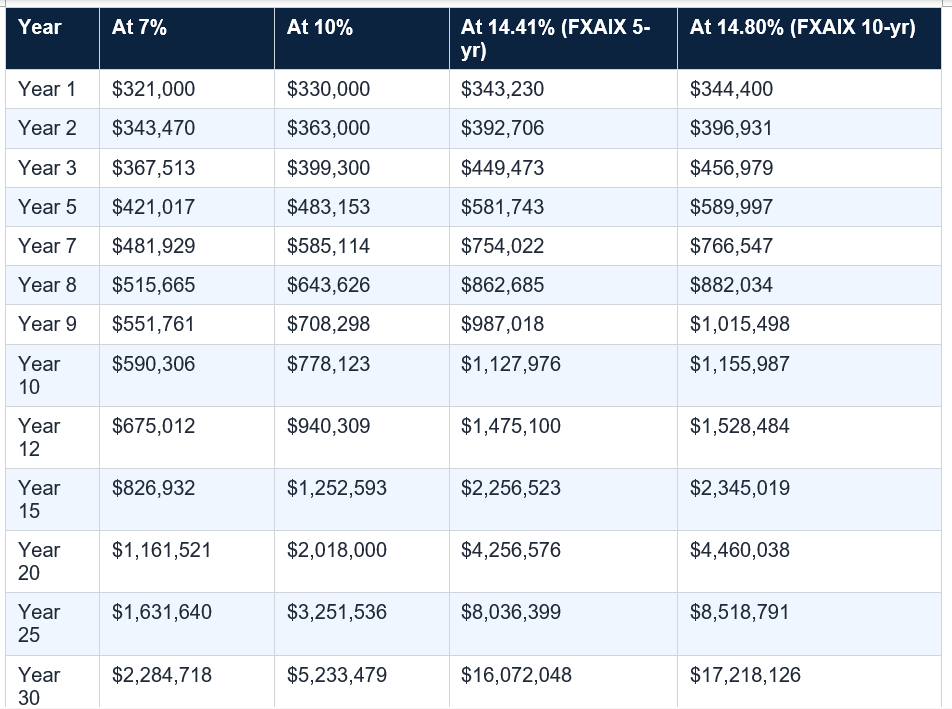
All figures are compound interest projections: FV = $300,000 × (1 + r)^n. Not forecasts or guarantees. Actual returns vary significantly. The highlighted years (10, 20, 30) are often used as planning milestones. Note the first doubling at each rate: at 7%, first doubling approximately year 10.3 ($600k). At 10%, approximately year 7.2 ($600k). At 14.80%, approximately year 4.9 ($600k). By year 30 at 14.80%, $300,000 has doubled approximately 6.1 times. Not investment advice.
NerdWallet’s illustration (using Investment Company Institute data) makes the stakes concrete: on a $7,500 per year IRA contribution at 6% average return over 30 years, a 0.05% expense ratio costs $6,400 in foregone compound returns. That is not $6,400 in fees paid — it is $6,400 that could have been earning compound interest instead of going to the fund manager. On a $300,000 investment at 0.05%, the annual fee is $150. At 0.015%, it is $45. At 0.00%, it is $0. The industry category average of 0.85% (Mezzi.com) would cost $2,550 per year on $300,000 — nearly $29,000 more over a decade in fees alone before compounding.
The compounding fee drag matters more as portfolio size grows. At $300,000, the difference between 0.015% (FXAIX) and 0.00% (FZROX) is $45 per year — genuinely immaterial. The real competition for fee-conscious investors is between Fidelity’s near-zero lineup and the industry average: 0.015% versus 0.85% is a difference of 0.835% per year. On $300,000 over 30 years at 10% base return, that fee drag compounds to approximately $95,000 of foregone wealth. Not investment advice.
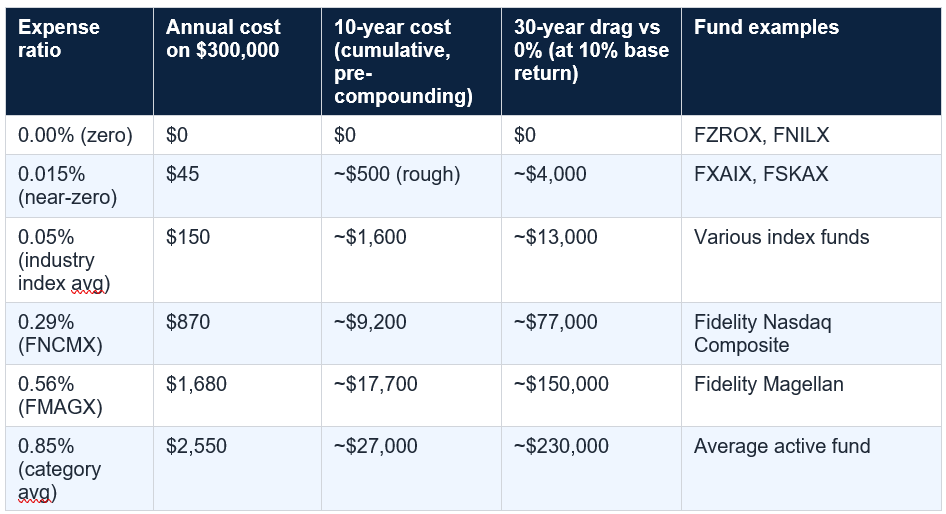
All 30-year drag figures are illustrative estimates based on compound interest modelling. Actual drag depends on the specific return sequence, contribution schedule, and tax treatment. Sources: Investment Company Institute (2025 average); Mezzi.com (category average); NerdWallet (June 2026). Not investment advice.
Several structural factors explain the elevated returns of the past decade. First, the technology sector’s expansion as a share of S&P 500 market capitalisation: by 2026, the top 10 holdings in FXAIX represent roughly 30–35% of the entire fund, dominated by Microsoft, Apple, Nvidia, Amazon, and Alphabet. The extraordinary performance of these companies — particularly in the AI investment wave that accelerated from 2023 — has disproportionately lifted index fund returns. Second, the interest rate environment: the decade from 2012 to 2022 was the longest sustained low-interest-rate period in US history, providing a structural tailwind to equity valuations. Third, strong corporate earnings growth fuelled by globalisation, technology adoption, and record profit margins.
None of these tailwinds are guaranteed to continue at the same intensity. The AI-driven technology sector could cool. Profit margins could compress. The interest rate normalisation of 2022–2024 may constrain future PE expansion. This is why experienced financial planners typically use 7–10% as the long-run projection for equity index funds rather than 14–15%, and why the 10% column in the compound growth tables above is a more defensible planning assumption than the ‘14.80%’ column, even though 14.80% is the actual 10-year number. Not investment advice.
Sequence of returns risk refers to the danger that poor returns in the early years of an investment (or in the early years of retirement withdrawals) have a disproportionately large impact on terminal wealth compared to the same returns occurring later. A 40% loss in year one on $300,000 leaves you with $180,000, which then needs a 66.7% gain to recover. A 40% loss in year 20 on $5,000,000 is far more damaging in absolute terms but far less damaging to the long-run growth trajectory of the investment.
The practical implication: $300,000 invested in FXAIX today could, in a bad-sequence scenario, be worth significantly less than $300,000 five years from now. The compound growth tables in this article are not predictions; they are the result of applying a constant rate to the starting amount. They show what happens if the average rate is achieved smoothly, not what happens if the path is volatile. The appropriate response to this risk is a time horizon long enough to survive bad sequences (generally 10+ years for equity index funds), a diversified portfolio that is not 100% in one fund, and the psychological and financial ability to not sell during market downturns. Not investment advice.
THE MOST IMPORTANT CAVEAT: No compound growth table shows you what the journey looks like. Between your $300,000 starting point and the projected terminal value, your investment could fall 30-50% in a given year or series of years. The S&P 500 fell -34.92% at its worst point in 2020 (from the February peak to the March 23 trough, per TotalRealReturns.com). It fell -33.75% in the same period for FXAIX. Anyone who sold at the bottom in March 2020 did not participate in the subsequent recovery. The most dangerous time to check your portfolio is during a market correction — when the numbers are frightening, selling locks in losses that time would otherwise have healed. Not investment advice. Consult a qualified financial adviser.
For a $300,000 investment, the difference between taxable and tax-sheltered compounding is material. In a taxable account, dividends from FXAIX (currently approximately 1.11% yield per year) are taxed as ordinary income or qualified dividends each year. Capital gains are taxed when shares are sold. In a Roth IRA, all of this disappears: dividends reinvest without a tax event, capital gains never trigger a tax, and withdrawals in retirement are completely free of income tax. The $5.2 million terminal value at 10% over 30 years in a Roth IRA stays at $5.2 million; in a taxable account, the equivalent number is significantly lower depending on the investor’s marginal tax rate.
The IRA contribution limit for 2026 is $7,000 per year (or $8,000 for those 50 and over). A $300,000 lump sum cannot go into an IRA in one year — but it can be held in a Roth IRA that was built through years of contributions, or it can be placed in a rollover IRA from a 401(k), or it can be invested in a 401(k) plan if the individual is still employed. For those with $300,000 to invest, maximising the tax-sheltered portion — particularly a Roth IRA where growth is permanently tax-free — is one of the highest-value actions available. Not tax or investment advice. Consult a qualified tax adviser and financial planner.
A simple illustration: $300,000 invested in FXAIX at 10% annual return for 30 years grows to approximately $5.23 million (lump sum alone). Adding $10,000 per year in additional contributions at the same 10% return for 30 years adds approximately $1.64 million. Combined: approximately $6.87 million after 30 years from a $300,000 starting point plus $10,000 per year contributions. This is the power of stacking a lump sum with regular contributions: the lump sum does the heavy compounding, while regular contributions build a parallel growth stream.
Fidelity makes this particularly convenient through its automatic investment features. Investors can set up automatic monthly transfers from a bank account to a Fidelity fund, reinvesting dividends automatically, without any manual action required. The investment continues to compound whether the investor is watching or not. This automation removes the behavioural risk of market timing — the tendency to stop investing during market downturns, precisely when new contributions are buying at lower prices. Not investment advice.
The single highest-impact action you can take with a $300,000 investment: combine it with automatic monthly contributions. Even $500 per month ($6,000 per year) added to a $300,000 lump sum at 10% annual growth adds approximately $984,000 to the 30-year outcome compared to the lump sum alone. The monthly contributions are individually small relative to the $300,000 base, but their compound growth over decades is substantial. Set up automatic investment from day one and do not change it in a downturn. Not investment advice.
What is reliable: Fidelity’s expense ratios are among the lowest in the industry. FZROX and FNILX are genuinely free. FXAIX charges $45 per year on $300,000. The mathematical advantage of low fees compounds over time just as returns do. An investor in FXAIX keeps approximately $230,000 more over 30 years compared to an investor in the average category fund at 0.85% expense ratio, simply from the fee difference at the same underlying return.
The compound growth tables in this article show the mathematics with clarity. What they cannot show is the path — the -34.92% drawdown of March 2020 that many investors fled, the -18% of 2022 that felt permanent, the decade of 2000–2009 when the S&P 500 ended lower than it started. The investors who captured the 14.80% 10-year return of FXAIX are those who stayed invested through all of it. That is not a mathematical achievement; it is a psychological and behavioural one. The maths is the easy part. Not financial advice. Always consult a qualified independent financial adviser.
Using the Rule of 72 (a mathematical approximation, not a guarantee): at the S&P 500's long-run historical average of 10% per year, $300,000 doubles in approximately 7.2 years. At FXAIX's actual 10-year annualised return of 14.80% (Zacks, December 31, 2025), the Rule of 72 gives a doubling time of approximately 4.86 years. At a conservative 7% projection, it doubles in approximately 10.3 years. These are mathematical projections from a constant assumed return rate. Actual returns are volatile and uneven — in any given year, FXAIX could return +30% or -20%. The compound growth projections assume a constant rate applied smoothly, which does not reflect real market behaviour. Not investment advice. Past performance does not predict future results.
Is FZROX or FXAIX better for a $300,000 investment?
Both are excellent choices for a long-term lump-sum investment. Key differences: FZROX has a 0.00% expense ratio (completely free to own); FXAIX charges 0.015% ($45/year on $300,000). FXAIX tracks the S&P 500 (500 large-cap US companies); FZROX tracks the Fidelity U.S. Total Market Index (all US companies, including mid and small caps). FXAIX has a longer track record (since 2011 vs FZROX's August 2018 inception). From their common comparison period (Aug 2018 to June 2026), FXAIX returned +121.16% vs FZROX +112.95% (TotalRealReturns.com). FZROX cannot be transferred to other brokers; FXAIX can. For most long-term Fidelity investors, either fund is an excellent choice. The fee advantage of FZROX ($45/year on $300,000) is minimal; the portability advantage of FXAIX is more meaningful if there is any chance of switching brokers. Not investment advice.
What is the Rule of 72 and how does it apply to index funds?
The Rule of 72 is a mathematical shortcut: divide 72 by the annual percentage return rate to estimate the number of years required for an investment to double. Examples for $300,000: at 7%/yr, 72/7 = 10.3 years to $600,000; at 10%/yr, 72/10 = 7.2 years; at 14.80% (FXAIX 10-yr actual), 72/14.80 = 4.86 years; at 17% (FXAIX 3-yr actual), 72/17 = 4.24 years. The Rule of 72 is accurate for annual returns between approximately 5% and 20%. The critical caveat: it assumes a constant smooth annual return, which real markets do not deliver. The actual time to double will depend on the sequence of actual annual returns, which may be higher or lower than the assumed rate. Not investment advice.
How much will $300,000 in FXAIX be worth in 10 years?
This depends entirely on future returns, which cannot be predicted. Using historical return rates as a mathematical illustration (NOT a forecast): at 10%/yr (S&P 500 long-run average), $300,000 grows to approximately $778,000 in 10 years. At 14.80%/yr (FXAIX's actual 10-year return to December 2025), approximately $1,156,000. At 7%/yr (conservative estimate), approximately $590,000. These are compound interest calculations (FV = $300,000 × (1+r)^10) and are not forecasts or guarantees. Actual returns will vary significantly based on market conditions during the period. The S&P 500 has had decades that returned well below 7% (2000-2009) and decades that returned well above 14% (2010-2019). Not investment advice. Past performance does not predict future results.
Are there any risks to investing $300,000 in Fidelity index funds?
Yes, significant risks exist. Investment risk: index funds invest in stocks, which can decline substantially in value. The S&P 500 fell approximately 34.92% from peak to trough in the COVID crash of 2020. It fell approximately 37% in 2008. A $300,000 investment at the peak before such a decline would temporarily be worth roughly $198,000. Sequence of returns risk: poor returns in early years can significantly affect long-term outcomes. Concentration risk: Fidelity's FZROX and FNILX use proprietary indices; if Fidelity discontinued these funds or significantly changed their structure, investors would face decisions. Portability risk: FZROX and FNILX cannot be transferred to other brokers. Market risk: the US stock market, which dominates these funds, may underperform global markets for extended periods. Inflation risk: all returns shown are nominal; real (inflation-adjusted) returns are lower. Not investment advice. Always consult a qualified financial adviser.
Table of Contents
- The Question Everyone Is Actually Asking
- The Rule of 72: The Fastest Way to Calculate Doubling Time
- FXAIX — Fidelity 500 Index Fund: The Core S&P 500 Tracker
- FZROX — Fidelity ZERO Total Market Index Fund: Completely Free
- FSKAX — Fidelity Total Market Index Fund: The Near-Free Alternative
- FNILX — Fidelity ZERO Large Cap Index Fund: The Other Free Option
- Fund-by-Fund Doubling Time Comparison
- $300,000 at 10 Years: Four Return Scenarios Side by Side
- The Full 30-Year Compound Growth Table
- The Zero Expense Ratio Advantage: What ‘Free’ Actually Saves You
- Why These Funds Have Performed So Well Recently
- The Caveat That Changes Everything: Sequence of Returns Risk
- Tax-Sheltered Accounts: The Multiplier Nobody Talks About
- Combining Regular Contributions With a $300,000 Lump Sum
- Conclusion: The Maths Is Compelling, But the Discipline Is the Hard Part
- Frequently Asked Questions
$300k compound growth — four scenarios over 30 years
Fund comparison -- returns, fees & doubling times
Rule of 72 — return rate vs doubling time
The Question Everyone Is Actually Asking
The question ‘how fast can $300,000 double’ is, at its core, a compound growth problem with two variables: the starting amount and the rate of return. The starting amount is fixed at $300,000. The rate of return depends entirely on which fund you choose, how long you hold it, and what the market does during that period. The answer to the doubling question ranges from ‘about four and a half years’ (using FXAIX’s actual 10-year return of 14.80% per year) to ‘about ten years’ (using a conservative 7% long-run projection) to ‘who knows’ if you pick a bad decade.Fidelity is a natural home for this question. Its index fund lineup is among the cheapest, most widely accessible, and best-performing in the industry. FXAIX, the Fidelity 500 Index Fund, holds approximately $740 billion in net assets, charges just 0.015% in annual fees, and has returned +14.80% per year over the past decade with a percentile rank of 2nd in its category over 10 years (Zacks, December 31, 2025). FZROX, the Fidelity ZERO Total Market Index Fund, charges literally nothing — a 0.00% expense ratio — and has returned +10.06% per year since its August 2018 inception (TotalRealReturns.com).
This article does the maths you actually need: the Rule of 72 applied to each major Fidelity index fund at its recent return rates; the full compound growth table for $300,000 across 5, 10, 20, and 30 years; the fee savings comparison between zero-cost and low-cost funds; and the important caveats about sequence of returns risk that the headline numbers do not include. Not financial advice.
FXAIX 10-year annualised return: +14.80% (Zacks, December 31, 2025); +11.81%/yr CPI-adjusted (TotalRealReturns.com to June 2026). FXAIX 5-year: +14.41% (Zacks). FZROX since inception (Aug 2018 to June 2026): +10.06%/yr (TotalRealReturns.com). FZROX 1-year: +17.77% to June 29, 2026. FSKAX since Aug 2018: +9.88%/yr. Net assets FXAIX: ~$740bn. FXAIX expense ratio: 0.015%. FZROX expense ratio: 0.00%. Average index fund expense ratio 2025: 0.05% (Investment Company Institute). FXAIX Morningstar 10-year percentile rank: 2nd in category. Sources: Zacks; NerdWallet/Morningstar (June 2026); Mezzi.com; TotalRealReturns.com. Not investment advice.
The Rule of 72: The Fastest Way to Calculate Doubling Time
The Rule of 72 is one of the most useful shortcuts in all of personal finance. Divide 72 by your annual rate of return, and the answer is approximately how many years it will take your money to double. It works because of the mathematics of compound interest: at a constant annual rate r, the number of years to double is ln(2)/ln(1+r), which approximates to 72/r for rates between 5% and 20%.Applied to $300,000: at 10% annual return (the S&P 500’s long-run historical average), 72/10 = 7.2 years to double to $600,000. At 14.80% (FXAIX’s actual 10-year annualised return), 72/14.80 = 4.86 years to double. At 7% (a conservative forward estimate sometimes used in financial planning), 72/7 = 10.3 years. At the most recent 1-year FXAIX return of +16.99%, 72/16.99 = 4.24 years — but using single-year returns for projections is the most dangerous move in investment analysis.
The Rule of 72 also works backwards: if you want to know what return rate is needed to double your money in a specific time, divide 72 by the number of years. To double in 6 years: 72/6 = 12% annual return required. To double in 10 years: 7.2% required. To double in 5 years: 14.4% required. FXAIX’s 10-year actual return of 14.80% has been just above that 5-year doubling threshold, meaning an investor who bought $300,000 of FXAIX 10 years ago has seen it more than double using that actual rate. Not investment advice.
Rule of 72: The Rule of 72 applied to $300,000: at 7%/yr: doubles in 10.3 years ($300k → $600k by ~2036). At 8%/yr: doubles in 9 years ($300k → $600k by ~2035). At 10%/yr (S&P 500 long-run avg): doubles in 7.2 years ($300k → $600k by ~2033). At 12%/yr: doubles in 6 years ($300k → $600k by ~2032). At 14.80%/yr (FXAIX 10-yr actual): doubles in 4.86 years ($300k → $600k by ~2031). At 17%/yr (FXAIX 3-yr actual): doubles in 4.24 years ($300k → $600k by ~2030). CRITICAL CAVEAT: these are mathematical projections, not forecasts. Past returns are not indicative of future results. Not investment advice.
FXAIX — Fidelity 500 Index Fund: The Core S&P 500 Tracker
FXAIX is the largest mutual fund in Fidelity’s index lineup and one of the most widely held index funds in the world. With approximately $740 billion in net assets as of early 2026 (Yahoo Finance), it is invested in the 500 largest US companies by market capitalisation, tracking the S&P 500 Index with near-perfect fidelity (a tracking error that rounds to zero at this scale). Its expense ratio of 0.015% means that on $300,000 invested, the annual cost to own the fund is $45. That is not a typo: forty-five dollars per year.The performance record is remarkable by any measure. Over the 10 years to December 31, 2025 (Zacks), FXAIX has returned +14.80% per year annualised. Over 5 years: +14.41%. Over 3 years: +22.99%. Over 1 year (2025 full year): +17.86%. Since inception in May 2011 through December 2025: +13.89% per year. In the Morningstar database, FXAIX ranks in the 2nd percentile of its category over 10 years — meaning it has outperformed 98% of comparable funds over that period, almost entirely because of the compounding cost advantage of its near-zero expense ratio.
It is essential to contextualise these numbers. The 10-year and 5-year return periods in question both occurred during an extended bull market in US large-cap equities, driven particularly by the technology sector’s dominance in the S&P 500. The 3-year return of +22.99% per year includes the AI investment wave of 2023–2025. These are not ‘typical’ returns in the sense of what one should expect going forward — they are the returns of a specific, unusually strong period. The S&P 500’s long-run average since 1926 is approximately 10% per year, which is a more conservative basis for projections beyond current momentum. Not investment advice.
FXAIX — Fidelity 500 Index Fund (2026 snapshot): Expense ratio: 0.015%. Net assets: ~$740bn. Benchmark: S&P 500 Index. 1-year return (2025): +17.86%. 3-year annualised: +22.99%. 5-year annualised: +14.41%. 10-year annualised: +14.80%. Since inception (May 2011): +13.89%. Morningstar 10-year rank: 2nd percentile in category (top 2%). Annual cost on $300,000: $45. Rule of 72 at 10-yr actual: doubles every 4.86 years. Sources: Zacks (December 31, 2025); Yahoo Finance; Mezzi.com; NerdWallet/Morningstar (June 2026). Not investment advice. Past performance does not predict future results.
FZROX — Fidelity ZERO Total Market Index Fund: Completely Free
FZROX was something genuinely unprecedented when Fidelity launched it in August 2018: a mutual fund with a 0.00% expense ratio. No management fee. No annual charge. Free to own for as long as you hold it, with one critical caveat: it is only available to Fidelity account holders. Unlike FXAIX or FSKAX, which can be held at various brokers, FZROX uses a proprietary Fidelity index (the Fidelity U.S. Total Market Index) specifically to avoid licensing fees, and the zero-fee share class cannot be transferred to another brokerage. If you ever move your account away from Fidelity, you would need to sell FZROX — triggering a taxable event in a non-tax-sheltered account — or convert to a regular fee-bearing fund.That caveat aside, the performance is competitive. From its inception on August 3, 2018, through June 23, 2026, FZROX returned +112.95% in total (+10.06% per year), compared to FXAIX’s +121.16% total (+10.59% per year) over the same period (TotalRealReturns.com). The 0.53% per year difference in total return over that period closely tracks the 0.015% fee advantage FXAIX does not actually have over FZROX — since FZROX is cheaper. The slight FXAIX outperformance reflects its focus on large-cap S&P 500 stocks, which outperformed smaller caps over this specific period.
FZROX holds Morningstar’s Gold Medalist Rating — its highest designation — reflecting confidence in the fund’s structural advantages and long-term prospects. Its 3-year annualised return is +20.29% (Mezzi.com, January 31, 2026) and its 1-year return is +17.77% to June 29, 2026 (TotalRealReturns.com). For a $300,000 investment using the since-inception rate of 10.06% per year, the Rule of 72 gives a doubling time of 72/10.06 = 7.16 years. Not investment advice.
FZROX — Fidelity ZERO Total Market Index Fund (2026 snapshot): Expense ratio: 0.00% (zero). Net assets: ~$33.5bn (February 2026). Benchmark: Fidelity U.S. Total Market Index (proprietary). 1-year return: +17.77% (to June 29, 2026). 3-year annualised: +20.29%. 5-year annualised: +13.75%. Since inception (Aug 2018): +10.06%/yr (+112.95% total). Annual cost on $300,000: $0.00. Rule of 72 at since-inception rate: doubles every 7.16 years. Morningstar rating: Gold Medalist. CAVEAT: Fidelity-only; not transferable to other brokers.
FSKAX — Fidelity Total Market Index Fund: The Near-Free Alternative
FSKAX is Fidelity’s alternative to FZROX for investors who value portability over zero fees. It tracks the Dow Jones U.S. Total Stock Market Index (a standard public index, unlike FZROX’s proprietary Fidelity index), charges 0.015% per year — the same as FXAIX — and is available at multiple brokers rather than being locked to Fidelity.On $300,000 invested, the annual cost of FSKAX is $45 per year — compared to $0 for FZROX. For most investors, this $45 annual difference is immaterial, particularly in a tax-sheltered account. But over 30 years with compounding, even $45 per year at 10% growth represents a theoretical opportunity cost of approximately $7,400 compared to FZROX — still very small relative to the investment amount. The portability argument cuts both ways: if you never plan to leave Fidelity, FZROX’s zero fee makes it marginally preferable; if there is any chance you will transfer your account, FSKAX’s portability may be worth the $45 per year.
Performance: from August 3, 2018 to June 23, 2026, FSKAX returned +110.29% in total (+9.88% per year), closely tracking FZROX’s +112.95% over the same period. The near-identical performance confirms that the two funds provide essentially equivalent market exposure over time. At 9.88% per year, the Rule of 72 gives FSKAX a doubling time of 72/9.88 = 7.29 years for $300,000. Not investment advice.
FNILX — Fidelity ZERO Large Cap Index Fund: The Other Free Option
FNILX is Fidelity’s zero-fee large-cap fund, tracking the Fidelity U.S. Large Cap Index (another proprietary index constructed to avoid S&P 500 licensing fees) and providing exposure to large US companies in a way that closely resembles — but is not identical to — the S&P 500 that FXAIX tracks. The top holdings are effectively the same large-cap US companies, but the specific index construction methodology differs at the margins.Performance has been strong. To June 29, 2026 (TotalRealReturns.com), FNILX returned +16.63% over one year, with a 3-year annualised return of +17.17% per year and a 5-year annualised return of +8.21% per year. Morningstar rates it 4 stars with a Gold Medalist designation and ranks it in the 386th percentile out of 2,754 funds in the Growth & Income peer group for 5-year performance (Mezzi.com). Its expense ratio is 0.00% — like FZROX, completely free, and like FZROX, available only at Fidelity.
The key distinction between FNILX and FZROX is scope: FNILX focuses specifically on large-cap companies, while FZROX includes the entire US market (large, mid, and small caps). In a period when large-cap outperforms small-cap (as has generally been the case in recent years), FNILX and FXAIX tend to outperform FZROX and FSKAX. In periods when smaller companies lead, the broad market funds have an advantage. For a $300,000 investment, using FNILX’s 5-year actual rate of 8.21% per year, the Rule of 72 gives a doubling time of 72/8.21 = 8.77 years. Not investment advice.
Fund-by-Fund Doubling Time Comparison
The table below applies the Rule of 72 to each major Fidelity index fund at multiple return rate scenarios: the recent actual return, the long-run S&P 500 average (10%), and a conservative 7% projection for forward planning. Not investment advice.*FZROX and FSKAX inception: August 2018. FNILX: 5-year rate used for Rule of 72. Note: the 10% scenario column uses the S&P 500 long-run historical average for comparison. The $300k after 10 years at 10%/yr column is the same for all funds as it uses a uniform return assumption. Actual returns will differ. Sources: TotalRealReturns.com; Zacks; NerdWallet/Morningstar (June 2026); Mezzi.com. Not investment advice. Past performance does not predict future results.
$300,000 at 10 Years: Four Return Scenarios Side by Side
The most useful framing for a $300,000 investment is to model four return scenarios over 10 years: conservative (7%), long-run average (10%), FXAIX’s actual 5-year rate (14.41%), and FXAIX’s actual 10-year rate (14.80%). This gives a realistic range from the cautious to the historically achievable.All figures are mathematical compound interest projections: FV = $300,000 × (1 + r)^n. These are not forecasts or guarantees. Actual returns will vary significantly year to year. The 14.41% and 14.80% scenarios reflect specific recent periods and may not be representative of future returns. The 7% and 10% scenarios are more defensible for long-run planning. Not investment advice.
The Full 30-Year Compound Growth Table
The power of compound growth over three decades makes the short-term doubling calculation look modest. The table below shows $300,000 at each scenario milestone from year 5 to year 30. The most striking observation is the divergence between scenarios in the final decade: by year 30, the difference between 7% and 14.80% is approximately $14.9 million on the same $300,000 starting point. The compounding of small differences in annual return rate produces enormous differences in terminal value over long horizons.All figures are compound interest projections: FV = $300,000 × (1 + r)^n. Not forecasts or guarantees. Actual returns vary significantly. The highlighted years (10, 20, 30) are often used as planning milestones. Note the first doubling at each rate: at 7%, first doubling approximately year 10.3 ($600k). At 10%, approximately year 7.2 ($600k). At 14.80%, approximately year 4.9 ($600k). By year 30 at 14.80%, $300,000 has doubled approximately 6.1 times. Not investment advice.
The Zero Expense Ratio Advantage: What ‘Free’ Actually Saves You
Fidelity introduced the concept of the zero-expense-ratio index fund in 2018 with FZROX and FNILX. Eight years later, only Fidelity and E*TRADE offer true zero-fee index funds, according to NerdWallet (June 2026). The Investment Company Institute reports that the average expense ratio for index funds in 2025 was 0.05%. Fidelity’s FXAIX and FSKAX are already well below this at 0.015%, while FZROX and FNILX eliminate it entirely.NerdWallet’s illustration (using Investment Company Institute data) makes the stakes concrete: on a $7,500 per year IRA contribution at 6% average return over 30 years, a 0.05% expense ratio costs $6,400 in foregone compound returns. That is not $6,400 in fees paid — it is $6,400 that could have been earning compound interest instead of going to the fund manager. On a $300,000 investment at 0.05%, the annual fee is $150. At 0.015%, it is $45. At 0.00%, it is $0. The industry category average of 0.85% (Mezzi.com) would cost $2,550 per year on $300,000 — nearly $29,000 more over a decade in fees alone before compounding.
The compounding fee drag matters more as portfolio size grows. At $300,000, the difference between 0.015% (FXAIX) and 0.00% (FZROX) is $45 per year — genuinely immaterial. The real competition for fee-conscious investors is between Fidelity’s near-zero lineup and the industry average: 0.015% versus 0.85% is a difference of 0.835% per year. On $300,000 over 30 years at 10% base return, that fee drag compounds to approximately $95,000 of foregone wealth. Not investment advice.
All 30-year drag figures are illustrative estimates based on compound interest modelling. Actual drag depends on the specific return sequence, contribution schedule, and tax treatment. Sources: Investment Company Institute (2025 average); Mezzi.com (category average); NerdWallet (June 2026). Not investment advice.
Why These Funds Have Performed So Well Recently
The 14.80% 10-year return of FXAIX and the equivalent returns of the other large-cap-heavy Fidelity funds are extraordinary by historical standards. The S&P 500’s long-run average since 1926 is approximately 10% per year. The last decade has delivered nearly 15% per year — roughly half as much again as the historical norm. Understanding why helps calibrate expectations for the decade ahead.Several structural factors explain the elevated returns of the past decade. First, the technology sector’s expansion as a share of S&P 500 market capitalisation: by 2026, the top 10 holdings in FXAIX represent roughly 30–35% of the entire fund, dominated by Microsoft, Apple, Nvidia, Amazon, and Alphabet. The extraordinary performance of these companies — particularly in the AI investment wave that accelerated from 2023 — has disproportionately lifted index fund returns. Second, the interest rate environment: the decade from 2012 to 2022 was the longest sustained low-interest-rate period in US history, providing a structural tailwind to equity valuations. Third, strong corporate earnings growth fuelled by globalisation, technology adoption, and record profit margins.
None of these tailwinds are guaranteed to continue at the same intensity. The AI-driven technology sector could cool. Profit margins could compress. The interest rate normalisation of 2022–2024 may constrain future PE expansion. This is why experienced financial planners typically use 7–10% as the long-run projection for equity index funds rather than 14–15%, and why the 10% column in the compound growth tables above is a more defensible planning assumption than the ‘14.80%’ column, even though 14.80% is the actual 10-year number. Not investment advice.
The Caveat That Changes Everything: Sequence of Returns Risk
The doubling calculations in this article — and every compound interest table ever published — assume a smooth, constant annual return. Real markets do not deliver smooth returns. Real markets deliver years like 2022 (-18.11% for the S&P 500), 2008 (-37%), and 2000–2002 (three consecutive down years, -9%, -12%, -22%). The FXAIX quarterly return data from Zacks shows exactly this pattern: Q1 2025 was -4.27%, followed by Q2 +10.94%, Q3 +8.12%, Q4 +2.65%.Sequence of returns risk refers to the danger that poor returns in the early years of an investment (or in the early years of retirement withdrawals) have a disproportionately large impact on terminal wealth compared to the same returns occurring later. A 40% loss in year one on $300,000 leaves you with $180,000, which then needs a 66.7% gain to recover. A 40% loss in year 20 on $5,000,000 is far more damaging in absolute terms but far less damaging to the long-run growth trajectory of the investment.
The practical implication: $300,000 invested in FXAIX today could, in a bad-sequence scenario, be worth significantly less than $300,000 five years from now. The compound growth tables in this article are not predictions; they are the result of applying a constant rate to the starting amount. They show what happens if the average rate is achieved smoothly, not what happens if the path is volatile. The appropriate response to this risk is a time horizon long enough to survive bad sequences (generally 10+ years for equity index funds), a diversified portfolio that is not 100% in one fund, and the psychological and financial ability to not sell during market downturns. Not investment advice.
THE MOST IMPORTANT CAVEAT: No compound growth table shows you what the journey looks like. Between your $300,000 starting point and the projected terminal value, your investment could fall 30-50% in a given year or series of years. The S&P 500 fell -34.92% at its worst point in 2020 (from the February peak to the March 23 trough, per TotalRealReturns.com). It fell -33.75% in the same period for FXAIX. Anyone who sold at the bottom in March 2020 did not participate in the subsequent recovery. The most dangerous time to check your portfolio is during a market correction — when the numbers are frightening, selling locks in losses that time would otherwise have healed. Not investment advice. Consult a qualified financial adviser.
Tax-Sheltered Accounts: The Multiplier Nobody Talks About
The doubling calculations in this article assume gross returns. In a taxable account, capital gains and dividend distributions are taxed each year, reducing the effective compound return. In a tax-sheltered account — a Roth IRA, traditional IRA, or 401(k) — returns compound free of annual taxation, and in a Roth IRA, they compound entirely tax-free (no tax on qualified withdrawals, ever).For a $300,000 investment, the difference between taxable and tax-sheltered compounding is material. In a taxable account, dividends from FXAIX (currently approximately 1.11% yield per year) are taxed as ordinary income or qualified dividends each year. Capital gains are taxed when shares are sold. In a Roth IRA, all of this disappears: dividends reinvest without a tax event, capital gains never trigger a tax, and withdrawals in retirement are completely free of income tax. The $5.2 million terminal value at 10% over 30 years in a Roth IRA stays at $5.2 million; in a taxable account, the equivalent number is significantly lower depending on the investor’s marginal tax rate.
The IRA contribution limit for 2026 is $7,000 per year (or $8,000 for those 50 and over). A $300,000 lump sum cannot go into an IRA in one year — but it can be held in a Roth IRA that was built through years of contributions, or it can be placed in a rollover IRA from a 401(k), or it can be invested in a 401(k) plan if the individual is still employed. For those with $300,000 to invest, maximising the tax-sheltered portion — particularly a Roth IRA where growth is permanently tax-free — is one of the highest-value actions available. Not tax or investment advice. Consult a qualified tax adviser and financial planner.
Combining Regular Contributions With a $300,000 Lump Sum
Most investors do not simply invest $300,000 and wait. They continue to contribute regularly — whether through a 401(k) payroll deduction, annual IRA contributions, or regular transfers to a taxable brokerage account. The compound growth of the lump sum and the regular contributions combine to produce a terminal value significantly higher than either alone.A simple illustration: $300,000 invested in FXAIX at 10% annual return for 30 years grows to approximately $5.23 million (lump sum alone). Adding $10,000 per year in additional contributions at the same 10% return for 30 years adds approximately $1.64 million. Combined: approximately $6.87 million after 30 years from a $300,000 starting point plus $10,000 per year contributions. This is the power of stacking a lump sum with regular contributions: the lump sum does the heavy compounding, while regular contributions build a parallel growth stream.
Fidelity makes this particularly convenient through its automatic investment features. Investors can set up automatic monthly transfers from a bank account to a Fidelity fund, reinvesting dividends automatically, without any manual action required. The investment continues to compound whether the investor is watching or not. This automation removes the behavioural risk of market timing — the tendency to stop investing during market downturns, precisely when new contributions are buying at lower prices. Not investment advice.
The single highest-impact action you can take with a $300,000 investment: combine it with automatic monthly contributions. Even $500 per month ($6,000 per year) added to a $300,000 lump sum at 10% annual growth adds approximately $984,000 to the 30-year outcome compared to the lump sum alone. The monthly contributions are individually small relative to the $300,000 base, but their compound growth over decades is substantial. Set up automatic investment from day one and do not change it in a downturn. Not investment advice.
Conclusion
The answer to ‘how fast can $300,000 double with Fidelity index funds’ is: somewhere between 4.9 years (using FXAIX’s actual 10-year return of 14.80%) and 10.3 years (using a conservative 7% projection). The Rule of 72 gives the calculation instantly; the harder question is which rate to use. The honest answer is that no one knows what the next decade will return, and recent strong performance is not a reliable guide to future returns.What is reliable: Fidelity’s expense ratios are among the lowest in the industry. FZROX and FNILX are genuinely free. FXAIX charges $45 per year on $300,000. The mathematical advantage of low fees compounds over time just as returns do. An investor in FXAIX keeps approximately $230,000 more over 30 years compared to an investor in the average category fund at 0.85% expense ratio, simply from the fee difference at the same underlying return.
The compound growth tables in this article show the mathematics with clarity. What they cannot show is the path — the -34.92% drawdown of March 2020 that many investors fled, the -18% of 2022 that felt permanent, the decade of 2000–2009 when the S&P 500 ended lower than it started. The investors who captured the 14.80% 10-year return of FXAIX are those who stayed invested through all of it. That is not a mathematical achievement; it is a psychological and behavioural one. The maths is the easy part. Not financial advice. Always consult a qualified independent financial adviser.
Frequently Asked Questions
How long will it take $300,000 to double in Fidelity index funds?Using the Rule of 72 (a mathematical approximation, not a guarantee): at the S&P 500's long-run historical average of 10% per year, $300,000 doubles in approximately 7.2 years. At FXAIX's actual 10-year annualised return of 14.80% (Zacks, December 31, 2025), the Rule of 72 gives a doubling time of approximately 4.86 years. At a conservative 7% projection, it doubles in approximately 10.3 years. These are mathematical projections from a constant assumed return rate. Actual returns are volatile and uneven — in any given year, FXAIX could return +30% or -20%. The compound growth projections assume a constant rate applied smoothly, which does not reflect real market behaviour. Not investment advice. Past performance does not predict future results.
Is FZROX or FXAIX better for a $300,000 investment?
Both are excellent choices for a long-term lump-sum investment. Key differences: FZROX has a 0.00% expense ratio (completely free to own); FXAIX charges 0.015% ($45/year on $300,000). FXAIX tracks the S&P 500 (500 large-cap US companies); FZROX tracks the Fidelity U.S. Total Market Index (all US companies, including mid and small caps). FXAIX has a longer track record (since 2011 vs FZROX's August 2018 inception). From their common comparison period (Aug 2018 to June 2026), FXAIX returned +121.16% vs FZROX +112.95% (TotalRealReturns.com). FZROX cannot be transferred to other brokers; FXAIX can. For most long-term Fidelity investors, either fund is an excellent choice. The fee advantage of FZROX ($45/year on $300,000) is minimal; the portability advantage of FXAIX is more meaningful if there is any chance of switching brokers. Not investment advice.
What is the Rule of 72 and how does it apply to index funds?
The Rule of 72 is a mathematical shortcut: divide 72 by the annual percentage return rate to estimate the number of years required for an investment to double. Examples for $300,000: at 7%/yr, 72/7 = 10.3 years to $600,000; at 10%/yr, 72/10 = 7.2 years; at 14.80% (FXAIX 10-yr actual), 72/14.80 = 4.86 years; at 17% (FXAIX 3-yr actual), 72/17 = 4.24 years. The Rule of 72 is accurate for annual returns between approximately 5% and 20%. The critical caveat: it assumes a constant smooth annual return, which real markets do not deliver. The actual time to double will depend on the sequence of actual annual returns, which may be higher or lower than the assumed rate. Not investment advice.
How much will $300,000 in FXAIX be worth in 10 years?
This depends entirely on future returns, which cannot be predicted. Using historical return rates as a mathematical illustration (NOT a forecast): at 10%/yr (S&P 500 long-run average), $300,000 grows to approximately $778,000 in 10 years. At 14.80%/yr (FXAIX's actual 10-year return to December 2025), approximately $1,156,000. At 7%/yr (conservative estimate), approximately $590,000. These are compound interest calculations (FV = $300,000 × (1+r)^10) and are not forecasts or guarantees. Actual returns will vary significantly based on market conditions during the period. The S&P 500 has had decades that returned well below 7% (2000-2009) and decades that returned well above 14% (2010-2019). Not investment advice. Past performance does not predict future results.
Are there any risks to investing $300,000 in Fidelity index funds?
Yes, significant risks exist. Investment risk: index funds invest in stocks, which can decline substantially in value. The S&P 500 fell approximately 34.92% from peak to trough in the COVID crash of 2020. It fell approximately 37% in 2008. A $300,000 investment at the peak before such a decline would temporarily be worth roughly $198,000. Sequence of returns risk: poor returns in early years can significantly affect long-term outcomes. Concentration risk: Fidelity's FZROX and FNILX use proprietary indices; if Fidelity discontinued these funds or significantly changed their structure, investors would face decisions. Portability risk: FZROX and FNILX cannot be transferred to other brokers. Market risk: the US stock market, which dominates these funds, may underperform global markets for extended periods. Inflation risk: all returns shown are nominal; real (inflation-adjusted) returns are lower. Not investment advice. Always consult a qualified financial adviser.

0 Comments Comments