

Investing
AXA Shares Are Going Cheap — Will You Buy?
AXA’s H1 2026 earnings were outstanding by any measure: underlying EPS up 8%, gross written premiums up 5%, Life & Health earnings up 11%, and a Solvency II ratio of 218%. The stock fell below its 50-day moving average anyway. With a forward P/E below 10x, a dividend yield approaching 6%, 25 of 29 analysts rating the shares a Buy, and a new strategic plan due September 15, the question is simple: has the short-term selloff created a real entry point?
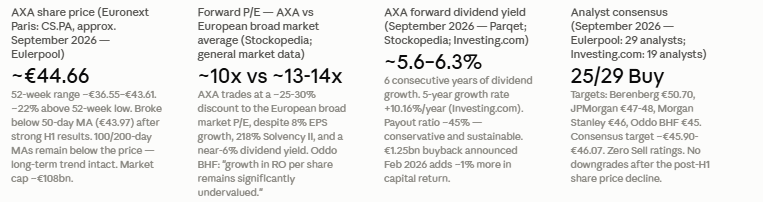
The share price fell below its 50-day moving average of €43.97 in the days following the results, having already broken through the 20- and 38-day lines earlier. As of mid-September 2026, AXA trades at approximately €44.66 on Euronext Paris (ticker: CS), with a market capitalisation of around €108 billion. The 52-week range runs from approximately €36.55 to €43.61, placing the current price slightly above the top of that range but well above the 52-week low by approximately 22% (Eulerpool; Parqet).
The divergence between fundamental strength and short-term price action is the question this guide addresses. Is the pullback a tactical buying opportunity in a structurally sound, undervalued business? Or does the market know something the headline numbers don’t? This analysis covers the results, the valuation, the dividend, the analyst consensus, the upcoming strategic plan, the bull case, and the bear case — and leaves the judgment to you.
AXA CS.PA approximate price: €44.66 (Euronext, September 2026; Eulerpool). 52-week range: €36.55-€43.61. Market cap: ~€108 billion. Forward P/E: ~9.58x (Stockopedia). Dividend yield: ~5.6-6.26% (various sources). Price/Book: ~1.86x. Price/Sales: ~0.95x. H1 2026 underlying EPS: €2.19 (+8%). GWP H1 2026: €66.3bn (+5%). Solvency II: 218%. FY25 GWP: €116bn (+6%). FY25 underlying earnings: €8.4bn (+6%). Analyst consensus: 25/29 Buy. 12-month price target: €45.90-€46.07. Not financial advice.
Following the sale of AXA Investment Managers (AXA IM) to BNP Paribas in July 2025 — a €5.1 billion transaction — AXA’s profile has shifted toward a purer insurance and risk business. AXA IM was a significant contributor to the overall group, which is why many of the 2025 and 2026 comparisons are presented both ‘as reported’ and ‘excluding AXA IM,’ the latter being the more meaningful indicator of the core business’ underlying momentum.
In terms of global scale, AXA’s €116 billion in gross written premiums and other revenues for FY25 places it among the top three or four global insurance groups by revenue. Its core markets are France and Europe (together representing the majority of P&C earnings), with AXA XL providing a significant global commercial lines business and Asia providing long-term growth exposure. The diversity of geography and line of business is one of the group’s structural advantages.
AXA is a constituent of the CAC 40 index in France and the Euro Stoxx 50 across the eurozone, making it widely held by institutional funds tracking either index. Its long-term earnings record shows EPS growth of 3.5% per year over 19 years (Eulerpool) — modest but consistent — alongside revenue growth of 1.7% per year. The current period is producing materially above-average earnings growth, which is one reason analysts are constructive on the shares.
The P&C (Property and Casualty) segment delivered underlying earnings of €3.2 billion, up 6%, reflecting continued pricing power in commercial and retail insurance lines and disciplined underwriting at AXA XL. AXA XL, the global commercial lines and reinsurance unit, grew earnings by 4% — a positive outcome given the catastrophe exposure and rate environment in large commercial lines. Management’s characterisation of AXA XL’s performance as ‘disciplined cycle management through agile redeployment towards the most profitable business lines’ suggests active portfolio management rather than simply following the market.
The Life & Health segment was the standout: underlying earnings of €2.0 billion, up 11%. This reflects two dynamics — strong repricing in health insurance (a segment that has been a source of claims inflation across the industry) and solid growth in the long-term savings business. The 11% growth in L&H earnings is materially above the plan target and suggests that the post-AXA IM portfolio is well-positioned for the current environment.
The Solvency II ratio of 218% is the capital metric that matters most in insurance. It measures the group’s available capital against its Solvency Capital Requirement (SCR) under EU insurance regulation. A ratio above 200% is considered very strong; the European regulatory minimum is 100%; most large insurers target a range of 150-200%. AXA’s 218% — up 3 points from the start of the year — provides comfortable headroom for dividends, buybacks, and M&A without any near-term capital constraint.
Management Quote: Thomas Buberl, Chief Executive Officer of AXA, H1 2026 press release (July 31, 2026): 'AXA delivered outstanding performance in the first half of 2026, with growth in underlying earnings per share at the top end of our target range of 6% to 8% while further strengthening our reserve prudence. These results confirm AXA’s positioning as an all-weather company able to navigate changing market conditions.' (Source: AXA official H1 2026 press release, axa.com, July 31, 2026.)
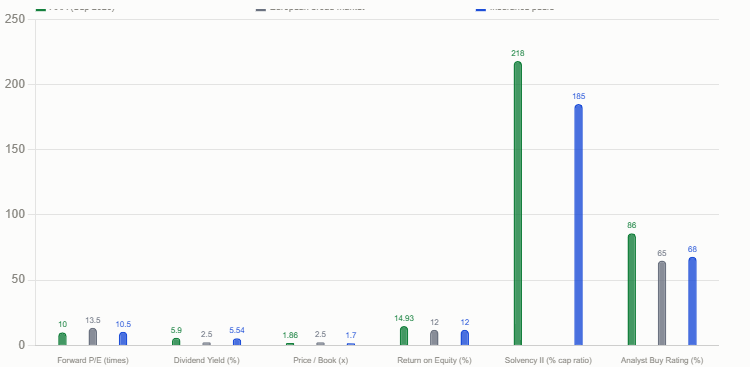
On a forward P/E basis, AXA trades at approximately 9.58x forward earnings (Stockopedia). At a current price of approximately €44.66 and full-year consensus EPS of approximately €4.35-€4.40, the forward multiple is around 10x — consistent across multiple sources (Investing.com peers comparison shows a P/E of approximately 11.8x on a trailing basis; the forward multiple is lower). For context, the broader European equity market (Euro Stoxx 600) trades at approximately 13-14x forward earnings. European insurance peers trade at a similar or modestly higher P/E to AXA. A 10x forward multiple for a business growing EPS at 6-8% per year with a 218% Solvency II ratio and a near-6% dividend yield is a meaningful discount.
The Price/Book ratio of approximately 1.86x (Stockopedia) is modest for a group of AXA’s quality and scale. Return on Equity of approximately 14.93% (Stockopedia) against a P/B of 1.86x implies a price-to-return-on-equity relationship that compares favourably against both the sector and the broader market. A company earning 15% ROE but trading at 1.86x book is priced as if that ROE is unsustainable or is about to fall. The H1 2026 results suggest otherwise.
The Price/Sales ratio of 0.95x (Stockopedia) — below 1.0x, meaning you are buying €1 of revenue for less than €1 of market value — is another indicator of value. This metric is less common in insurance analysis (where combined ratios and technical earnings are more relevant), but it illustrates that the market is not paying a premium for AXA’s revenue base.
Oddo BHF’s analyst note on AXA (published ahead of the FY25 results) articulated the valuation case directly: ‘Our price target incorporates a prudent cost of capital and corresponds to a 2027 PE of only 10.1 times. The potential for growth in RO per share and the high level of capital return to shareholders remain significantly undervalued by the market.’
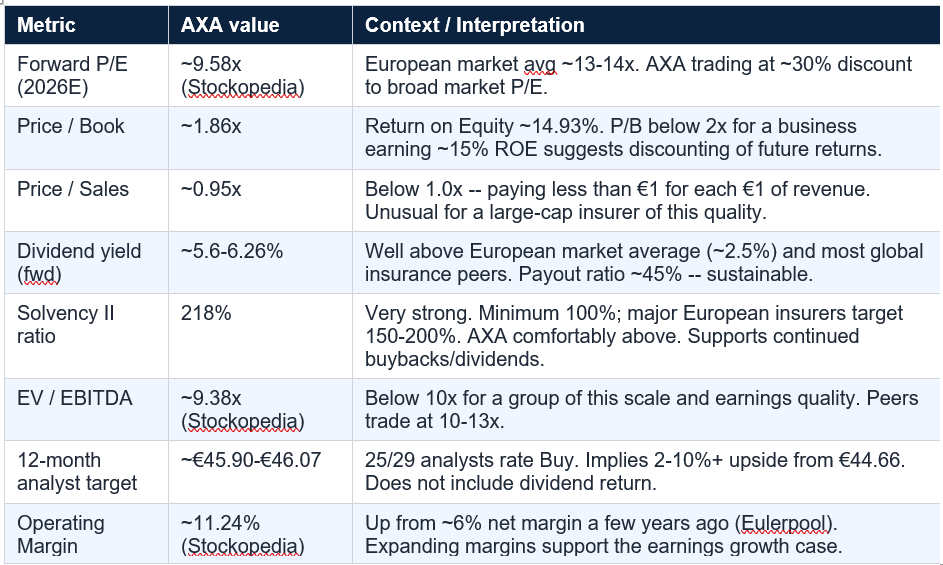
The dividend per share for FY25, paid in 2026, was €2.32 per share — confirmed in AXA’s Q1 2026 activity indicators press release. AXA has raised its dividend for six consecutive years (Investing.com ProTips). The 5-year dividend growth rate is 10.16% per year (Investing.com), and Eulerpool calculates the 19-year dividend growth rate at 4.8% per year. This is a company with a long and rising dividend history, not a one-time high yield.
The payout ratio of approximately 45% of earnings (Eulerpool) is conservative by European insurance standards. With underlying earnings expected to grow at the top end of 6-8% for FY26, and with consensus EPS growth of approximately 22.89% expected for 2027 (MarketBeat), the dividend coverage is improving year on year. Oddo BHF expected a 2025 dividend of €2.29 per share in their forward estimates (the actual FY25 dividend of €2.32 slightly exceeded this), alongside a €1.25 billion share buyback.
The €1.25 billion share buyback announced with the FY25 results on February 26, 2026, adds to the total shareholder return picture. Combined with the ~5.6% dividend yield, the total capital return to shareholders is materially higher than the headline dividend yield suggests. Share buybacks reduce the share count, mechanically increasing EPS even before organic earnings growth, and at a P/E of approximately 10x, buying back shares represents highly accretive capital deployment.
The Bull Case: The dividend case: AXA's ~5.6-6.26% forward yield is among the highest of any major European large-cap with a 6-year consecutive growth record. The 45% payout ratio against a 6-8% EPS growth trajectory provides compound dividend growth at relatively low risk. The €1.25 billion buyback (announced Feb 2026) adds approximately 1% of market cap in additional shareholder returns. Combined total capital return: approximately 6.5-7.5%+ per year before any share price appreciation. Not financial advice.
Eulerpool data shows that of 29 analysts covering AXA, 25 rate the stock a Buy, with a consensus 12-month price target of €45.90 — approximately 2.8% above the €44.66 price at the time of writing, before accounting for the dividend yield (which adds approximately 5.6-6.26% to the total return calculation). Investing.com’s data from 19 analysts shows 15 Buy / 4 Hold / 0 Sell, with an average target of €46.07 (+10.22% upside from their reference price).
The specific analyst targets provide a sense of where the buy case is pitched. JPMorgan maintains a Buy with a target of €47-48 (updated April 2026). Berenberg carries a Buy with a target of €50.70 (updated March 2026) — the highest target in the sample and implies more than 13% upside from the €44.66 price. Morgan Stanley rates the stock Buy with a target of €46 (updated March 2026). Oddo BHF reiterates Outperform with a target raised to €45, noting that ‘potential for growth in RO per share and the high level of capital return to shareholders remain significantly undervalued.’
No analyst in the available sample rates AXA a Sell. This is notable in a market where sell ratings are already relatively rare but particularly meaningful when the stock has recently pulled back on strong results. The pullback has not prompted any analyst to downgrade.
The 25/29 Buy consensus with zero Sell ratings is a strong signal, but requires one calibration: analysts covering large-cap stocks are structurally incentivised toward positive recommendations, and consensus buy ratings are common in this space. The more informative signal is the combination: strong fundamental results, falling short-term price, zero downgrades in response, and a new catalyst (the September 15 strategic plan) that has not yet been priced in. Not financial advice.
Strategic plan announcements from major European insurers are typically significant events for share price direction. They set new medium-term earnings growth targets, capital allocation frameworks, dividend policy guidance, and geographic and product strategy priorities. For AXA specifically, the key questions the September 15 presentation will need to address include: what EPS growth target will replace the current 6-8% range; how will the €5+ billion in capital from the AXA IM disposal be redeployed; what is the target capital return policy (dividend growth rate and buyback programme) for 2027-2029; and what organic and inorganic growth opportunities are prioritised for Asia, the commercial lines business, and the health insurance segment.
The stock’s current valuation — at a P/E of approximately 10x and a yield approaching 6% — arguably prices in limited premium for the strategic plan. A plan that sets a new EPS growth target of 6-9% or higher, commits to continued dividend growth of 6-8% per year, and announces a new buyback programme for 2027-2029 would be likely to be received positively by the market, particularly if combined with credible guidance on the use of the AXA IM disposal proceeds. Conversely, a plan that disappoints on ambition or reveals capital constraints would likely reinforce the current modest valuation.
The September 15 date means that this guide is being written before the strategic plan has been presented. This is important context: the analysis in this guide does not incorporate the content of the 2027-2029 plan. Any investment decision informed partly by this article should account for the additional information that the September 15 presentation will provide.
Following the July 31 H1 results, AXA shares broke below the 50-day moving average (€43.97) after having already broken through the shorter-term 20- and 38-day moving averages. The analyst commentary captured in the Parqet news feed (citing deraktionaer.de) was direct: ‘the short-term chart picture looks negative. Fundamentally the insurer shows strength. Investors should be cautious — a sale is not necessarily warranted; the dividend yield is 5.6% and the 100-/200-day lines still remain below the price.’
The 100-day and 200-day moving averages remaining below the current price is technically significant. These longer-term trend lines are below €44.66, meaning the stock remains in a long-term uptrend even as the shorter-term lines have been broken. The short-term negative chart pattern — the broken 20-, 38-, and 50-day lines — is a concern for short-term traders. For longer-term investors, the preservation of the long-term trend and the presence of the dividend yield as a floor on total return provides a different framing.
One additional context: the wildfires in France during the summer of 2026. AXA management confirmed in post-results commentary that the wildfires were not seen as a threat to the full-year outlook. The group maintained its guidance that full-year 2026 EPS growth would come in at the upper end of the 6-8% plan target range (Parqet; Finanzen.net). Natural catastrophe events are a routine part of the insurance business, and AXA’s Solvency II ratio of 218% provides substantial buffer against any elevated claims in a single period.
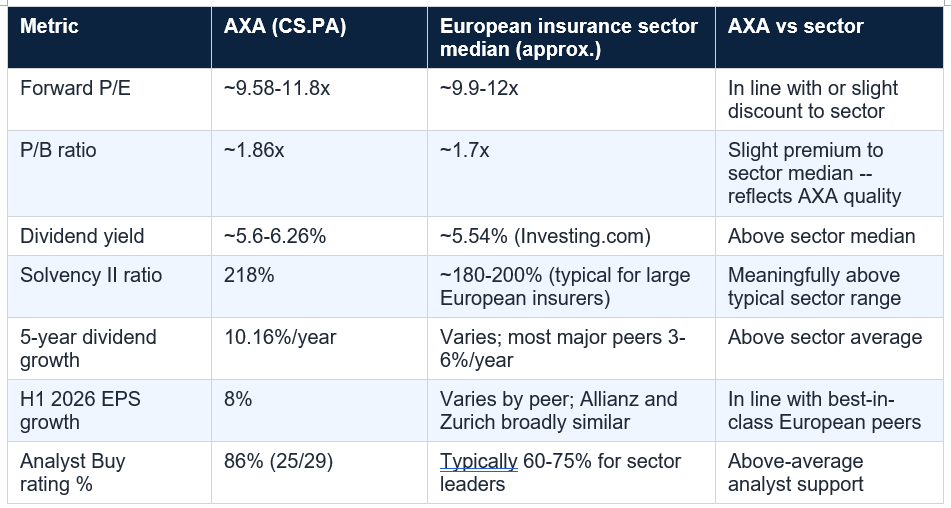
Note: peer data is approximate and sourced from general market data. Peer comparison should not be relied upon for investment decisions. Not financial advice.
The fundamental picture is clear. H1 2026 delivered EPS growth of 8% at the top of the plan range. The Solvency II ratio of 218% is among the strongest in the European insurance sector. The dividend yield of approximately 5.6-6.26% is covered more than twice by earnings, has grown at 10.16% per year over five years, and is supported by a parallel buyback programme. The analyst consensus of 25 out of 29 on Buy with a price target of €45.90-€46.07 implies total returns of approximately 7-16% over 12 months before dividend compounding.
The technical picture is less comfortable. The broken 20-, 38-, and 50-day moving averages signal short-term selling pressure. Momentum strategies will be reducing exposure. And the September 15 strategic plan presents genuine binary risk: a strong plan could re-rate the stock materially; a plan that disappoints could extend the current weakness.
The answer to the question in this article’s title — ‘will you buy?’ — depends on your investment horizon, risk tolerance, and the outcome of the September 15 presentation. For long-term investors comfortable with European insurance exposure, the valuation, dividend, and earnings trajectory present a coherent case. For shorter-term investors or those sensitive to technical momentum, waiting for the September 15 catalyst to pass and a new technical base to establish may be the more prudent approach. Not financial advice — always conduct your own research or consult a qualified independent financial adviser.
This article does not constitute financial advice and cannot determine whether AXA is a good investment for any individual. The objective analysis in this guide shows: AXA's H1 2026 results delivered underlying EPS growth of 8% at the top of its 6-8% plan target range, with gross written premiums of €66.3 billion (+5%), Life & Health earnings up 11%, and a Solvency II ratio of 218%. The forward P/E of approximately 9.58-10x is below the European market average of approximately 13-14x and below the level at which most analysts consider a business of this quality to be fairly valued. The forward dividend yield of approximately 5.6-6.26% is among the highest available from a CAC 40 constituent with a 6-year consecutive growth record. 25 of 29 analysts covering AXA rate it a Buy with price targets of €45.90-€50.70. The new 2027-2029 strategic plan, due September 15, 2026, is an important catalyst that this analysis does not incorporate. As with all equity investments, the price may go down as well as up. Consult a qualified independent financial adviser for guidance specific to your circumstances. Sources: AXA H1 2026 press release; Eulerpool; Stockopedia; Investing.com; Oddo BHF analyst note.
What is AXA's dividend yield?
AXA's forward dividend yield is approximately 5.6% to 6.26% as of September 2026, depending on the source and the precise current share price used. The dividend per share for FY25, paid in 2026, was €2.32 per share. AXA has raised its dividend for six consecutive years (Investing.com). The 5-year dividend growth rate is 10.16% per year (Investing.com). The payout ratio is approximately 45% of earnings (Eulerpool), which is conservative and leaves ample room for continued dividend growth. The €1.25 billion share buyback announced with the FY25 results on February 26, 2026 adds to the total shareholder return. The dividend is paid annually, typically in the spring following the financial year end. For current dividend information, always check AXA's investor relations page at axa.com. Not financial advice.
What are analysts' price targets for AXA in 2026?
The consensus 12-month price target for AXA is approximately €45.90 (Eulerpool, 29 analysts) to €46.07 (Investing.com, 19 analysts). Specific firm targets: Berenberg has the highest target at €50.70 (Buy, March 2026). JPMorgan rates the stock Buy with a target of €47-48 (April 2026). Morgan Stanley rates Buy with a target of €46 (March 2026). Oddo BHF rates Outperform with a target of €45 (year-end 2026 target). Of 29 analysts tracked by Eulerpool, 25 rate AXA a Buy and none rate it a Sell. Of 19 analysts tracked by Investing.com, 15 rate it Buy, 4 Hold, 0 Sell. Analyst targets should not be relied upon as investment advice. Targets are based on each firm's modelling assumptions and may not be updated following significant market or company events. Not financial advice.
What happened to AXA's shares after its H1 2026 results?
AXA reported H1 2026 results on July 31, 2026 that were strong by most measures: underlying EPS of €2.19 (+8%), gross written premiums of €66.3 billion (+5%), Life & Health underlying earnings of €2.0 billion (+11%), and a Solvency II ratio of 218%. Despite these results, AXA shares fell below the 50-day moving average (€43.97) in the days following the results, having previously broken through the shorter-term 20- and 38-day moving averages. This type of post-results decline on strong numbers can occur when the positive news was already reflected in the share price before the announcement (a 'sell the news' dynamic), or when investors use the liquidity around results to reduce positions for unrelated reasons. Analyst commentary (deraktionaer.de via Parqet) noted that while the short-term chart picture was negative, the Solvency II ratio and dividend yield remained support factors, and the 100- and 200-day moving averages still remained below the price, keeping the longer-term trend intact. Not financial advice.
What is AXA's new strategic plan for 2027-2029?
As of September 2026 (the date of this article's publication), AXA has not yet presented its 2027-2029 strategic plan. The H1 2026 press release (July 31, 2026) confirmed that the new plan will be presented on September 15, 2026, with business CEO roundtable sessions on September 21. The current strategic plan is called 'Unlock the Future' and covers 2024-2026, with an EPS growth target of 6-8% per year. The key items that the new plan is expected to address include: the new medium-term EPS growth target; deployment of capital from the AXA IM disposal to BNP Paribas (completed July 2025); dividend policy and buyback programme for 2027-2029; and growth priorities across P&C, Life & Health, AXA XL, and Asian markets. The September 15 presentation is a key catalyst for the share price direction. Any investment decision informed by this article should account for the additional information the strategic plan will provide. Always check axa.com for official announcements. Not financial advice.
Table of Contents
- The Setup: Strong Results, Falling Share Price
- What AXA Is and Why It Matters
- H1 2026 Results: Dissecting the Numbers
- The Valuation Case: Is AXA Actually Cheap?
- The Dividend: 6% Yield, 6 Consecutive Years of Growth
- The Analyst Consensus: 25 of 29 Say Buy
- The September 15 Catalyst: New Strategic Plan
- What Happened to the Share Price After H1 Results?
- The Bull Case for AXA
- The Bear Case: Reasons to Be Cautious
- AXA vs European Insurance Peers
- Key Risks
- Conclusion: Cheap for a Reason, or Cheaply Valued?
- Frequently Asked Questions
Valuation — AXA vs market and peers
H1 2026 earnings — performance breakdown
Bull vs bear — the case for and against
The Setup: Strong Results, Falling Share Price
There is a specific kind of investor frustration that arises when a company reports outstanding results and the share price falls anyway. AXA investors experienced this on 31 July 2026. The French insurance giant published H1 2026 earnings that beat expectations on almost every metric: underlying earnings per share up 8%, at the top end of the 6-8% plan target range; gross written premiums up 5% to €66.3 billion; Life & Health earnings up 11%; and a Solvency II capital ratio of 218% — one of the strongest in the European insurance sector. Thomas Buberl, AXA’s Chief Executive, called it ‘outstanding performance.’The share price fell below its 50-day moving average of €43.97 in the days following the results, having already broken through the 20- and 38-day lines earlier. As of mid-September 2026, AXA trades at approximately €44.66 on Euronext Paris (ticker: CS), with a market capitalisation of around €108 billion. The 52-week range runs from approximately €36.55 to €43.61, placing the current price slightly above the top of that range but well above the 52-week low by approximately 22% (Eulerpool; Parqet).
The divergence between fundamental strength and short-term price action is the question this guide addresses. Is the pullback a tactical buying opportunity in a structurally sound, undervalued business? Or does the market know something the headline numbers don’t? This analysis covers the results, the valuation, the dividend, the analyst consensus, the upcoming strategic plan, the bull case, and the bear case — and leaves the judgment to you.
AXA CS.PA approximate price: €44.66 (Euronext, September 2026; Eulerpool). 52-week range: €36.55-€43.61. Market cap: ~€108 billion. Forward P/E: ~9.58x (Stockopedia). Dividend yield: ~5.6-6.26% (various sources). Price/Book: ~1.86x. Price/Sales: ~0.95x. H1 2026 underlying EPS: €2.19 (+8%). GWP H1 2026: €66.3bn (+5%). Solvency II: 218%. FY25 GWP: €116bn (+6%). FY25 underlying earnings: €8.4bn (+6%). Analyst consensus: 25/29 Buy. 12-month price target: €45.90-€46.07. Not financial advice.
What AXA Is and Why It Matters
AXA SA (Euronext: CS; OTC ADR: AXAHY) is one of the world’s largest insurance and financial services groups, headquartered in Paris. The group operates across six reporting segments: France, Europe, AXA XL (commercial and specialty lines globally), Asia/Africa/EME-LATAM, AXA Investment Managers, and Transversal & Other. It provides property and casualty (P&C) insurance, life insurance, health insurance, and protection products to individuals and corporations in approximately 50 countries.Following the sale of AXA Investment Managers (AXA IM) to BNP Paribas in July 2025 — a €5.1 billion transaction — AXA’s profile has shifted toward a purer insurance and risk business. AXA IM was a significant contributor to the overall group, which is why many of the 2025 and 2026 comparisons are presented both ‘as reported’ and ‘excluding AXA IM,’ the latter being the more meaningful indicator of the core business’ underlying momentum.
In terms of global scale, AXA’s €116 billion in gross written premiums and other revenues for FY25 places it among the top three or four global insurance groups by revenue. Its core markets are France and Europe (together representing the majority of P&C earnings), with AXA XL providing a significant global commercial lines business and Asia providing long-term growth exposure. The diversity of geography and line of business is one of the group’s structural advantages.
AXA is a constituent of the CAC 40 index in France and the Euro Stoxx 50 across the eurozone, making it widely held by institutional funds tracking either index. Its long-term earnings record shows EPS growth of 3.5% per year over 19 years (Eulerpool) — modest but consistent — alongside revenue growth of 1.7% per year. The current period is producing materially above-average earnings growth, which is one reason analysts are constructive on the shares.
H1 2026 Results: Dissecting the Numbers
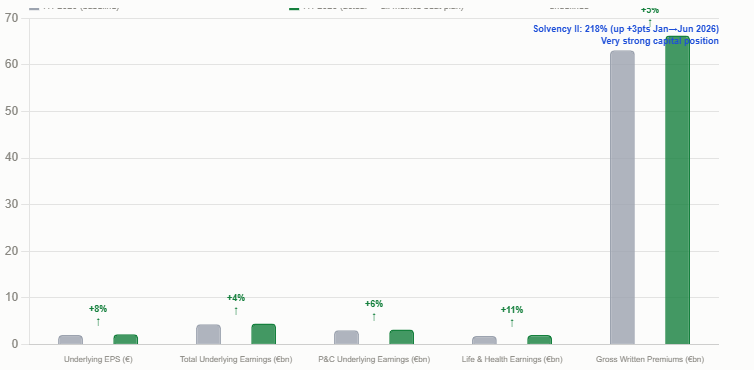
The H1 2026 results, published on 31 July 2026 via AXA’s official press release, were comprehensive in their strength across the core business. Underlying EPS reached €2.19, up 8% versus H1 2025 — the top end of the 6-8% target range under the current ‘Unlock the Future’ strategic plan. With EPS at €2.19 for the first half, the full-year consensus of approximately €4.35-€4.40 in EPS appears achievable, particularly given management’s explicit guidance that the full year is expected to come in at the upper end of the plan range.The P&C (Property and Casualty) segment delivered underlying earnings of €3.2 billion, up 6%, reflecting continued pricing power in commercial and retail insurance lines and disciplined underwriting at AXA XL. AXA XL, the global commercial lines and reinsurance unit, grew earnings by 4% — a positive outcome given the catastrophe exposure and rate environment in large commercial lines. Management’s characterisation of AXA XL’s performance as ‘disciplined cycle management through agile redeployment towards the most profitable business lines’ suggests active portfolio management rather than simply following the market.
The Life & Health segment was the standout: underlying earnings of €2.0 billion, up 11%. This reflects two dynamics — strong repricing in health insurance (a segment that has been a source of claims inflation across the industry) and solid growth in the long-term savings business. The 11% growth in L&H earnings is materially above the plan target and suggests that the post-AXA IM portfolio is well-positioned for the current environment.
The Solvency II ratio of 218% is the capital metric that matters most in insurance. It measures the group’s available capital against its Solvency Capital Requirement (SCR) under EU insurance regulation. A ratio above 200% is considered very strong; the European regulatory minimum is 100%; most large insurers target a range of 150-200%. AXA’s 218% — up 3 points from the start of the year — provides comfortable headroom for dividends, buybacks, and M&A without any near-term capital constraint.
Management Quote: Thomas Buberl, Chief Executive Officer of AXA, H1 2026 press release (July 31, 2026): 'AXA delivered outstanding performance in the first half of 2026, with growth in underlying earnings per share at the top end of our target range of 6% to 8% while further strengthening our reserve prudence. These results confirm AXA’s positioning as an all-weather company able to navigate changing market conditions.' (Source: AXA official H1 2026 press release, axa.com, July 31, 2026.)
The Valuation Case: Is AXA Actually Cheap?
The word ‘cheap’ in investing requires a reference point. Cheap relative to what? Cheap relative to intrinsic value? Cheap relative to peers? Cheap relative to history? The answer in AXA’s case is ‘yes’ on several of these dimensions, which is why 25 of 29 covering analysts maintain buy ratings.On a forward P/E basis, AXA trades at approximately 9.58x forward earnings (Stockopedia). At a current price of approximately €44.66 and full-year consensus EPS of approximately €4.35-€4.40, the forward multiple is around 10x — consistent across multiple sources (Investing.com peers comparison shows a P/E of approximately 11.8x on a trailing basis; the forward multiple is lower). For context, the broader European equity market (Euro Stoxx 600) trades at approximately 13-14x forward earnings. European insurance peers trade at a similar or modestly higher P/E to AXA. A 10x forward multiple for a business growing EPS at 6-8% per year with a 218% Solvency II ratio and a near-6% dividend yield is a meaningful discount.
The Price/Book ratio of approximately 1.86x (Stockopedia) is modest for a group of AXA’s quality and scale. Return on Equity of approximately 14.93% (Stockopedia) against a P/B of 1.86x implies a price-to-return-on-equity relationship that compares favourably against both the sector and the broader market. A company earning 15% ROE but trading at 1.86x book is priced as if that ROE is unsustainable or is about to fall. The H1 2026 results suggest otherwise.
The Price/Sales ratio of 0.95x (Stockopedia) — below 1.0x, meaning you are buying €1 of revenue for less than €1 of market value — is another indicator of value. This metric is less common in insurance analysis (where combined ratios and technical earnings are more relevant), but it illustrates that the market is not paying a premium for AXA’s revenue base.
Oddo BHF’s analyst note on AXA (published ahead of the FY25 results) articulated the valuation case directly: ‘Our price target incorporates a prudent cost of capital and corresponds to a 2027 PE of only 10.1 times. The potential for growth in RO per share and the high level of capital return to shareholders remain significantly undervalued by the market.’
The Dividend: 6% Yield, 6 Consecutive Years of Growth
AXA’s dividend is arguably the most compelling feature of its investment case for income-oriented investors. The forward dividend yield of approximately 5.6-6.26% (depending on the source and the exact current price used) is substantially above the European insurance sector median of approximately 5.54% (Investing.com data) and well above the broader market. It is one of the highest yields available from a CAC 40 constituent without a meaningful payout sustainability concern.The dividend per share for FY25, paid in 2026, was €2.32 per share — confirmed in AXA’s Q1 2026 activity indicators press release. AXA has raised its dividend for six consecutive years (Investing.com ProTips). The 5-year dividend growth rate is 10.16% per year (Investing.com), and Eulerpool calculates the 19-year dividend growth rate at 4.8% per year. This is a company with a long and rising dividend history, not a one-time high yield.
The payout ratio of approximately 45% of earnings (Eulerpool) is conservative by European insurance standards. With underlying earnings expected to grow at the top end of 6-8% for FY26, and with consensus EPS growth of approximately 22.89% expected for 2027 (MarketBeat), the dividend coverage is improving year on year. Oddo BHF expected a 2025 dividend of €2.29 per share in their forward estimates (the actual FY25 dividend of €2.32 slightly exceeded this), alongside a €1.25 billion share buyback.
The €1.25 billion share buyback announced with the FY25 results on February 26, 2026, adds to the total shareholder return picture. Combined with the ~5.6% dividend yield, the total capital return to shareholders is materially higher than the headline dividend yield suggests. Share buybacks reduce the share count, mechanically increasing EPS even before organic earnings growth, and at a P/E of approximately 10x, buying back shares represents highly accretive capital deployment.
The Bull Case: The dividend case: AXA's ~5.6-6.26% forward yield is among the highest of any major European large-cap with a 6-year consecutive growth record. The 45% payout ratio against a 6-8% EPS growth trajectory provides compound dividend growth at relatively low risk. The €1.25 billion buyback (announced Feb 2026) adds approximately 1% of market cap in additional shareholder returns. Combined total capital return: approximately 6.5-7.5%+ per year before any share price appreciation. Not financial advice.
The Analyst Consensus: 25 of 29 Say Buy
Analyst consensus is not a substitute for independent research, but it provides a useful temperature check on how professional investors assess the balance of risks and opportunities in a name. For AXA, that consensus is unusually strong.Eulerpool data shows that of 29 analysts covering AXA, 25 rate the stock a Buy, with a consensus 12-month price target of €45.90 — approximately 2.8% above the €44.66 price at the time of writing, before accounting for the dividend yield (which adds approximately 5.6-6.26% to the total return calculation). Investing.com’s data from 19 analysts shows 15 Buy / 4 Hold / 0 Sell, with an average target of €46.07 (+10.22% upside from their reference price).
The specific analyst targets provide a sense of where the buy case is pitched. JPMorgan maintains a Buy with a target of €47-48 (updated April 2026). Berenberg carries a Buy with a target of €50.70 (updated March 2026) — the highest target in the sample and implies more than 13% upside from the €44.66 price. Morgan Stanley rates the stock Buy with a target of €46 (updated March 2026). Oddo BHF reiterates Outperform with a target raised to €45, noting that ‘potential for growth in RO per share and the high level of capital return to shareholders remain significantly undervalued.’
No analyst in the available sample rates AXA a Sell. This is notable in a market where sell ratings are already relatively rare but particularly meaningful when the stock has recently pulled back on strong results. The pullback has not prompted any analyst to downgrade.
The 25/29 Buy consensus with zero Sell ratings is a strong signal, but requires one calibration: analysts covering large-cap stocks are structurally incentivised toward positive recommendations, and consensus buy ratings are common in this space. The more informative signal is the combination: strong fundamental results, falling short-term price, zero downgrades in response, and a new catalyst (the September 15 strategic plan) that has not yet been priced in. Not financial advice.
The September 15 Catalyst: New Strategic Plan
One of the most specific near-term catalysts for AXA shares is the scheduled presentation of the group’s new strategic plan for 2027-2029 on September 15, 2026, with business CEO roundtables on September 21 (AXA H1 2026 press release). This is the successor to the current ‘Unlock the Future’ plan, which runs through 2026.Strategic plan announcements from major European insurers are typically significant events for share price direction. They set new medium-term earnings growth targets, capital allocation frameworks, dividend policy guidance, and geographic and product strategy priorities. For AXA specifically, the key questions the September 15 presentation will need to address include: what EPS growth target will replace the current 6-8% range; how will the €5+ billion in capital from the AXA IM disposal be redeployed; what is the target capital return policy (dividend growth rate and buyback programme) for 2027-2029; and what organic and inorganic growth opportunities are prioritised for Asia, the commercial lines business, and the health insurance segment.
The stock’s current valuation — at a P/E of approximately 10x and a yield approaching 6% — arguably prices in limited premium for the strategic plan. A plan that sets a new EPS growth target of 6-9% or higher, commits to continued dividend growth of 6-8% per year, and announces a new buyback programme for 2027-2029 would be likely to be received positively by the market, particularly if combined with credible guidance on the use of the AXA IM disposal proceeds. Conversely, a plan that disappoints on ambition or reveals capital constraints would likely reinforce the current modest valuation.
The September 15 date means that this guide is being written before the strategic plan has been presented. This is important context: the analysis in this guide does not incorporate the content of the 2027-2029 plan. Any investment decision informed partly by this article should account for the additional information that the September 15 presentation will provide.
What Happened to the Share Price After H1 Results?
The technical picture following the H1 2026 results illustrates a pattern that occurs with some frequency in large-cap stocks after strong quarterly or half-year earnings: the results are in line with or above expectations, they confirm the underlying investment thesis, and then the stock sells off because ‘the news was already priced in.’Following the July 31 H1 results, AXA shares broke below the 50-day moving average (€43.97) after having already broken through the shorter-term 20- and 38-day moving averages. The analyst commentary captured in the Parqet news feed (citing deraktionaer.de) was direct: ‘the short-term chart picture looks negative. Fundamentally the insurer shows strength. Investors should be cautious — a sale is not necessarily warranted; the dividend yield is 5.6% and the 100-/200-day lines still remain below the price.’
The 100-day and 200-day moving averages remaining below the current price is technically significant. These longer-term trend lines are below €44.66, meaning the stock remains in a long-term uptrend even as the shorter-term lines have been broken. The short-term negative chart pattern — the broken 20-, 38-, and 50-day lines — is a concern for short-term traders. For longer-term investors, the preservation of the long-term trend and the presence of the dividend yield as a floor on total return provides a different framing.
One additional context: the wildfires in France during the summer of 2026. AXA management confirmed in post-results commentary that the wildfires were not seen as a threat to the full-year outlook. The group maintained its guidance that full-year 2026 EPS growth would come in at the upper end of the 6-8% plan target range (Parqet; Finanzen.net). Natural catastrophe events are a routine part of the insurance business, and AXA’s Solvency II ratio of 218% provides substantial buffer against any elevated claims in a single period.
The Bull Case for AXA
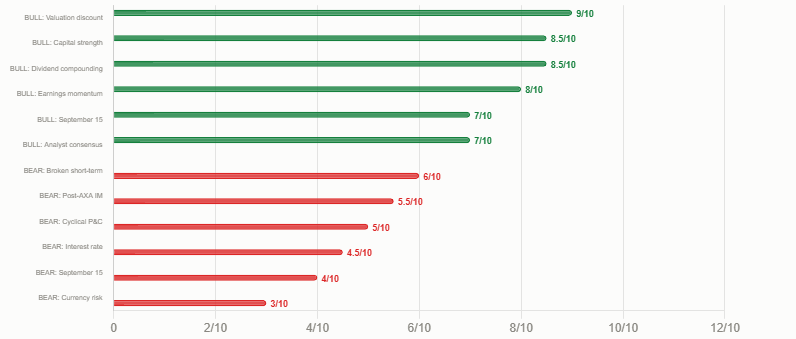
The bull case for AXA has several distinct components that reinforce each other.- Valuation discount: A forward P/E of approximately 10x against a 6-8% EPS growth trajectory and a near-6% dividend yield is below the level at which the market would typically price a business of this quality. The Oddo BHF target of €45 uses a 2027 PE of only 10.1x as the fair value anchor. If the market re-rates AXA from 10x to 12x forward earnings — still well below the broad market average of 13-14x — the share price impact at constant earnings would be approximately 20% upside, plus the dividend return. Not financial advice.
- Earnings momentum: H1 2026 EPS growth of 8% at the top of the plan range, with Life & Health growing at 11% and P&C growing at 6%. The full-year consensus projects continued growth. Analyst consensus (MarketBeat) projects approximately 22.89% EPS growth for 2027, which if achieved would drive a meaningful re-rating even at the current P/E multiple.
- Capital strength: 218% Solvency II provides capacity for continued buybacks, dividend growth, and selective M&A without approaching capital constraints. The €5+ billion from the AXA IM disposal to BNP Paribas in July 2025 provides additional firepower for the 2027-2029 strategic plan period. Deployment of this capital at attractive returns would be directly accretive to EPS.
- Dividend compounding: A near-6% yield with a 10.16% 5-year dividend growth rate and a 45% payout ratio creates a powerful compounding income stream. A €10,000 investment at current levels would generate approximately €560-€620 in dividend income in year one, with that income growing at 6-8% annually if the earnings trajectory is maintained.
- The September 15 catalyst: the new 2027-2029 strategic plan is a near-term catalyst that the current price does not appear to fully reflect. If the plan is received positively, the combination of multiple re-rating and higher EPS targets could compress the P/E discount rapidly.
- Insurance industry tailwinds: insurance pricing has been firm globally as reinsurers and primary insurers rebuild margins after a period of elevated claims inflation. AXA’s combined ratio improvement in P&C, the 11% growth in L&H, and the Solvency II trajectory all reflect these tailwinds rather than anticipating them.
The Bear Case: Reasons to Be Cautious
A fair analysis of AXA requires engaging seriously with the reasons the stock might not perform as well as the bull case suggests.- Short-term chart deterioration: breaking below the 50-day moving average after a result that beat expectations is a red flag for momentum investors and risk managers. Institutional funds that use technical screens may reduce positions based on the chart alone, creating further selling pressure regardless of the fundamental picture. The broken short-term trend lines could attract further selling before a new base is established.
- Cyclical sensitivity in P&C: property and casualty insurance is partially cyclical. A sustained softening of pricing in commercial lines (as has occurred in past cycles), an unusual catastrophe year above the modelled 4.5-point nat cat load, or a combination of both could compress P&C earnings in a way the current trajectory does not reflect. AXA XL’s exposure to large commercial lines and specialty risks is not trivial.
- Macroeconomic sensitivity: AXA’s life and savings businesses and investment income are sensitive to interest rate movements. A sharp fall in European rates (for example, a rapid ECB rate-cutting cycle) could compress investment margins, reduce new business profitability in long-term savings, and reduce the discount rate that determines the present value of long-tail liabilities.
- AXA IM transition: the disposal of AXA IM to BNP Paribas in July 2025 removed a fee-income business that provided diversification and relatively stable earnings. The remaining business is more concentrated in pure insurance risk. Investors who valued the asset management earnings diversity may have reduced their holdings, contributing to the modest re-rating since the disposal.
- Currency risk for non-euro investors: AXA reports in euros and its primary listing is on Euronext Paris. For sterling, dollar, or yen-based investors, the currency dynamics between their home currency and the euro add an additional return variable that can work either way.
- The wildfires in France: while management does not see the 2026 wildfires as threatening the full-year outlook, major natural catastrophe events in France (AXA’s largest market) have the potential to surprise on the upside of claims in any given year. The current guidance assumes no significant deterioration in operating conditions.
AXA vs European Insurance Peers
Context matters in investment analysis. AXA does not exist in isolation; it competes for investor capital with other European insurance groups, and its valuation should be assessed relative to peers as well as absolute benchmarks.Note: peer data is approximate and sourced from general market data. Peer comparison should not be relied upon for investment decisions. Not financial advice.
Key Risks
Any investment in equities carries risk. For AXA specifically, the key risks to monitor include:- Natural catastrophe year: the 2026 guidance assumes a normalised nat cat load of approximately 4.5 points. A year with significantly higher-than-expected catastrophe losses (storms, floods, wildfires beyond current levels) would reduce P&C earnings and potentially the dividend coverage ratio.
- Interest rate environment: a rapid fall in European rates faster than currently expected by the market could reduce the investment income earned on AXA’s substantial fixed-income portfolio, compressing margins in the L&H segment.
- Regulatory change: European insurance regulation under Solvency II is reviewed periodically. Changes to capital requirements, particularly any tightening of the internal model approach that AXA uses, could require additional capital and reduce the buffer currently at 218%.
- AXA IM re-integration risk: the sale of AXA IM was strategic, but BNP Paribas and AXA will have ongoing commercial relationships in product distribution. Any deterioration of this relationship could affect the L&H segment’s ability to distribute savings and investment products in France and Europe.
- Equity market exposure: AXA’s balance sheet retains equity exposure through its long-term savings and unit-linked products. A significant equity market decline would reduce assets under management, the value of unit-linked liabilities, and potentially the Solvency II ratio.
- Execution risk on 2027-2029 strategic plan: the September 15 presentation is a key event. If the plan sets targets that are perceived as too modest or if the capital allocation strategy from the AXA IM proceeds disappoints, the stock could re-rate downward despite the strong current valuation.
Conclusion
The investment case for AXA in September 2026 sits in a specific and not uncommon zone: a high-quality business with demonstrably strong recent results, a compelling valuation on virtually every conventional metric, near-universal analyst buy coverage, and a near-term catalyst in the form of the September 15 strategic plan — trading below its short-term technical trend lines after a results-day selloff.The fundamental picture is clear. H1 2026 delivered EPS growth of 8% at the top of the plan range. The Solvency II ratio of 218% is among the strongest in the European insurance sector. The dividend yield of approximately 5.6-6.26% is covered more than twice by earnings, has grown at 10.16% per year over five years, and is supported by a parallel buyback programme. The analyst consensus of 25 out of 29 on Buy with a price target of €45.90-€46.07 implies total returns of approximately 7-16% over 12 months before dividend compounding.
The technical picture is less comfortable. The broken 20-, 38-, and 50-day moving averages signal short-term selling pressure. Momentum strategies will be reducing exposure. And the September 15 strategic plan presents genuine binary risk: a strong plan could re-rate the stock materially; a plan that disappoints could extend the current weakness.
The answer to the question in this article’s title — ‘will you buy?’ — depends on your investment horizon, risk tolerance, and the outcome of the September 15 presentation. For long-term investors comfortable with European insurance exposure, the valuation, dividend, and earnings trajectory present a coherent case. For shorter-term investors or those sensitive to technical momentum, waiting for the September 15 catalyst to pass and a new technical base to establish may be the more prudent approach. Not financial advice — always conduct your own research or consult a qualified independent financial adviser.
Frequently Asked Questions
Is AXA a good investment in 2026?This article does not constitute financial advice and cannot determine whether AXA is a good investment for any individual. The objective analysis in this guide shows: AXA's H1 2026 results delivered underlying EPS growth of 8% at the top of its 6-8% plan target range, with gross written premiums of €66.3 billion (+5%), Life & Health earnings up 11%, and a Solvency II ratio of 218%. The forward P/E of approximately 9.58-10x is below the European market average of approximately 13-14x and below the level at which most analysts consider a business of this quality to be fairly valued. The forward dividend yield of approximately 5.6-6.26% is among the highest available from a CAC 40 constituent with a 6-year consecutive growth record. 25 of 29 analysts covering AXA rate it a Buy with price targets of €45.90-€50.70. The new 2027-2029 strategic plan, due September 15, 2026, is an important catalyst that this analysis does not incorporate. As with all equity investments, the price may go down as well as up. Consult a qualified independent financial adviser for guidance specific to your circumstances. Sources: AXA H1 2026 press release; Eulerpool; Stockopedia; Investing.com; Oddo BHF analyst note.
What is AXA's dividend yield?
AXA's forward dividend yield is approximately 5.6% to 6.26% as of September 2026, depending on the source and the precise current share price used. The dividend per share for FY25, paid in 2026, was €2.32 per share. AXA has raised its dividend for six consecutive years (Investing.com). The 5-year dividend growth rate is 10.16% per year (Investing.com). The payout ratio is approximately 45% of earnings (Eulerpool), which is conservative and leaves ample room for continued dividend growth. The €1.25 billion share buyback announced with the FY25 results on February 26, 2026 adds to the total shareholder return. The dividend is paid annually, typically in the spring following the financial year end. For current dividend information, always check AXA's investor relations page at axa.com. Not financial advice.
What are analysts' price targets for AXA in 2026?
The consensus 12-month price target for AXA is approximately €45.90 (Eulerpool, 29 analysts) to €46.07 (Investing.com, 19 analysts). Specific firm targets: Berenberg has the highest target at €50.70 (Buy, March 2026). JPMorgan rates the stock Buy with a target of €47-48 (April 2026). Morgan Stanley rates Buy with a target of €46 (March 2026). Oddo BHF rates Outperform with a target of €45 (year-end 2026 target). Of 29 analysts tracked by Eulerpool, 25 rate AXA a Buy and none rate it a Sell. Of 19 analysts tracked by Investing.com, 15 rate it Buy, 4 Hold, 0 Sell. Analyst targets should not be relied upon as investment advice. Targets are based on each firm's modelling assumptions and may not be updated following significant market or company events. Not financial advice.
What happened to AXA's shares after its H1 2026 results?
AXA reported H1 2026 results on July 31, 2026 that were strong by most measures: underlying EPS of €2.19 (+8%), gross written premiums of €66.3 billion (+5%), Life & Health underlying earnings of €2.0 billion (+11%), and a Solvency II ratio of 218%. Despite these results, AXA shares fell below the 50-day moving average (€43.97) in the days following the results, having previously broken through the shorter-term 20- and 38-day moving averages. This type of post-results decline on strong numbers can occur when the positive news was already reflected in the share price before the announcement (a 'sell the news' dynamic), or when investors use the liquidity around results to reduce positions for unrelated reasons. Analyst commentary (deraktionaer.de via Parqet) noted that while the short-term chart picture was negative, the Solvency II ratio and dividend yield remained support factors, and the 100- and 200-day moving averages still remained below the price, keeping the longer-term trend intact. Not financial advice.
What is AXA's new strategic plan for 2027-2029?
As of September 2026 (the date of this article's publication), AXA has not yet presented its 2027-2029 strategic plan. The H1 2026 press release (July 31, 2026) confirmed that the new plan will be presented on September 15, 2026, with business CEO roundtable sessions on September 21. The current strategic plan is called 'Unlock the Future' and covers 2024-2026, with an EPS growth target of 6-8% per year. The key items that the new plan is expected to address include: the new medium-term EPS growth target; deployment of capital from the AXA IM disposal to BNP Paribas (completed July 2025); dividend policy and buyback programme for 2027-2029; and growth priorities across P&C, Life & Health, AXA XL, and Asian markets. The September 15 presentation is a key catalyst for the share price direction. Any investment decision informed by this article should account for the additional information the strategic plan will provide. Always check axa.com for official announcements. Not financial advice.

0 Comments Comments