
Investing
Stocks vs Inflation and Rate Risks: Stock Market This Week
The S&P 500 has gained approximately 13% in 2026 on the back of an exceptionally strong year for corporate profits. But as September arrives — historically the weakest month of the year for US stocks — investors are bracing for the one data point that could determine everything: the August CPI print, due 11 September. Fed Chair Kevin Warsh has already warned at Jackson Hole that inflation is not slowing. Markets are pricing a 56% chance of a rate hike on 16 September, the first since 2023. Here is the full picture.
The S&P 500 was approximately 1% below its mid-August all-time high as markets entered the September holiday-shortened week (US markets closed Monday for Labor Day). The gap reflected the nervousness that has built since Federal Reserve Chair Kevin Warsh’s speech at Jackson Hole, in which he signalled that inflation is not slowing quickly enough and that the Fed may need to act. What had been near-universal market expectations of no further rate hikes in 2026 shifted rapidly. Traders are now pricing a meaningful probability of a quarter-point hike at the Fed’s September 15-16 FOMC meeting — the first rate increase since 2023.
This guide analyses the full picture: where markets stand, what the inflation data is telling us, what the Fed is likely to do, how rising Treasury yields are affecting equity valuations, and what investors should watch over the coming weeks. Not financial or investment advice.
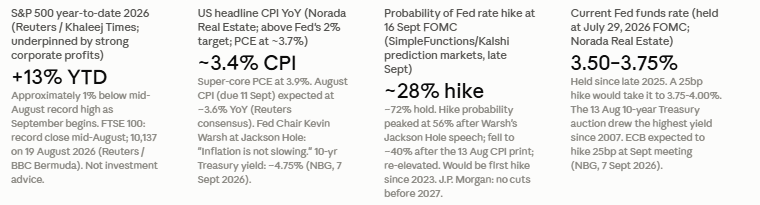
S&P 500 YTD 2026: approximately +13% (Reuters / Khaleej Times). S&P 500 approximately 1% below mid-August record high as September begins. FTSE 100: record close mid-August; 10,137 on 19 August 2026 (BBC Bermuda / Reuters). US CPI (headline): approximately 3.4% YoY; PCE (Fed preferred): ~3.7% (Norada Real Estate). Fed funds rate: 3.50%-3.75% (held at July 29 meeting). September FOMC (16 Sept): markets pricing ~72% hold, ~28% hike probability (SimpleFunctions/Kalshi prediction markets). 10-year Treasury yield: approximately 4.75% (NBG Global Markets Roundup September 7, 2026). August 10yr Treasury auction: highest yield since 2007 (WATC, 13 August 2026). September: historically weakest month for US stocks. J.P. Morgan: no Fed rate cuts before 2027. Not investment advice.
Nvidia has been among the standout contributors to the index’s gains. The WATC Daily Report from 13 August 2026 noted that a strong rise in the leading chipmaker drove US equities to finish just short of a new record high on that date. AI-related semiconductor demand and data centre buildout remained key narrative drivers for the technology sector throughout the first half of the year, and the second-quarter results validated that demand has not softened.
But the composition of the rally carries a caveat that investors should hold in mind as they evaluate current valuations. A significant portion of the S&P 500’s 2026 gains are concentrated in a relatively small number of large-cap technology names whose valuations are highly sensitive to the discount rate applied to long-duration future earnings. As Treasury yields rise — which they have been doing — the mathematical justification for elevated P/E multiples in long-duration growth stocks weakens. This is the structural tension at the heart of the current market moment.
Reuters / Khaleej Times (Wall St Week Ahead, late August/early September 2026): 'The S&P 500 has gained nearly 13% in 2026, underpinned by an exceptionally strong year for corporate profits. But investors have braced for a potential pullback in September, which historically is the weakest month of the year for U.S. stocks.' Sid Vaidya, chief investment strategist at TD Wealth: 'CPI will certainly move the needle one way or the other... so there is a lot riding on this report.'
On 19 August, the FTSE 100’s performance was influenced by the day’s US inflation data. US core CPI came in at 2.6% year-on-year, slightly below forecasts of 2.7%. President Trump, responding to the data, called it proof of ‘very low inflation’ and renewed his criticism of Fed Chair Powell, calling for a ‘big rate cut.’ This softer-than-expected core reading briefly boosted expectations of Fed easing, providing some support to global equity markets including the FTSE 100. Energy stocks on the index advanced due to geopolitical tensions in Iran and Venezuela.
The FTSE 100’s particular vulnerability in a rate-hike environment comes from two sources. First, the index has significant weight in interest rate-sensitive sectors including banking (which benefits from higher rates on net interest margin but faces credit risk concerns), real estate investment trusts, and utilities. Second, the UK’s domestic economic backdrop — with the Bank of England holding base rates at 3.75% and prediction markets pricing no change at the September BoE meeting (prediction market at 91.6¢ for no change) — creates its own set of pressures on UK consumer spending and corporate margins.
The current picture is one of stubborn but moderating inflation. The Fed’s preferred inflation gauge, the Personal Consumption Expenditures (PCE) index, was running at approximately 3.7% year-on-year — well above the 2% target. The ‘super-core’ PCE measure, which strips out food, energy, and housing to focus on services inflation driven by wages, was running at approximately 3.9%. These elevated readings in the services components of inflation reflect the one structural driver that is most difficult to bring down: labour market tightness and wage growth that is running above productivity gains.
The 13 August 2026 CPI print provided modest relief. The data came in broadly in line with expectations, and the implied probability of a September rate hike fell from 48% to 40% on the day. However, yields subsequently rose again after the $42 billion 10-year Treasury auction drew the highest auction yield since 2007 — a stark signal that bond market investors are demanding higher compensation for the risk of holding US government debt at a time when the inflation trajectory remains uncertain.
The word ‘sticky’ has become the defining descriptor of inflation in the current cycle. The Enterprise Bank (July 2026) noted that ‘progress has reversed course somewhat in 2026’ after several years of gradual disinflation. Fed Chair Warsh’s Jackson Hole warning that inflation ‘is not slowing’ reflected this reality. The concern is not hyperinflation — those fears are behind us — but a sustained settling of inflation at 3-4%, structurally above target, that forces the Fed to maintain or increase rates rather than cut them.
The August CPI print (due 11 September 2026) is the critical near-term catalyst. Based on Reuters economist consensus: headline CPI expected at approximately +3.6% YoY; core CPI expected at +0.2% monthly. A print above these expectations could push rate hike probability above 60% and trigger equity market volatility. A print below consensus could reduce hike probability and provide short-term relief. The market has rarely been so binary around a single data point since the rate hike cycle began. Not investment advice. Sources: Reuters / Khaleej Times; Seeking Alpha September 4, 2026; NBG Global Markets Roundup September 7, 2026.
Warsh’s late-August speech at Jackson Hole was described as market-shaking. His statement that inflation ‘is not slowing’ and his reaffirmation of the Fed’s commitment to returning inflation to the 2% target — at any cost to the short-term economic outlook — reset expectations that had been drifting toward a relaxed ‘higher-for-longer’ steady state. In the weeks following Jackson Hole, rate-hike bets ramped up sharply and stock markets were ‘jostled by changes in rate-path expectations,’ in Reuters’ phrasing.
The Fed held rates at its July 29, 2026 meeting at 3.50%-3.75%. But the lack of forward guidance in the press release and press conference did little to reassure markets that the Fed would be ‘ahead of the curve’ on inflation, according to the Enterprise Bank’s monetary policy update for July 2026. The combination of steady rates, elevated inflation, and hawkish rhetoric created the exact environment of uncertainty that markets find most difficult to price.
J.P. Morgan has stated explicitly that it does not expect any Fed rate cuts before 2027, given persistent inflation. This view — if correct — means that the current rate environment of 3.50%-3.75% is the floor, not a transition point to cheaper money. For equity investors who bought into the narrative of imminent rate cuts, this repricing of the rate trajectory is a meaningful headwind.
Federal Reserve Chair Kevin Warsh (Jackson Hole, late August 2026, as reported by Audioboom / Norada Real Estate): 'Inflation is not slowing' and reaffirmed commitment to the Fed’s 2% target. Post-speech market reaction: rate-hike bets for September 2026 rose sharply; Gulf stock markets fell; equity markets globally experienced increased volatility. J.P. Morgan prediction: no Fed rate cuts before 2027 as inflation persists.
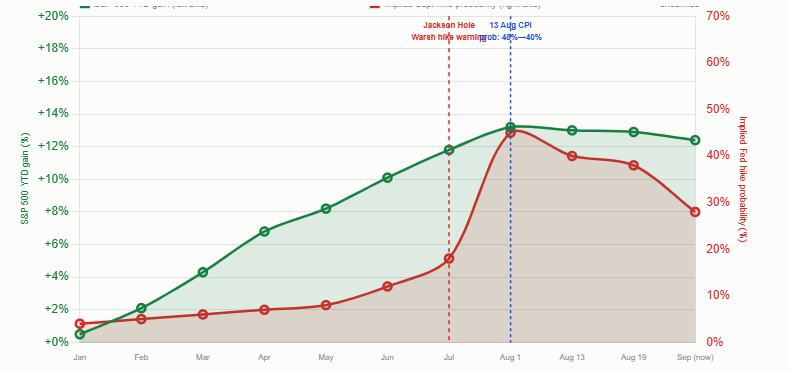
These probabilities have been volatile. The implied probability of a hike was at approximately 33% just weeks before the scheduled meeting, then jumped to approximately 56% following Warsh’s Jackson Hole speech, then fell back toward 40% following the 13 August CPI print that came in broadly in line with expectations. The final number that markets price before the meeting will be a direct function of the 11 September CPI print and any Fed communications in the days between that release and the FOMC blackout period.
For investors, the binary nature of this moment is unusual. Markets that are accustomed to pricing gradual transitions now face a specific event on a specific date that could plausibly go either way. A hike would be the first rate increase since 2023. It would signal that the Warsh Fed is willing to tighten actively rather than simply hold. It would push short-term bond yields higher, compress the equity risk premium further, and most likely trigger at least a temporary sell-off in interest rate-sensitive equity sectors. A hold would be interpreted as a reprieve, though one that the language of the accompanying statement would have to manage carefully to avoid being read as a dovish capitulation.
Note: Probability estimates from SimpleFunctions/Kalshi prediction market data as of late September 2026. Market impact descriptions are illustrative, not guaranteed. Not investment or financial advice.
The mechanics are straightforward. Equity valuations are fundamentally a discounted cash flow calculation: the present value of future earnings, discounted at a rate that reflects the risk-free rate plus an equity risk premium. When the risk-free rate (the 10-year Treasury yield) rises from 3% to 4.75%, the denominator of that calculation increases, reducing the present value of future earnings. This effect is most pronounced for long-duration growth stocks — companies whose earnings are weighted toward the distant future (years 5-20 out) rather than the near term. The AI-driven technology rally that has led the S&P 500 higher in 2026 is concentrated in precisely these long-duration assets.
The 13 August 2026 Treasury auction provided a specific and stark data point. A $42 billion 10-year Treasury auction drew the highest auction yield since 2007. This reflects either a deterioration in demand for US government debt, an upward revision in inflation expectations among long-term investors, or both. The auction yield inversion — where the government had to offer a higher yield than anticipated to attract buyers — is a signal that the bond market’s confidence in a rapid return to price stability is not complete.
Short-term yields have also moved. The NBG Global Markets Roundup notes that ‘yields on short-term government bonds are climbing’ as rate-hike expectations have risen. When short-term yields rise faster than long-term yields — or when both move in the same direction as appears to be happening now — the cost of capital for corporations rises across the board, compressing margins on new debt issuance and reducing the net present value of future investment projects.
Why Treasury yields matter for your stock portfolio: if the 10-year yield is 4.75%, a stock must grow earnings at an even faster rate to justify a premium over the risk-free rate. At 4.75% risk-free, an equity earning a 4% earnings yield (P/E of 25) is providing almost no risk premium for the additional volatility and uncertainty of equity ownership. This is the mathematical case that rising yields erode stock market attractiveness at current valuations. Not investment advice. Sources: NBG Global Markets Roundup September 7, 2026; WATC Daily Report 13 August 2026.
The reasons for September weakness are structural and behavioural rather than fundamental. Institutional investors return from summer breaks and make portfolio repositioning decisions. Corporate pre-announcement windows close, reducing the information flow that often supports prices. Tax-loss harvesting by institutional funds can begin. And historically, September has often coincided with geopolitical or financial risk events — from the 9/11 attacks in 2001 to the Lehman collapse in September 2008 to various currency crises and emerging market sell-offs.
In 2026, September arrives with additional specific catalysts for potential weakness: a pivotal CPI print, an FOMC meeting that could deliver the first rate hike in three years, Middle East tensions that have pushed oil prices higher, and a market that has already gained 13% year-to-date and faces the psychological pressure of holding gains made at what some analysts describe as stretched valuations. The Seeking Alpha analysis from 4 September 2026 was direct: the August CPI rise to 3.6% ‘may push Fed to hike rates above 5%, risking S&P 500 bubble burst.’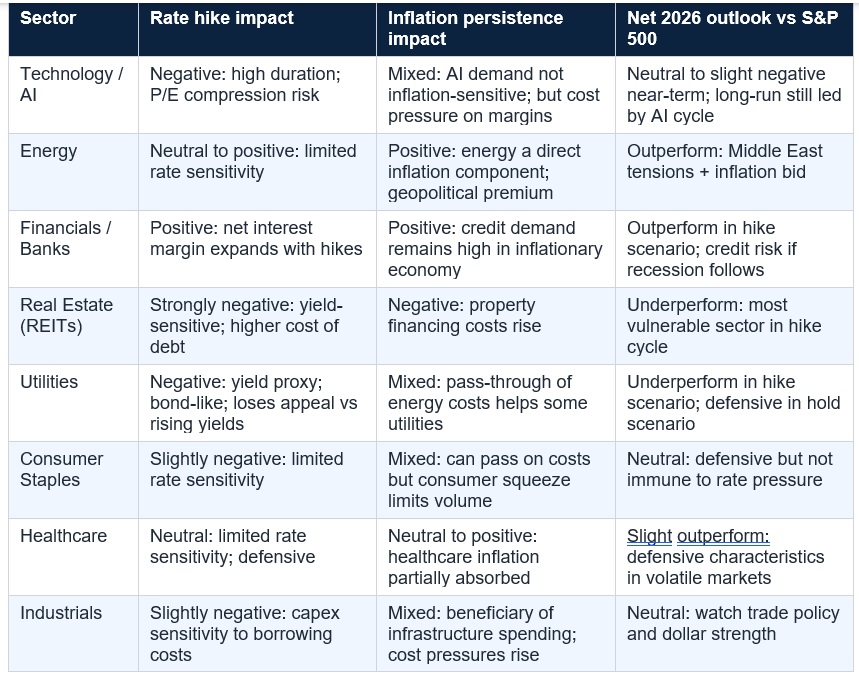
Note: This is an illustrative sector analysis based on general relationships between interest rates, inflation, and sector performance. Actual market movements depend on many additional factors. Not investment advice.
But the headwinds are also real. Inflation at 3.4-3.7% is not a crisis, but it is structurally above the Fed’s target, and the Fed under Kevin Warsh has made clear it is not prepared to tolerate that indefinitely. A September rate hike — priced at approximately 28% probability but contingent on the 11 September CPI print — would be the first tightening move in three years and would force a recalibration of the equity risk premium across the market. The 10-year Treasury at approximately 4.75% is already creating pressure on equity valuations, particularly for the long-duration technology stocks that have led the rally.
September’s historical pattern of weakness, the CPI release on 11 September, the FOMC decision on 16 September, and the ECB meeting in the same week combine to create a period of elevated event risk that is unusual even by recent standards. Investors would be well-served by understanding their portfolio’s rate sensitivity, their sector exposures, and the specific data points and outcomes that would represent the most significant risk to their positions. Not financial or investment advice — always consult a qualified independent financial adviser.
September is statistically the weakest month of the year for US stocks, a pattern that has persisted across multiple decades of market data. The reasons are structural and behavioural: institutional investors return from summer breaks and rebalance portfolios; corporate pre-announcement quiet periods reduce the information flow that often supports prices; tax-loss harvesting by some institutional funds begins; and September has historically coincided with significant risk events (the 9/11 attacks, the Lehman Brothers collapse, various currency crises). In 2026, September arrives with specific additional catalysts: a pivotal CPI print on 11 September, the first potentially hawkish FOMC meeting in years on 15-16 September, and markets that have already gained 13% year-to-date on a full valuation basis. Reuters (Khaleej Times) noted explicitly that 'investors have braced for a potential pullback in September, which historically is the weakest month of the year for U.S. stocks.' Not investment advice.
What happens to stocks if the Fed raises rates in September 2026?
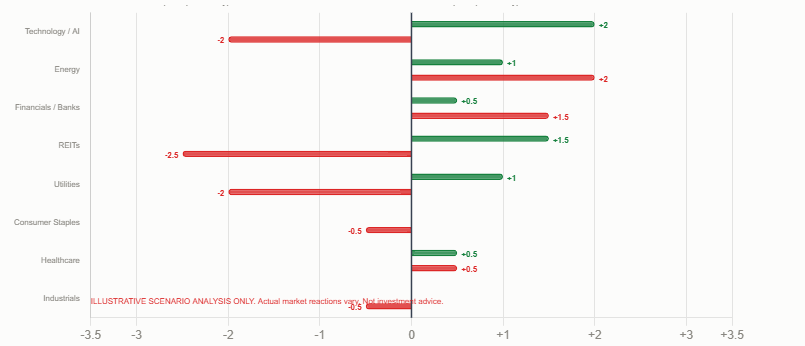
A 25bp rate hike at the 16 September FOMC meeting would be the first rate increase since 2023. The impact on stocks would depend significantly on the accompanying language and forward guidance. In the immediate term, a hike would likely trigger a sell-off of 1-3% in the S&P 500, with the most significant impact on long-duration growth and technology stocks (whose valuations depend on discounting future earnings at the risk-free rate). Financials and banks would be relative beneficiaries. REITs and utilities would be hit hardest. If the hike is accompanied by hawkish forward guidance (dot-plot revisions suggesting further hikes ahead), the sell-off could be deeper. Historically, equities have often continued to rise through rate hike cycles if corporate earnings remain strong — and 2026 corporate earnings have been exceptionally strong. Not investment advice.
What is the current Fed funds rate in September 2026?
The current Fed funds target range is 3.50%-3.75%, where it has been held since late 2025. The most recent FOMC meeting before September was on 29 July 2026, at which the Fed held rates unchanged. The September 15-16 FOMC meeting is the next scheduled decision point. Markets are pricing approximately 72% probability of a hold (no change) and 28% probability of a 25bp hike to 3.75%-4.00%, as of late September prediction market data (SimpleFunctions/Kalshi). J.P. Morgan has stated it does not expect any Fed rate cuts before 2027. Not financial advice. Sources: Norada Real Estate; Enterprise Bank; SimpleFunctions/Kalshi prediction markets.
What is US inflation right now in September 2026?
US headline CPI is running at approximately 3.4% year-on-year (Norada Real Estate) and the Fed's preferred measure, the PCE (Personal Consumption Expenditures) index, is at approximately 3.7% — well above the Fed's 2% target. The super-core PCE, which strips out food, energy, and housing to isolate services inflation driven by wages, is running at approximately 3.9%. The August 2026 CPI print (released 13 August) came in broadly in line with expectations and was described by various sources as showing CPI between 2.4-3.6% depending on the measure and source, reflecting the volatile nature of monthly data. The critical upcoming print is the August CPI due 11 September 2026, which economists expect to show headline at approximately 3.6% YoY. Sources: Norada Real Estate; NBG Global Markets Roundup September 7, 2026; Seeking Alpha September 4, 2026; Enterprise Bank July 2026. Not financial advice.
Should I be invested in stocks right now in September 2026?
This article cannot provide financial advice and cannot determine whether stocks are appropriate for your individual circumstances, risk tolerance, time horizon, or financial goals. The objective analysis in this article shows: the S&P 500 has gained approximately 13% year-to-date on the back of strong corporate earnings; September is historically the weakest month for US stocks; there is approximately 28% probability of a rate hike on 16 September; US CPI at 3.4-3.7% remains above the Fed's 2% target; 10-year Treasury yields are approximately 4.75%, creating valuation pressure on growth stocks; and J.P. Morgan does not expect Fed rate cuts before 2027. The bull case rests on continued strong earnings and a Fed hold; the bear case rests on a hot CPI print and hawkish FOMC. Consult a qualified independent financial adviser for guidance specific to your circumstances. Not financial or investment advice.
Table of Contents
- The Setup: Where Markets Stand Heading Into September 2026
- The S&P 500 in 2026: A 13% Rally Built on Strong Profits
- The FTSE 100: Record Territory but Vulnerable
- Inflation: Still the Market’s Most Important Number
- The Fed Under Kevin Warsh: A More Hawkish Central Bank
- The September 16 Decision: What Markets Are Pricing
- Treasury Yields: The Invisible Hand Squeezing Stocks
- What a Rate Hike Would Mean for Different Asset Classes
- September’s Historical Pattern: The Weakest Month
- The Bull Case: Why Stocks Could Still Hold Up
- The Bear Case: Why the Risks Are Real
- Sector-by-Sector Impact: Who Wins and Who Loses
- What Investors Should Watch in the Coming Weeks
- Conclusion: Vigilance in a Pivotal Month
- Frequently Asked Questions
Inflation vs market — the rate-hike probability timeline
Sector impact — hike vs hold scenarios
September event calendar — what to watch
The Setup: Where Markets Stand Heading Into September 2026
Markets arrive at September 2026 in a state of productive tension. The headline numbers look good: the S&P 500 has gained approximately 13% year-to-date, driven by an exceptionally strong year for corporate profits. The FTSE 100 hit a record close in mid-August before pulling back marginally. Earnings season has broadly delivered. Yet investors are bracing for what could be the most consequential few weeks of the trading year — a period defined by one inflation print and one central bank meeting that together could determine whether the 2026 equity rally continues or suffers its first serious correction.The S&P 500 was approximately 1% below its mid-August all-time high as markets entered the September holiday-shortened week (US markets closed Monday for Labor Day). The gap reflected the nervousness that has built since Federal Reserve Chair Kevin Warsh’s speech at Jackson Hole, in which he signalled that inflation is not slowing quickly enough and that the Fed may need to act. What had been near-universal market expectations of no further rate hikes in 2026 shifted rapidly. Traders are now pricing a meaningful probability of a quarter-point hike at the Fed’s September 15-16 FOMC meeting — the first rate increase since 2023.
This guide analyses the full picture: where markets stand, what the inflation data is telling us, what the Fed is likely to do, how rising Treasury yields are affecting equity valuations, and what investors should watch over the coming weeks. Not financial or investment advice.
S&P 500 YTD 2026: approximately +13% (Reuters / Khaleej Times). S&P 500 approximately 1% below mid-August record high as September begins. FTSE 100: record close mid-August; 10,137 on 19 August 2026 (BBC Bermuda / Reuters). US CPI (headline): approximately 3.4% YoY; PCE (Fed preferred): ~3.7% (Norada Real Estate). Fed funds rate: 3.50%-3.75% (held at July 29 meeting). September FOMC (16 Sept): markets pricing ~72% hold, ~28% hike probability (SimpleFunctions/Kalshi prediction markets). 10-year Treasury yield: approximately 4.75% (NBG Global Markets Roundup September 7, 2026). August 10yr Treasury auction: highest yield since 2007 (WATC, 13 August 2026). September: historically weakest month for US stocks. J.P. Morgan: no Fed rate cuts before 2027. Not investment advice.
The S&P 500 in 2026: A 13% Rally Built on Strong Profits
The S&P 500’s 13% year-to-date gain through late summer 2026 is a better outcome than most strategists forecast at the start of the year, and it rests on a genuinely solid foundation: corporate earnings. The second-quarter 2026 reporting season, which concluded in late summer, delivered an exceptionally strong set of results across most sectors. Technology earnings, in particular, continued to benefit from the ongoing deployment of artificial intelligence infrastructure and software — capital expenditure cycles that are running faster and larger than analysts had projected.Nvidia has been among the standout contributors to the index’s gains. The WATC Daily Report from 13 August 2026 noted that a strong rise in the leading chipmaker drove US equities to finish just short of a new record high on that date. AI-related semiconductor demand and data centre buildout remained key narrative drivers for the technology sector throughout the first half of the year, and the second-quarter results validated that demand has not softened.
But the composition of the rally carries a caveat that investors should hold in mind as they evaluate current valuations. A significant portion of the S&P 500’s 2026 gains are concentrated in a relatively small number of large-cap technology names whose valuations are highly sensitive to the discount rate applied to long-duration future earnings. As Treasury yields rise — which they have been doing — the mathematical justification for elevated P/E multiples in long-duration growth stocks weakens. This is the structural tension at the heart of the current market moment.
Reuters / Khaleej Times (Wall St Week Ahead, late August/early September 2026): 'The S&P 500 has gained nearly 13% in 2026, underpinned by an exceptionally strong year for corporate profits. But investors have braced for a potential pullback in September, which historically is the weakest month of the year for U.S. stocks.' Sid Vaidya, chief investment strategist at TD Wealth: 'CPI will certainly move the needle one way or the other... so there is a lot riding on this report.'
The FTSE 100: Record Territory but Vulnerable
The FTSE 100 has had a strong year by its own historical standards, reaching a record close in mid-August 2026 before pulling back modestly. On 19 August 2026, the index closed at 10,137.35, down just 0.03% on the day but following the record session. The domestically-focused mid-cap FTSE 250 was softer, down 0.47% on the same day, reflecting the differential between the internationally-exposed large-cap index and domestic UK economic conditions.On 19 August, the FTSE 100’s performance was influenced by the day’s US inflation data. US core CPI came in at 2.6% year-on-year, slightly below forecasts of 2.7%. President Trump, responding to the data, called it proof of ‘very low inflation’ and renewed his criticism of Fed Chair Powell, calling for a ‘big rate cut.’ This softer-than-expected core reading briefly boosted expectations of Fed easing, providing some support to global equity markets including the FTSE 100. Energy stocks on the index advanced due to geopolitical tensions in Iran and Venezuela.
The FTSE 100’s particular vulnerability in a rate-hike environment comes from two sources. First, the index has significant weight in interest rate-sensitive sectors including banking (which benefits from higher rates on net interest margin but faces credit risk concerns), real estate investment trusts, and utilities. Second, the UK’s domestic economic backdrop — with the Bank of England holding base rates at 3.75% and prediction markets pricing no change at the September BoE meeting (prediction market at 91.6¢ for no change) — creates its own set of pressures on UK consumer spending and corporate margins.
Inflation: Still the Market’s Most Important Number
For markets in September 2026, the singular most important number remains the same as it has been for four years: the monthly US Consumer Price Index. The August CPI print, due on 11 September 2026, is the last major inflation data point the Federal Reserve will receive before its 15-16 September FOMC meeting. Economists polled by Reuters expect a 0.4% monthly rise in August headline CPI and a 0.2% rise in core CPI. Year-on-year, headline CPI is expected to come in at approximately 3.6%, pushed higher primarily by energy costs.The current picture is one of stubborn but moderating inflation. The Fed’s preferred inflation gauge, the Personal Consumption Expenditures (PCE) index, was running at approximately 3.7% year-on-year — well above the 2% target. The ‘super-core’ PCE measure, which strips out food, energy, and housing to focus on services inflation driven by wages, was running at approximately 3.9%. These elevated readings in the services components of inflation reflect the one structural driver that is most difficult to bring down: labour market tightness and wage growth that is running above productivity gains.
The 13 August 2026 CPI print provided modest relief. The data came in broadly in line with expectations, and the implied probability of a September rate hike fell from 48% to 40% on the day. However, yields subsequently rose again after the $42 billion 10-year Treasury auction drew the highest auction yield since 2007 — a stark signal that bond market investors are demanding higher compensation for the risk of holding US government debt at a time when the inflation trajectory remains uncertain.
The word ‘sticky’ has become the defining descriptor of inflation in the current cycle. The Enterprise Bank (July 2026) noted that ‘progress has reversed course somewhat in 2026’ after several years of gradual disinflation. Fed Chair Warsh’s Jackson Hole warning that inflation ‘is not slowing’ reflected this reality. The concern is not hyperinflation — those fears are behind us — but a sustained settling of inflation at 3-4%, structurally above target, that forces the Fed to maintain or increase rates rather than cut them.
The August CPI print (due 11 September 2026) is the critical near-term catalyst. Based on Reuters economist consensus: headline CPI expected at approximately +3.6% YoY; core CPI expected at +0.2% monthly. A print above these expectations could push rate hike probability above 60% and trigger equity market volatility. A print below consensus could reduce hike probability and provide short-term relief. The market has rarely been so binary around a single data point since the rate hike cycle began. Not investment advice. Sources: Reuters / Khaleej Times; Seeking Alpha September 4, 2026; NBG Global Markets Roundup September 7, 2026.
The Fed Under Kevin Warsh: A More Hawkish Central Bank
The Federal Reserve in September 2026 is not the same institution it was two years ago. Under Chair Kevin Warsh — who succeeded Jerome Powell — the FOMC has adopted a demonstrably more hawkish rhetorical stance on inflation, one that has materially changed how markets interpret the central bank’s forward guidance.Warsh’s late-August speech at Jackson Hole was described as market-shaking. His statement that inflation ‘is not slowing’ and his reaffirmation of the Fed’s commitment to returning inflation to the 2% target — at any cost to the short-term economic outlook — reset expectations that had been drifting toward a relaxed ‘higher-for-longer’ steady state. In the weeks following Jackson Hole, rate-hike bets ramped up sharply and stock markets were ‘jostled by changes in rate-path expectations,’ in Reuters’ phrasing.
The Fed held rates at its July 29, 2026 meeting at 3.50%-3.75%. But the lack of forward guidance in the press release and press conference did little to reassure markets that the Fed would be ‘ahead of the curve’ on inflation, according to the Enterprise Bank’s monetary policy update for July 2026. The combination of steady rates, elevated inflation, and hawkish rhetoric created the exact environment of uncertainty that markets find most difficult to price.
J.P. Morgan has stated explicitly that it does not expect any Fed rate cuts before 2027, given persistent inflation. This view — if correct — means that the current rate environment of 3.50%-3.75% is the floor, not a transition point to cheaper money. For equity investors who bought into the narrative of imminent rate cuts, this repricing of the rate trajectory is a meaningful headwind.
Federal Reserve Chair Kevin Warsh (Jackson Hole, late August 2026, as reported by Audioboom / Norada Real Estate): 'Inflation is not slowing' and reaffirmed commitment to the Fed’s 2% target. Post-speech market reaction: rate-hike bets for September 2026 rose sharply; Gulf stock markets fell; equity markets globally experienced increased volatility. J.P. Morgan prediction: no Fed rate cuts before 2027 as inflation persists.
The September 16 Decision: What Markets Are Pricing
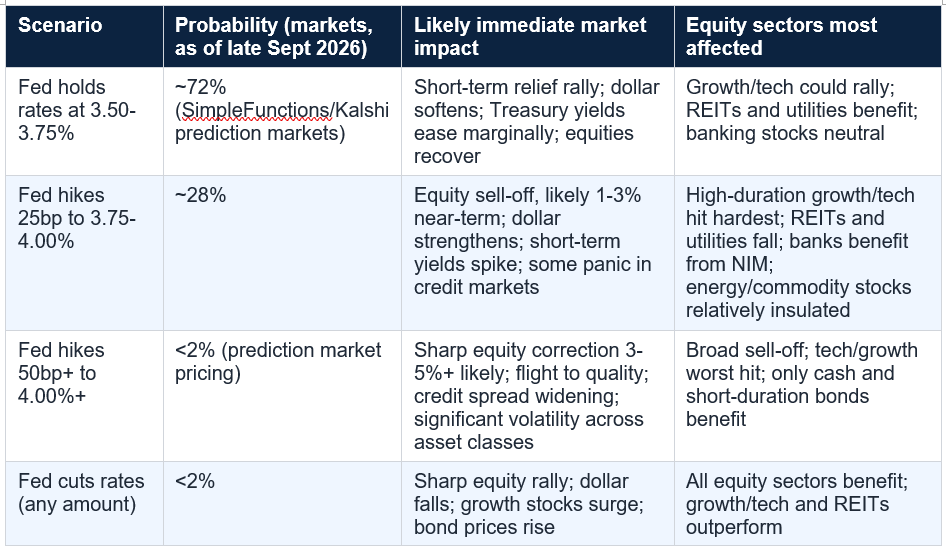
The Federal Open Market Committee is scheduled to announce its September 2026 interest rate decision at 2:00 p.m. Eastern Time on Wednesday, 16 September — the second day of its two-day meeting. As of late September, prediction markets are pricing approximately 72% probability of no change (a hold at 3.50%-3.75%) and approximately 28% probability of a 25 basis point rate hike to 3.75%-4.00%.These probabilities have been volatile. The implied probability of a hike was at approximately 33% just weeks before the scheduled meeting, then jumped to approximately 56% following Warsh’s Jackson Hole speech, then fell back toward 40% following the 13 August CPI print that came in broadly in line with expectations. The final number that markets price before the meeting will be a direct function of the 11 September CPI print and any Fed communications in the days between that release and the FOMC blackout period.
For investors, the binary nature of this moment is unusual. Markets that are accustomed to pricing gradual transitions now face a specific event on a specific date that could plausibly go either way. A hike would be the first rate increase since 2023. It would signal that the Warsh Fed is willing to tighten actively rather than simply hold. It would push short-term bond yields higher, compress the equity risk premium further, and most likely trigger at least a temporary sell-off in interest rate-sensitive equity sectors. A hold would be interpreted as a reprieve, though one that the language of the accompanying statement would have to manage carefully to avoid being read as a dovish capitulation.
Note: Probability estimates from SimpleFunctions/Kalshi prediction market data as of late September 2026. Market impact descriptions are illustrative, not guaranteed. Not investment or financial advice.
Treasury Yields: The Invisible Hand Squeezing Stocks
One of the less-reported but more consequential developments in markets in September 2026 is the behaviour of US Treasury yields. The 10-year Treasury yield has remained elevated at approximately 4.75% in the weeks ahead of the September FOMC, according to the NBG Global Markets Roundup dated 7 September 2026. This is not a crisis level by historical standards, but in the context of a stock market where leading technology companies trade at 25-40x earnings, a 4.75% risk-free rate creates genuine valuation pressure.The mechanics are straightforward. Equity valuations are fundamentally a discounted cash flow calculation: the present value of future earnings, discounted at a rate that reflects the risk-free rate plus an equity risk premium. When the risk-free rate (the 10-year Treasury yield) rises from 3% to 4.75%, the denominator of that calculation increases, reducing the present value of future earnings. This effect is most pronounced for long-duration growth stocks — companies whose earnings are weighted toward the distant future (years 5-20 out) rather than the near term. The AI-driven technology rally that has led the S&P 500 higher in 2026 is concentrated in precisely these long-duration assets.
The 13 August 2026 Treasury auction provided a specific and stark data point. A $42 billion 10-year Treasury auction drew the highest auction yield since 2007. This reflects either a deterioration in demand for US government debt, an upward revision in inflation expectations among long-term investors, or both. The auction yield inversion — where the government had to offer a higher yield than anticipated to attract buyers — is a signal that the bond market’s confidence in a rapid return to price stability is not complete.
Short-term yields have also moved. The NBG Global Markets Roundup notes that ‘yields on short-term government bonds are climbing’ as rate-hike expectations have risen. When short-term yields rise faster than long-term yields — or when both move in the same direction as appears to be happening now — the cost of capital for corporations rises across the board, compressing margins on new debt issuance and reducing the net present value of future investment projects.
Why Treasury yields matter for your stock portfolio: if the 10-year yield is 4.75%, a stock must grow earnings at an even faster rate to justify a premium over the risk-free rate. At 4.75% risk-free, an equity earning a 4% earnings yield (P/E of 25) is providing almost no risk premium for the additional volatility and uncertainty of equity ownership. This is the mathematical case that rising yields erode stock market attractiveness at current valuations. Not investment advice. Sources: NBG Global Markets Roundup September 7, 2026; WATC Daily Report 13 August 2026.
What a Rate Hike Would Mean for Different Asset Classes
A 25bp rate hike at the September 16 FOMC meeting would be the first increase since 2023. Its impact across asset classes would not be uniform, and understanding the differentiated effects is important for investors assessing their portfolio positioning.- Equities broadly: a 25bp hike on its own is unlikely to cause a sustained bear market — the historical record shows that equities have often risen through rate hike cycles as long as corporate earnings remain strong. The S&P 500’s 13% gain in 2026 has itself occurred against a backdrop of elevated rates. The more significant impact would come from what the hike signals about the Fed’s path and persistence: a hike accompanied by hawkish forward guidance suggesting further tightening to come is a more damaging scenario than a one-and-done hike with a neutral statement.
- Growth and technology stocks: most vulnerable to rate rises in the short term because their valuations rely most heavily on discounted long-duration cash flows. A 25bp increase in the discount rate reduces the present value of earnings that are 10-20 years out by more than it reduces the present value of near-term earnings. Growth stocks are effectively long-duration bonds in this respect.
- Bank and financial stocks: have historically been beneficiaries of rate rises, as higher rates expand the net interest margin — the spread between what banks pay on deposits and what they charge on loans. A 25bp hike directly expands this spread for variable-rate loan portfolios. UK banks with significant US dollar exposure would feel a double effect.
- Real estate and utilities: among the most sensitive to rate rises. These sectors are often valued for their dividend yields, which become less attractive relative to risk-free bonds as bond yields rise. Both sectors have also been significant borrowers, and higher rates increase their refinancing costs.
- Bonds (fixed income): a 25bp hike pushes bond prices lower in the short term (yield and price move inversely). Long-duration bonds (20-30 year maturities) are most affected. Short-duration bonds (2-year Treasury notes) would see the biggest immediate yield rise.
- Commodities and energy: often perform relatively well in inflationary environments. Gold and oil have both been areas of investor focus in 2026 amid Middle East geopolitical tensions. Energy stocks on the FTSE 100 advanced on 19 August specifically due to the Iran/Venezuela tension noted in the Reuters wire. A rate hike could be broadly neutral to commodities, with the inflation hedge argument providing support.
September’s Historical Pattern: The Weakest Month
The timing of the current inflation and rate-hike anxiety is made more acute by the historical context: September is the stock market’s most consistently poor-performing month of the year. This is not a folk superstition; it is a consistent statistical pattern across multiple decades of US market data and is noted explicitly by Reuters and multiple market commentators in September 2026.The reasons for September weakness are structural and behavioural rather than fundamental. Institutional investors return from summer breaks and make portfolio repositioning decisions. Corporate pre-announcement windows close, reducing the information flow that often supports prices. Tax-loss harvesting by institutional funds can begin. And historically, September has often coincided with geopolitical or financial risk events — from the 9/11 attacks in 2001 to the Lehman collapse in September 2008 to various currency crises and emerging market sell-offs.
In 2026, September arrives with additional specific catalysts for potential weakness: a pivotal CPI print, an FOMC meeting that could deliver the first rate hike in three years, Middle East tensions that have pushed oil prices higher, and a market that has already gained 13% year-to-date and faces the psychological pressure of holding gains made at what some analysts describe as stretched valuations. The Seeking Alpha analysis from 4 September 2026 was direct: the August CPI rise to 3.6% ‘may push Fed to hike rates above 5%, risking S&P 500 bubble burst.’
The Bull Case: Why Stocks Could Still Hold Up
The Bull Case: Why stocks could navigate September successfully (not investment advice): (1) Corporate earnings strength: S&P 500 gains are supported by genuine earnings growth, not just multiple expansion. Strong Q2 results reduce the risk of a fundamentals-driven sell-off. (2) CPI data could surprise to the downside: if the 11 September print shows headline CPI below 3.5% or core below 0.15% monthly, rate-hike probability falls sharply and equities rally. The 13 August CPI came in line and provided brief relief. (3) Fed may hold and signal patience: a hold accompanied by neutral language would give markets room to breathe. (4) Labour market strength is pro-growth: August non-farm payrolls beat at 162k (NBG). A strong jobs market supports consumer spending and corporate revenue. (5) Earnings outlook still constructive: with the AI infrastructure spending cycle intact, technology earnings consensus for 2026 remains above 2025 actuals. (6) Investors already cautious: a market that has been bracing for September weakness for weeks may have already absorbed much of the negative sentiment.The Bear Case: Why the Risks Are Real
The Bear Risk: The genuine downside risks in September 2026 (not investment advice): (1) CPI comes in hot: a 3.7%+ headline or 0.3%+ monthly core would push hike probability above 70% and likely trigger an immediate equity sell-off. The super-core PCE at 3.9% already shows services inflation well above target. (2) Fed hikes AND signals more to come: the worst scenario for equities is a 25bp hike accompanied by hawkish dot-plot revisions showing rates rising further in 2027. This would force a comprehensive repricing of the equity risk premium. (3) Treasury auction demand continues to weaken: the August 10-year auction at highest yield since 2007 suggests structural fiscal deficit concerns are beginning to price into long-end yields. If the September or October auction sees further weakness, long-end yields rise independently of the Fed. (4) AI earnings disappoint Q3: the Q2 results were strong, but if Q3 earnings season (beginning October) sees any softening in AI-related capital expenditure commitments, the technology sector narrative could shift quickly. (5) Geopolitical escalation: Middle East tensions have already moved energy prices; a significant escalation would add an inflationary supply shock on top of existing demand-driven inflation.1Sector-by-Sector Impact: Who Wins and Who Loses
Note: This is an illustrative sector analysis based on general relationships between interest rates, inflation, and sector performance. Actual market movements depend on many additional factors. Not investment advice.
What Investors Should Watch in the Coming Weeks
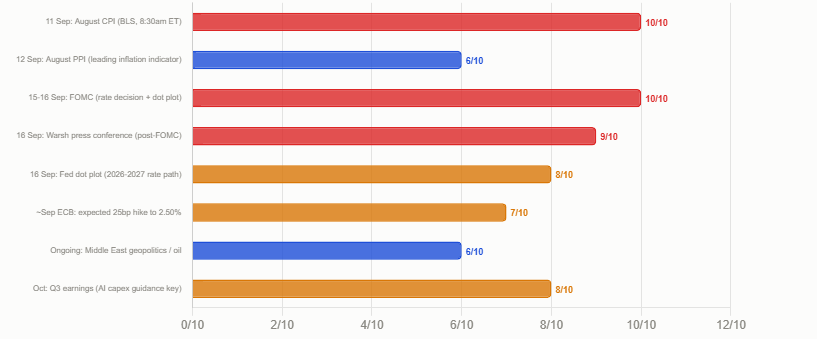
The September–October 2026 window is among the most event-dense periods of the investment calendar. The following sequence of data points and events constitutes the key watch list.- 11 September 2026 — US August CPI report (Bureau of Labor Statistics): the most important single data point for markets in the near term. Consensus expectation: headline ~3.6% YoY; core ~0.2% monthly. A reading significantly above consensus is the primary near-term bear trigger; below consensus would be the bull catalyst. This report will move markets immediately upon release at 8:30am ET.
- 12 September 2026 — US August PPI (Producer Price Index): released the day before CPI, the PPI gives a leading indicator of downstream consumer inflation. A higher-than-expected PPI print the day before CPI would add to rate-hike expectations.
- 15-16 September 2026 — FOMC meeting and rate decision: the decision is announced at 2:00pm ET on Wednesday 16 September. Equally important will be the dot plot (showing FOMC members’ rate expectations for 2026 and beyond), the statement language, and the post-meeting press conference from Chair Warsh. Investors should read all three components together, not just the headline rate move.
- ECB September meeting: the ECB is expected to raise rates by 25bp to 2.50% (NBG Global Markets Roundup, September 7, 2026). A coordinated tightening by the Fed and ECB in the same week would amplify the global rate-rise signal to equity markets.
- October Q3 earnings season: beginning in mid-October, Q3 earnings will provide the next major fundamental data point for equity markets. The key question is whether the AI infrastructure spending cycle that drove Q2 earnings remains intact. Nvidia, Microsoft, Alphabet, and Amazon guidance will be closely watched.
- Geopolitical developments (Iran, Venezuela, Middle East): oil price movements are an inflation signal in themselves. Energy stocks on the FTSE 100 advanced specifically because of Iran and Venezuela tensions on 19 August. A significant escalation in either theatre could add an energy-price component to an already challenging inflation picture.
Conclusion
The stock market today — as of late September 2026 — sits at an unusual intersection of strong fundamentals and meaningful macro risks. The 13% year-to-date gain in the S&P 500 is real and is grounded in genuine corporate earnings strength. The FTSE 100’s record close in mid-August reflects the global nature of the current earnings cycle. These are not trivial gains, and they should not be dismissed by investors focused solely on the macro headwinds.But the headwinds are also real. Inflation at 3.4-3.7% is not a crisis, but it is structurally above the Fed’s target, and the Fed under Kevin Warsh has made clear it is not prepared to tolerate that indefinitely. A September rate hike — priced at approximately 28% probability but contingent on the 11 September CPI print — would be the first tightening move in three years and would force a recalibration of the equity risk premium across the market. The 10-year Treasury at approximately 4.75% is already creating pressure on equity valuations, particularly for the long-duration technology stocks that have led the rally.
September’s historical pattern of weakness, the CPI release on 11 September, the FOMC decision on 16 September, and the ECB meeting in the same week combine to create a period of elevated event risk that is unusual even by recent standards. Investors would be well-served by understanding their portfolio’s rate sensitivity, their sector exposures, and the specific data points and outcomes that would represent the most significant risk to their positions. Not financial or investment advice — always consult a qualified independent financial adviser.
Frequently Asked Questions
Why is September historically bad for stocks?September is statistically the weakest month of the year for US stocks, a pattern that has persisted across multiple decades of market data. The reasons are structural and behavioural: institutional investors return from summer breaks and rebalance portfolios; corporate pre-announcement quiet periods reduce the information flow that often supports prices; tax-loss harvesting by some institutional funds begins; and September has historically coincided with significant risk events (the 9/11 attacks, the Lehman Brothers collapse, various currency crises). In 2026, September arrives with specific additional catalysts: a pivotal CPI print on 11 September, the first potentially hawkish FOMC meeting in years on 15-16 September, and markets that have already gained 13% year-to-date on a full valuation basis. Reuters (Khaleej Times) noted explicitly that 'investors have braced for a potential pullback in September, which historically is the weakest month of the year for U.S. stocks.' Not investment advice.
What happens to stocks if the Fed raises rates in September 2026?
A 25bp rate hike at the 16 September FOMC meeting would be the first rate increase since 2023. The impact on stocks would depend significantly on the accompanying language and forward guidance. In the immediate term, a hike would likely trigger a sell-off of 1-3% in the S&P 500, with the most significant impact on long-duration growth and technology stocks (whose valuations depend on discounting future earnings at the risk-free rate). Financials and banks would be relative beneficiaries. REITs and utilities would be hit hardest. If the hike is accompanied by hawkish forward guidance (dot-plot revisions suggesting further hikes ahead), the sell-off could be deeper. Historically, equities have often continued to rise through rate hike cycles if corporate earnings remain strong — and 2026 corporate earnings have been exceptionally strong. Not investment advice.
What is the current Fed funds rate in September 2026?
The current Fed funds target range is 3.50%-3.75%, where it has been held since late 2025. The most recent FOMC meeting before September was on 29 July 2026, at which the Fed held rates unchanged. The September 15-16 FOMC meeting is the next scheduled decision point. Markets are pricing approximately 72% probability of a hold (no change) and 28% probability of a 25bp hike to 3.75%-4.00%, as of late September prediction market data (SimpleFunctions/Kalshi). J.P. Morgan has stated it does not expect any Fed rate cuts before 2027. Not financial advice. Sources: Norada Real Estate; Enterprise Bank; SimpleFunctions/Kalshi prediction markets.
What is US inflation right now in September 2026?
US headline CPI is running at approximately 3.4% year-on-year (Norada Real Estate) and the Fed's preferred measure, the PCE (Personal Consumption Expenditures) index, is at approximately 3.7% — well above the Fed's 2% target. The super-core PCE, which strips out food, energy, and housing to isolate services inflation driven by wages, is running at approximately 3.9%. The August 2026 CPI print (released 13 August) came in broadly in line with expectations and was described by various sources as showing CPI between 2.4-3.6% depending on the measure and source, reflecting the volatile nature of monthly data. The critical upcoming print is the August CPI due 11 September 2026, which economists expect to show headline at approximately 3.6% YoY. Sources: Norada Real Estate; NBG Global Markets Roundup September 7, 2026; Seeking Alpha September 4, 2026; Enterprise Bank July 2026. Not financial advice.
Should I be invested in stocks right now in September 2026?
This article cannot provide financial advice and cannot determine whether stocks are appropriate for your individual circumstances, risk tolerance, time horizon, or financial goals. The objective analysis in this article shows: the S&P 500 has gained approximately 13% year-to-date on the back of strong corporate earnings; September is historically the weakest month for US stocks; there is approximately 28% probability of a rate hike on 16 September; US CPI at 3.4-3.7% remains above the Fed's 2% target; 10-year Treasury yields are approximately 4.75%, creating valuation pressure on growth stocks; and J.P. Morgan does not expect Fed rate cuts before 2027. The bull case rests on continued strong earnings and a Fed hold; the bear case rests on a hot CPI print and hawkish FOMC. Consult a qualified independent financial adviser for guidance specific to your circumstances. Not financial or investment advice.

0 Comments Comments