
Investing
Stocks Drop as Yields, Rate-Hike Odds Rise: Market This Week
Wednesday, September 16, 2026. The Federal Reserve delivered a unanimous 25-basis-point rate hike to 3.75%-4.00% — its first in more than three years. Markets had priced in the hike. What they hadn’t fully priced in was Chair Kevin Warsh’s press conference, which offered no assurance the cycle was over and signalled 16 of 18 policymakers expect at least one more hike before year-end. Stocks spent the morning higher. They ended lower. The Dow fell 630 points. The S&P 500 closed at 7,551 — right on the key 7,500 support level. This is what happened, why it happened, and what it means.
What was not fully expected was how Warsh would sound at the podium. The Fed Chair acknowledged a strong economy, described inflation as the persistent problem, and offered no language suggesting the hiking cycle was reaching its end. The dot plot — the quarterly projection of where FOMC members see rates heading — showed 16 of 18 policymakers anticipating at least one more 25-basis-point hike before year-end 2026. Only two members saw rates staying where they are.
The market had been positioned for a ‘dovish hike’ — a policy tightening accompanied by language suggesting the committee was satisfied and unlikely to act again soon. Instead, it got a ‘hawkish hike’: a rate increase paired with projections and language signalling the work is not finished. Stocks that had been modestly positive going into the 2:00 PM ET announcement turned negative during the press conference and never recovered. The S&P 500 closed at 7,551 — down 0.45% — exactly on the 7,500 technical support level that the market had been defending for weeks. The Dow fell 630 points. The 10-year Treasury yield settled at 5.00%, a level not seen since 2010.
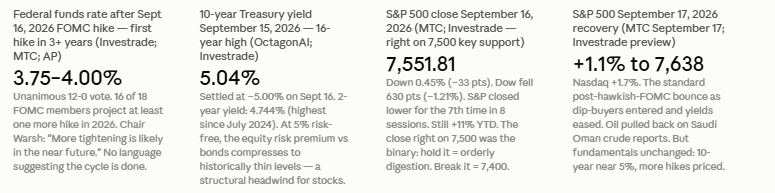
September 16, 2026 closing data: S&P 500: 7,551.81 (-0.45%, -33.48 pts). Dow Jones: 51,462 (-630.56 pts, -1.21%). Nasdaq: 25,978 (-3.15 pts, -0.01%). Russell 2000: 2,858 (-11.46 pts, -0.40%). 10-year Treasury yield: settled at 5.00% (hit 5.04% on September 15 -- 16-year high). Two-year Treasury yield: 4.744% (highest since July 2024). Fed funds rate after hike: 3.75%-4.00%. FOMC vote: 12-0 unanimous. Dot plot: 16 of 18 members see at least one more hike in 2026. Brent crude oil: above $100/barrel. S&P 500 year-to-date: still up approximately 11%. Sources: Investrade; MTC; AP; MyFederalRetirement.com; OctagonAI.
At the June meeting, the Fed left rates unchanged at 3.50%-3.75% but released a dot plot that sent yields sharply higher. Nine of 18 FOMC officials projected at least one rate hike in 2026. The two-year Treasury yield jumped 11 basis points to 4.16% on that announcement alone, and money markets rapidly shifted to pricing the hike as likely by September and fully priced in by December (Anadolu Agency, June 17, 2026). The S&P 500 fell 0.5% on June 17 as markets first digested the hawkish turn.
August brought further pressure. Oil prices surged above $100 per barrel as Middle East tensions escalated around the US-Israeli war with Iran and concerns about energy flows through the Strait of Hormuz intensified. The S&P 500 hit a record high on August 13, but the combination of rising oil and the rate-hike expectation began weighing on the index. By early September, the S&P had pulled back nearly 3% from that record.
September 5 delivered a decisive data point: nonfarm payrolls rose by 162,000, more than double the consensus estimate of 56,000. The stronger-than-expected jobs report boosted rate-hike bets further. The two-year yield briefly hit 4.4246% on September 5 — its highest since January 2025 (The Edge Malaysia, September 5, 2026). Then on September 10-11, August producer price data stoked further inflation worries alongside oil prices, pushing the 10-year Treasury to its highest level in nearly three years. By September 11, CME FedWatch showed traders pricing in a 70% probability of a 25-basis-point hike at the September 16 meeting.
The accompanying statement described the US economy as having strengthened, while characterising inflation as showing little improvement from the Fed’s perspective. The statement noted that ‘more tightening is likely in the near future to effect a timelier drop in inflation’ (Investrade, September 17, 2026). This language — ‘more tightening is likely’ — was the phrase the bond market and equity markets read as the operative signal.
The hike itself was the first rate increase in more than three years, dating back to a tightening cycle that had ended in 2023. The context: the Fed had held rates steady at 3.50%-3.75% through a pause that markets had increasingly come to see as an extended one, until the June 2026 dot plot re-introduced the possibility of further tightening. The September 16 decision was the execution of that signal.
The distinction between the June signal and the September action: at the June meeting, the dot plot projected hikes but the statement held rates. At the September meeting, the committee delivered on that projection. The more important question for markets was not whether the September hike would happen — that was priced in — but what the committee would signal about November and December. The dot plot answer: 16 of 18 members see at least one more. That was the market-moving information.
It was Chair Warsh’s press conference that, as MTC’s September 16 market close analysis put it, ‘broke the tape.’ Warsh framed the economic situation in terms that left no room for dovish interpretation: the economy is strong, inflation is the problem, and the committee has not finished addressing it. He offered no signals that the current level of rates was sufficient, no references to the lag effects of prior tightening that might justify patience, and no language about watching and waiting. The press conference sent the major indexes from modest gains to outright losses in real time as traders adjusted to the reality that this was not a ‘one and done’ event.
The market reaction to a Fed Chair’s words rather than the actual policy decision is a recurring feature of post-FOMC sessions. The decision is communicated at 2:00 PM; the nuance, the emphasis, the forward-looking language all come from the press conference that begins approximately 30 minutes later. On September 16, the divergence between the market’s pre-press-conference positioning (modestly optimistic) and the post-press-conference reality (hawkish for longer) produced the intraday whipsaw that defined the session.
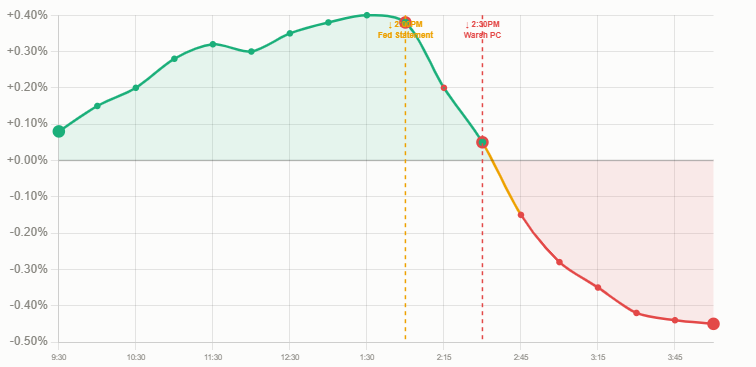
The timeline of September 16: 9:30 AM: S&P 500 opens slightly higher. 10:00 AM-1:30 PM: Index grinds modestly higher; up approximately 0.4% into the Fed window. 2:00 PM: FOMC statement released; rate hike to 3.75%-4.00% confirmed; market initially stable. 2:30 PM: Chair Warsh begins press conference; hawkish framing begins. 2:30-3:00 PM: Major indexes move from small gain to loss in real time as press conference proceeds. 3:00-4:00 PM: Defensive sectors (utilities, staples, healthcare) partially recover; energy, financials, materials continue lower. 4:00 PM: S&P 500 closes at 7,551.81 (-0.45%). Dow closes at 51,462 (-630.56 pts). S&P settles exactly on 7,500 support. Sources: MTC Market Close September 16, 2026; Investrade Closing Recap September 16, 2026.
The September 16, 2026 dot plot was the most hawkish aspect of the entire announcement. It showed 16 of 18 policymakers expecting at least one more 25-basis-point hike before the end of 2026, which would bring the target range to 4.00%-4.25%. Only two of the 18 projected rates remaining at 3.75%-4.00% through year-end 2026 (Investrade; AP/WDEF). The dot plot also showed no committee member projecting a rate cut in 2026, which was consistent with money market pricing that had by this point priced out any possibility of cuts this year and was pricing in further hikes.
The Fed had in an earlier period (the June dot plot) shown nine of 18 members expecting at least one hike in 2026. By September, that number had moved to 16 of 18 — a significant shift toward hawkishness within the committee over the summer period. The alignment between the dot plot and the subsequent policy action gave the market high confidence that the November or December 2026 FOMC meeting would bring another 25-basis-point increase.
For market participants, the dot plot creates what is essentially a roadmap for forward rate expectations, which feeds directly into Treasury yield pricing and discount rate models for equities. When the dot plot shifts hawkishly — as it did on September 16 — the entire forward yield curve re-prices simultaneously, producing the kind of broad equity market selloff that characterised the session.
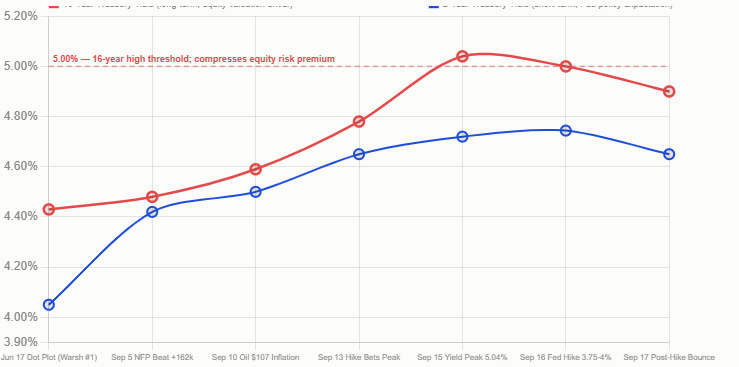
The two-year Treasury yield, which is particularly sensitive to near-term Federal Reserve policy expectations, hit 4.744% on September 16 — its highest since July 2024 (Investrade). The two-year yield had already made a significant move from 4.16% (the June 17 post-dot-plot close) through 4.4246% (the September 5 post-jobs-report peak) to the 4.744% September 16 level, accumulating approximately 58 basis points of increase since June as rate-hike expectations solidified.
The trajectory: The 10-year yield was at 4.43% in mid-June (AP; BNN Bloomberg). By early September, Bloomberg’s markets wrap reported it climbing to 4.78% on renewed hike bets. On September 10, Reuters/Virginia Business reported the 10-year at approximately 4.591% after declining from the 5.04% September 15 peak. The September 16 settlement at 5.00% put the 10-year at a level that changes the fundamental arithmetic of equity valuation in ways described in the next section.
The 5% threshold for the 10-year Treasury yield is not merely a psychological level. It changes the mathematics of equity valuation. When the risk-free rate (Treasuries) yields 5%, the additional return premium required to justify holding equities — which carry risk — must exceed 5%. This compresses the premium available to stocks and reduces the rational case for holding equities relative to bonds. At the 2021-2022 near-zero rate environment, holding bonds yielded essentially nothing, making equities attractive by default. At 5% on the 10-year, bonds are a genuine investment alternative again. Not investment advice.
Stock valuations are based on discounted cash flow — the present value of a company’s future earnings stream, discounted back to today at an appropriate rate. That discount rate incorporates the risk-free rate (Treasury yields) plus a risk premium for equity exposure. When the risk-free rate rises, the discount rate rises, which reduces the present value of every dollar of future earnings. The effect is most severe for long-duration assets — growth stocks whose earnings are expected far in the future — and least severe for near-term cash flow generators.
The second channel is opportunity cost. When 10-year Treasury bonds yield 5.00% with government backing and no earnings risk, the appeal of holding equities at valuations producing comparable or lower yields diminishes. The S&P 500 earnings yield — the inverse of the price-to-earnings ratio — at 19x earnings (the September 11 valuation cited by Reuters/Newcastle Herald) is approximately 5.26%. At a 5.00% risk-free rate, the equity risk premium over Treasuries compresses to approximately 26 basis points — a historically thin buffer for the additional risk of holding stocks.
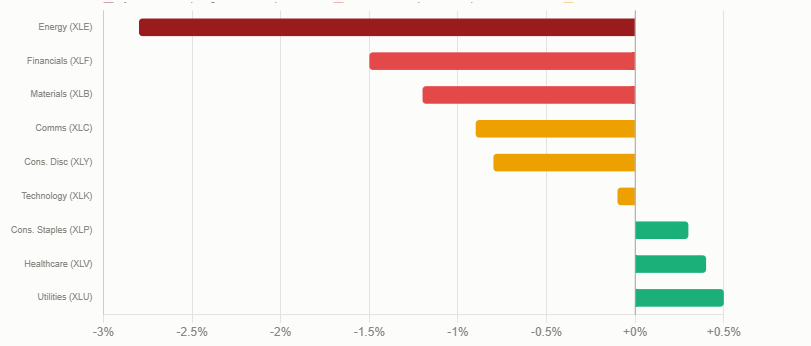
The third channel is credit and economic growth. Higher rates increase borrowing costs for corporations, households, and the federal government. This slows earnings growth expectations, reduces consumer spending power, and can restrain capital investment. For cyclical sectors — energy, materials, financials, consumer discretionary — which are most sensitive to economic growth expectations, this is directly negative. The sector performance on September 16 — energy down 2.8%, financials down 1.5%, materials weak — reflected this channel.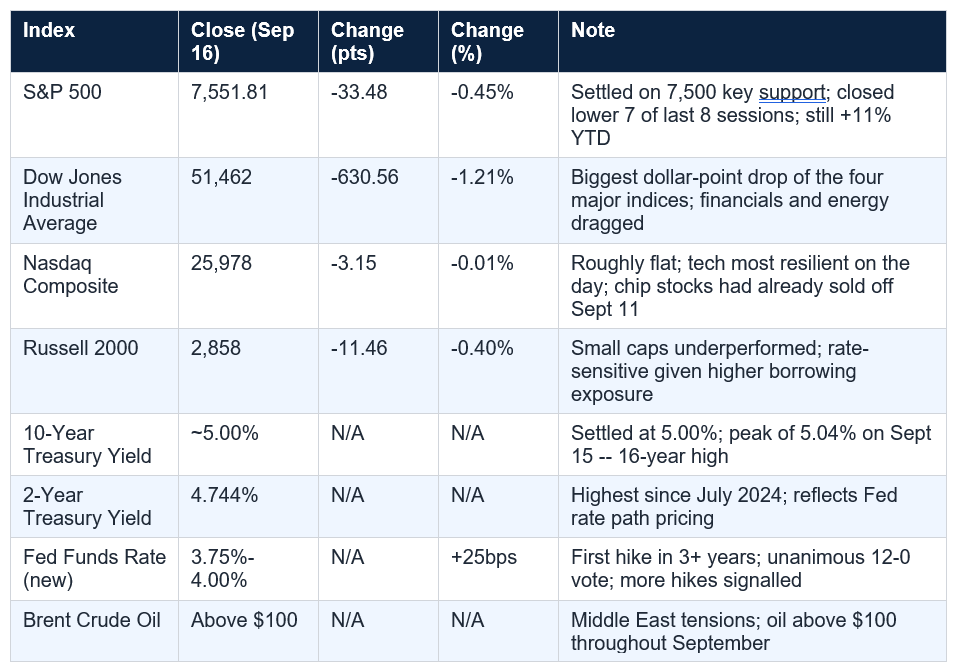
Energy (XLE) was the largest decliner among S&P 500 sectors, falling more than 2.8% despite oil prices remaining above $100 per barrel. The counterintuitive nature of this move — the energy sector falling even as commodity prices stay elevated — reflects the market’s forward-looking nature: higher rates eventually slow economic growth, which compresses future oil demand expectations and creates concern about energy companies’ capital costs and debt servicing.
Financials (XLF) fell more than 1.5%, partly driven by cautious commentary from major banks at the Barclays Financial Conference taking place simultaneously. Goldman Sachs and others provided measured outlooks that weighed on the sector. Banks face a complex rate environment: higher rates can expand net interest margins in the short term but create credit risk and slower loan growth over time.
Materials (XLB), Communications (XLC), and Consumer Discretionary (XLY) were also weak, consistent with a market re-pricing growth expectations downward in response to a more aggressive tightening path. Technology, which had already absorbed significant pressure in the preceding week (Nvidia -2.3%, Micron -4.7% on September 11), was comparatively resilient on September 16, with the Nasdaq ending essentially flat.
The defensive rotation — utilities, consumer staples, and healthcare moving positive as the session progressed — is a classic risk-off pattern. These sectors generate stable, near-term cash flows that are less sensitive to the discount rate effect that penalises long-duration growth assets. They also tend to carry dividend yields that become relatively more attractive when investors are reassessing their equity risk premium.
Technical support levels are price points where buying interest historically has been sufficient to arrest a decline. The 7,500 level had served as a contested zone through September’s rising-yield environment, and the index’s repeated return to it over multiple sessions had given it increasing analytical weight. The September 16 close sitting right on top of 7,500 — neither convincingly below it nor meaningfully above it — left the market in a binary position heading into the September 17 session.
The 7,500 level also had economic valuation context. With the S&P 500 at 19x earnings (the September 11 valuation per Reuters), the index’s ability to hold that multiple in a 5% yield environment was the underlying question. A move below 7,500 would begin re-pricing the market toward the 18x-17x earnings range that a higher-rate-for-longer environment might justify, based on historical discount rate relationships. This is not a technical observation — it is a fundamental one with a technical expression.
At $91 per barrel in early September and above $100 later in the month — a Bloomberg September 2026 markets wrap reported Brent topping $91 at the start of September, with the Virginia Business/Reuters September 10 report noting oil at $107 briefly — the energy cost increase was feeding directly into CPI components in ways that complicated the Fed’s already-difficult inflation-targeting task. Higher oil prices raise transportation costs, which cascade into goods prices across the economy, and they raise household energy expenditures directly, which is a visible and politically salient inflation component.
The combination of a strong labour market (September 5 nonfarm payrolls: 162,000, well above the 56,000 consensus) and elevated oil prices created the specific inflation configuration that made the September hike unavoidable from the Fed’s perspective under Chair Warsh’s framework, which had been established as more inflation-sensitive than his predecessor’s approach.
For equity markets, oil above $100 is a double-edged data point: it lifts energy sector earnings in the short term but signals upstream inflation that tightens monetary policy, increases input costs for non-energy companies, and reduces consumer purchasing power. The net effect on September 16 was clearly negative for equities outside the energy sector, and even energy fell as the rate-hike and growth-slowdown implications outweighed the near-term commodity price benefit.
The actual close confirmed the recovery: the S&P 500 rose 1.1% to 7,638 and the Nasdaq jumped 1.7% (MTC September 17, 2026 close). Treasury yields eased from their September 16 levels, providing relief to rate-sensitive growth stocks. Oil prices pulled back as reports emerged of additional Saudi crude cargoes routing through Oman, easing some of the Strait of Hormuz supply-disruption premium, though crude remained above $100.
The September 17 recovery followed a pattern that is common after hawkish FOMC decisions: an initial selloff as the market adjusts its forward rate expectations, followed by a bounce as dip-buyers enter and some of the initial reaction is assessed as oversold. The Nasdaq’s stronger relative recovery on September 17 (+1.7% vs the S&P’s +1.1%) partially reversed the technology sector’s underperformance in the preceding weeks and reflected the rate sensitivity of long-duration growth assets working in both directions.
The September 17 rebound did not, however, change the fundamental situation: the Fed had signalled at least one more hike, 10-year Treasury yields remained near multi-decade highs, oil was still above $100, and the S&P 500 was still trading approximately 3% below its August 13 record high. The rebound was a tactical recovery, not a fundamental resolution of the conditions that had produced the September selloff.
Sixteen of 18 dot plot members expecting another hike before year-end. The 10-year Treasury settling at 5.00%, a level not seen in 16 years. The two-year yield at 4.744%. Brent crude above $100. The S&P 500 sitting exactly on 7,500 technical support after its seventh down session in eight. These are the coordinates of the market as of the September 16 close.
The September 17 recovery provided some relief, as it often does in the immediate aftermath of a hawkish FOMC decision. But the structural setup heading into the fall of 2026 is clear: the Fed intends to hike again, yields are near multi-decade highs, and the equity market’s ability to sustain near-20x earnings multiples in that environment will be the central question for the remainder of the year. Not investment advice — always consult a qualified financial adviser.
Stocks fell on September 16, 2026 primarily because of the Federal Reserve’s hawkish stance following its 25-basis-point rate hike to 3.75%-4.00%. While the hike itself was widely anticipated (CME FedWatch had priced in a 70% probability beforehand), what moved markets negatively was Fed Chair Kevin Warsh’s press conference and the dot plot projections. Warsh framed the economy as strong and inflation as the persistent problem, offering no language suggesting the hiking cycle was nearing its end. The dot plot showed 16 of 18 FOMC members expecting at least one more 25-basis-point hike before year-end 2026. Stocks had actually been positive going into the 2:00 PM announcement and turned negative during the press conference in real time as traders adjusted to a ‘hawkish hike’ rather than the ‘dovish hike’ many had hoped for. The Dow fell 630 points; the S&P 500 fell 0.45% to close at 7,551; the 10-year Treasury yield settled at 5.00%. Sources: MTC Market Close September 16, 2026; Investrade; AP. Not investment advice.
What did the Federal Reserve do on September 16, 2026?
The Federal Reserve’s Federal Open Market Committee (FOMC) voted unanimously (12-0) on September 16, 2026, to raise the federal funds rate target range by 25 basis points — from 3.50%-3.75% to 3.75%-4.00%. This was the Fed’s first rate hike in more than three years, dating back to a prior tightening cycle that ended in 2023. The decision was led by new Fed Chair Kevin Warsh. The accompanying dot plot (Summary of Economic Projections) showed 16 of 18 FOMC members expecting at least one more 25-basis-point rate hike before the end of 2026, with only 2 members projecting rates staying at 3.75%-4.00% through year-end. The Fed’s accompanying statement said ‘more tightening is likely in the near future’ to address persistent inflation, driven in part by oil prices above $100/barrel related to Middle East geopolitical tensions. Sources: Investrade September 16-17, 2026; MTC; AP; MyFederalRetirement.com. Not investment advice.
Why do Treasury yields affect stock prices?
Treasury yields affect stock prices through three primary channels. First, the discount rate effect: stock prices represent the present value of future earnings, discounted back to today at a rate that incorporates Treasury yields. When yields rise, the discount rate rises, which reduces the present value of every dollar of future earnings. This effect is most severe for growth stocks whose earnings are expected far in the future (long-duration assets). Second, the opportunity cost effect: when risk-free Treasury bonds yield 5%, the additional return required to justify holding riskier equities must exceed 5%. When the equity earnings yield (inverse of P/E ratio) is only marginally above 5%, the risk-return trade-off for equities becomes less compelling. Third, the economic growth channel: higher rates increase borrowing costs for companies, households, and governments, which slows earnings growth, reduces consumer spending, and constrains capital investment. All three channels were operating simultaneously on September 16, 2026, when the 10-year Treasury settled at 5.00%. Not investment advice.
What is the dot plot and what did it show on September 16, 2026?
The dot plot (formally the Summary of Economic Projections) is a quarterly publication from the Federal Reserve in which each FOMC member submits an anonymous projection of where they believe the appropriate federal funds rate should be at the end of each year. The distribution of these projections is displayed as a scatter chart of anonymous dots, allowing markets to read the committee’s collective forward rate expectations. The September 16, 2026 dot plot showed 16 of 18 FOMC members expecting at least one more 25-basis-point rate hike before the end of 2026, which would bring the target range to 4.00%-4.25%. Only 2 members projected rates remaining at 3.75%-4.00% through year-end. No members projected rate cuts in 2026. This represented a significant shift from the June 2026 dot plot, which had shown nine of 18 members expecting a hike. The movement from nine to sixteen between June and September dot plots indicated that the committee had become substantially more aligned toward further tightening. The dot plot is forward-looking and not a commitment — it reflects member expectations at the time of publication. Sources: Investrade; AP; Anadolu Agency. Not investment advice.
What happened to the stock market on September 17, 2026?
After the Federal Reserve’s hawkish hike sent the S&P 500 down 0.45% on September 16, markets rebounded on September 17. Pre-market futures showed the Dow up 383 points (+0.70%), S&P 500 up 61.25 (+0.80%), and Nasdaq up 306.50 (+1.05%). The actual session confirmed the recovery: the S&P 500 rose 1.1% to 7,638 and the Nasdaq jumped 1.7% (MTC September 17, 2026). Treasury yields eased from September 16 levels, and oil prices pulled back on reports of additional Saudi crude supply through Oman. Technology stocks led the rebound, with the Nasdaq’s 1.7% gain outpacing the broader market. In Asian markets, the Nikkei rose 213 points to 64,136, while European indices were also higher. The September 17 rebound is a common pattern after hawkish FOMC decisions — initial selling followed by a bounce as the new policy reality is digested and dip-buyers enter. However, the fundamental conditions — 10-year yields near 5%, 16 of 18 FOMC members hawkish, oil above $100 — remained unchanged. Sources: Investrade September 17, 2026; MTC September 17, 2026. Not investment advice.
Table of Contents
- What Happened: September 16 at a Glance
- The Road to the Hike: How We Got Here
- The FOMC Decision: 25bps, 3.75%-4.00%, Unanimous
- The Warsh Press Conference: The Hawkish Hike That Broke the Tape
- The Dot Plot: 16 of 18 See More Hikes Coming
- Treasury Yields: The 10-Year Hits 5.00%, Two-Year at 4.74%
- Why Rising Yields Sink Stocks: The Mechanics
- Market Close Scoreboard: Dow -630, S&P at 7,551
- Sector Breakdown: Energy Led Down, Defensives Held
- The 7,500 Level: Why It Matters
- Oil Above $100: The Inflation Amplifier
- The Rebound: September 17 Markets Recover
- What Investors Are Watching Next
- Conclusion: A Hawkish Fed in a Strong Economy Is a Volatile Market
- Frequently Asked Questions
Sept 16 intraday: how the press conference broke the tape
Treasury yield trajectory through September 2026
Sector performance: who fell, who held on Sept 16
What Happened: September 16 at a Glance
Wednesday, September 16, 2026 was the day the Federal Reserve ended its longest pause since the pandemic era. The FOMC voted unanimously — 12-0 under Chair Kevin Warsh — to raise the federal funds rate by 25 basis points, bringing the target range from 3.50%-3.75% to 3.75%-4.00%. The hike itself was expected. Markets had priced in a 70% probability of a 25-basis-point move going into the prior week, and that probability had climbed higher as inflation data, oil prices, and strong jobs numbers accumulated in September.What was not fully expected was how Warsh would sound at the podium. The Fed Chair acknowledged a strong economy, described inflation as the persistent problem, and offered no language suggesting the hiking cycle was reaching its end. The dot plot — the quarterly projection of where FOMC members see rates heading — showed 16 of 18 policymakers anticipating at least one more 25-basis-point hike before year-end 2026. Only two members saw rates staying where they are.
The market had been positioned for a ‘dovish hike’ — a policy tightening accompanied by language suggesting the committee was satisfied and unlikely to act again soon. Instead, it got a ‘hawkish hike’: a rate increase paired with projections and language signalling the work is not finished. Stocks that had been modestly positive going into the 2:00 PM ET announcement turned negative during the press conference and never recovered. The S&P 500 closed at 7,551 — down 0.45% — exactly on the 7,500 technical support level that the market had been defending for weeks. The Dow fell 630 points. The 10-year Treasury yield settled at 5.00%, a level not seen since 2010.
September 16, 2026 closing data: S&P 500: 7,551.81 (-0.45%, -33.48 pts). Dow Jones: 51,462 (-630.56 pts, -1.21%). Nasdaq: 25,978 (-3.15 pts, -0.01%). Russell 2000: 2,858 (-11.46 pts, -0.40%). 10-year Treasury yield: settled at 5.00% (hit 5.04% on September 15 -- 16-year high). Two-year Treasury yield: 4.744% (highest since July 2024). Fed funds rate after hike: 3.75%-4.00%. FOMC vote: 12-0 unanimous. Dot plot: 16 of 18 members see at least one more hike in 2026. Brent crude oil: above $100/barrel. S&P 500 year-to-date: still up approximately 11%. Sources: Investrade; MTC; AP; MyFederalRetirement.com; OctagonAI.
The Road to the Hike: How We Got Here
The rate hike on September 16 did not emerge without warning. It was the conclusion of a months-long tightening narrative that had been building since the June 17, 2026 FOMC meeting — the first under the new Fed Chair Kevin Warsh, who replaced Jerome Powell.At the June meeting, the Fed left rates unchanged at 3.50%-3.75% but released a dot plot that sent yields sharply higher. Nine of 18 FOMC officials projected at least one rate hike in 2026. The two-year Treasury yield jumped 11 basis points to 4.16% on that announcement alone, and money markets rapidly shifted to pricing the hike as likely by September and fully priced in by December (Anadolu Agency, June 17, 2026). The S&P 500 fell 0.5% on June 17 as markets first digested the hawkish turn.
August brought further pressure. Oil prices surged above $100 per barrel as Middle East tensions escalated around the US-Israeli war with Iran and concerns about energy flows through the Strait of Hormuz intensified. The S&P 500 hit a record high on August 13, but the combination of rising oil and the rate-hike expectation began weighing on the index. By early September, the S&P had pulled back nearly 3% from that record.
September 5 delivered a decisive data point: nonfarm payrolls rose by 162,000, more than double the consensus estimate of 56,000. The stronger-than-expected jobs report boosted rate-hike bets further. The two-year yield briefly hit 4.4246% on September 5 — its highest since January 2025 (The Edge Malaysia, September 5, 2026). Then on September 10-11, August producer price data stoked further inflation worries alongside oil prices, pushing the 10-year Treasury to its highest level in nearly three years. By September 11, CME FedWatch showed traders pricing in a 70% probability of a 25-basis-point hike at the September 16 meeting.
The FOMC Decision: 25bps, 3.75%-4.00%, Unanimous
At 2:00 PM ET on Wednesday, September 16, the Federal Open Market Committee announced its decision: a 25-basis-point increase in the target range for the federal funds rate, bringing it to 3.75%-4.00%. The vote was unanimous. Every member of the FOMC voted in favour of the increase.The accompanying statement described the US economy as having strengthened, while characterising inflation as showing little improvement from the Fed’s perspective. The statement noted that ‘more tightening is likely in the near future to effect a timelier drop in inflation’ (Investrade, September 17, 2026). This language — ‘more tightening is likely’ — was the phrase the bond market and equity markets read as the operative signal.
The hike itself was the first rate increase in more than three years, dating back to a tightening cycle that had ended in 2023. The context: the Fed had held rates steady at 3.50%-3.75% through a pause that markets had increasingly come to see as an extended one, until the June 2026 dot plot re-introduced the possibility of further tightening. The September 16 decision was the execution of that signal.
The distinction between the June signal and the September action: at the June meeting, the dot plot projected hikes but the statement held rates. At the September meeting, the committee delivered on that projection. The more important question for markets was not whether the September hike would happen — that was priced in — but what the committee would signal about November and December. The dot plot answer: 16 of 18 members see at least one more. That was the market-moving information.
The Warsh Press Conference: The Hawkish Hike That Broke the Tape
The stock market had actually been positive going into the 2:00 PM ET announcement. The S&P 500 was up approximately 0.4% before the Fed statement, as traders took a ‘buy the rumour, sell the news’ setup: the hike was expected, and there was a reasonable market bet that the accompanying language would be measured enough to suggest pause. The S&P 500 went green to slightly negative after the 2:00 PM statement itself.It was Chair Warsh’s press conference that, as MTC’s September 16 market close analysis put it, ‘broke the tape.’ Warsh framed the economic situation in terms that left no room for dovish interpretation: the economy is strong, inflation is the problem, and the committee has not finished addressing it. He offered no signals that the current level of rates was sufficient, no references to the lag effects of prior tightening that might justify patience, and no language about watching and waiting. The press conference sent the major indexes from modest gains to outright losses in real time as traders adjusted to the reality that this was not a ‘one and done’ event.
The market reaction to a Fed Chair’s words rather than the actual policy decision is a recurring feature of post-FOMC sessions. The decision is communicated at 2:00 PM; the nuance, the emphasis, the forward-looking language all come from the press conference that begins approximately 30 minutes later. On September 16, the divergence between the market’s pre-press-conference positioning (modestly optimistic) and the post-press-conference reality (hawkish for longer) produced the intraday whipsaw that defined the session.
The timeline of September 16: 9:30 AM: S&P 500 opens slightly higher. 10:00 AM-1:30 PM: Index grinds modestly higher; up approximately 0.4% into the Fed window. 2:00 PM: FOMC statement released; rate hike to 3.75%-4.00% confirmed; market initially stable. 2:30 PM: Chair Warsh begins press conference; hawkish framing begins. 2:30-3:00 PM: Major indexes move from small gain to loss in real time as press conference proceeds. 3:00-4:00 PM: Defensive sectors (utilities, staples, healthcare) partially recover; energy, financials, materials continue lower. 4:00 PM: S&P 500 closes at 7,551.81 (-0.45%). Dow closes at 51,462 (-630.56 pts). S&P settles exactly on 7,500 support. Sources: MTC Market Close September 16, 2026; Investrade Closing Recap September 16, 2026.
The Dot Plot: 16 of 18 See More Hikes Coming
The dot plot — formally the Summary of Economic Projections — is released quarterly alongside FOMC decisions. Each member of the committee submits an anonymous projection of where they see the appropriate federal funds rate at the end of each upcoming year. The distribution of those projections is displayed as a scatter chart of dots, giving the tool its name. Reading the dot plot is the primary mechanism through which traders discern not just what the Fed did but what the committee collectively expects to do.The September 16, 2026 dot plot was the most hawkish aspect of the entire announcement. It showed 16 of 18 policymakers expecting at least one more 25-basis-point hike before the end of 2026, which would bring the target range to 4.00%-4.25%. Only two of the 18 projected rates remaining at 3.75%-4.00% through year-end 2026 (Investrade; AP/WDEF). The dot plot also showed no committee member projecting a rate cut in 2026, which was consistent with money market pricing that had by this point priced out any possibility of cuts this year and was pricing in further hikes.
The Fed had in an earlier period (the June dot plot) shown nine of 18 members expecting at least one hike in 2026. By September, that number had moved to 16 of 18 — a significant shift toward hawkishness within the committee over the summer period. The alignment between the dot plot and the subsequent policy action gave the market high confidence that the November or December 2026 FOMC meeting would bring another 25-basis-point increase.
For market participants, the dot plot creates what is essentially a roadmap for forward rate expectations, which feeds directly into Treasury yield pricing and discount rate models for equities. When the dot plot shifts hawkishly — as it did on September 16 — the entire forward yield curve re-prices simultaneously, producing the kind of broad equity market selloff that characterised the session.
Treasury Yields: The 10-Year Hits 5.00%, Two-Year at 4.74%
Treasury yields were the transmission mechanism for September’s market pressure. The 10-year Treasury yield — the most widely watched benchmark for long-term borrowing costs, mortgage rates, and equity valuations — settled at approximately 5.00% on September 16, 2026. The day before, September 15, it had briefly touched 5.04% — a 16-year high, not seen since the pre-financial-crisis period of 2008-2010 (OctagonAI; Investrade September 17, 2026).The two-year Treasury yield, which is particularly sensitive to near-term Federal Reserve policy expectations, hit 4.744% on September 16 — its highest since July 2024 (Investrade). The two-year yield had already made a significant move from 4.16% (the June 17 post-dot-plot close) through 4.4246% (the September 5 post-jobs-report peak) to the 4.744% September 16 level, accumulating approximately 58 basis points of increase since June as rate-hike expectations solidified.
The trajectory: The 10-year yield was at 4.43% in mid-June (AP; BNN Bloomberg). By early September, Bloomberg’s markets wrap reported it climbing to 4.78% on renewed hike bets. On September 10, Reuters/Virginia Business reported the 10-year at approximately 4.591% after declining from the 5.04% September 15 peak. The September 16 settlement at 5.00% put the 10-year at a level that changes the fundamental arithmetic of equity valuation in ways described in the next section.
The 5% threshold for the 10-year Treasury yield is not merely a psychological level. It changes the mathematics of equity valuation. When the risk-free rate (Treasuries) yields 5%, the additional return premium required to justify holding equities — which carry risk — must exceed 5%. This compresses the premium available to stocks and reduces the rational case for holding equities relative to bonds. At the 2021-2022 near-zero rate environment, holding bonds yielded essentially nothing, making equities attractive by default. At 5% on the 10-year, bonds are a genuine investment alternative again. Not investment advice.
Why Rising Yields Sink Stocks: The Mechanics
The September 16 session illustrated one of the most fundamental relationships in modern financial markets: when Treasury yields rise, stock prices tend to fall. Understanding why requires understanding how equity prices are determined.Stock valuations are based on discounted cash flow — the present value of a company’s future earnings stream, discounted back to today at an appropriate rate. That discount rate incorporates the risk-free rate (Treasury yields) plus a risk premium for equity exposure. When the risk-free rate rises, the discount rate rises, which reduces the present value of every dollar of future earnings. The effect is most severe for long-duration assets — growth stocks whose earnings are expected far in the future — and least severe for near-term cash flow generators.
The second channel is opportunity cost. When 10-year Treasury bonds yield 5.00% with government backing and no earnings risk, the appeal of holding equities at valuations producing comparable or lower yields diminishes. The S&P 500 earnings yield — the inverse of the price-to-earnings ratio — at 19x earnings (the September 11 valuation cited by Reuters/Newcastle Herald) is approximately 5.26%. At a 5.00% risk-free rate, the equity risk premium over Treasuries compresses to approximately 26 basis points — a historically thin buffer for the additional risk of holding stocks.
The third channel is credit and economic growth. Higher rates increase borrowing costs for corporations, households, and the federal government. This slows earnings growth expectations, reduces consumer spending power, and can restrain capital investment. For cyclical sectors — energy, materials, financials, consumer discretionary — which are most sensitive to economic growth expectations, this is directly negative. The sector performance on September 16 — energy down 2.8%, financials down 1.5%, materials weak — reflected this channel.
Market Close Scoreboard: Dow -630, S&P at 7,551
Sector Breakdown: Energy Led Down, Defensives Held
September 16 was not a uniform market selloff. The session featured a pronounced rotation pattern in which cyclical and economically sensitive sectors bore the heaviest losses while defensive sectors — utilities, consumer staples, healthcare — held their ground or turned modestly positive by the close.Energy (XLE) was the largest decliner among S&P 500 sectors, falling more than 2.8% despite oil prices remaining above $100 per barrel. The counterintuitive nature of this move — the energy sector falling even as commodity prices stay elevated — reflects the market’s forward-looking nature: higher rates eventually slow economic growth, which compresses future oil demand expectations and creates concern about energy companies’ capital costs and debt servicing.
Financials (XLF) fell more than 1.5%, partly driven by cautious commentary from major banks at the Barclays Financial Conference taking place simultaneously. Goldman Sachs and others provided measured outlooks that weighed on the sector. Banks face a complex rate environment: higher rates can expand net interest margins in the short term but create credit risk and slower loan growth over time.
Materials (XLB), Communications (XLC), and Consumer Discretionary (XLY) were also weak, consistent with a market re-pricing growth expectations downward in response to a more aggressive tightening path. Technology, which had already absorbed significant pressure in the preceding week (Nvidia -2.3%, Micron -4.7% on September 11), was comparatively resilient on September 16, with the Nasdaq ending essentially flat.
The defensive rotation — utilities, consumer staples, and healthcare moving positive as the session progressed — is a classic risk-off pattern. These sectors generate stable, near-term cash flows that are less sensitive to the discount rate effect that penalises long-duration growth assets. They also tend to carry dividend yields that become relatively more attractive when investors are reassessing their equity risk premium.
The 7,500 Level: Why It Matters
The S&P 500’s close at 7,551 on September 16 placed the index in precarious proximity to the 7,500 level — a round number that had become a significant technical reference point through September’s market action. MTC’s closing recap was direct about the significance: ‘Hold 7,500 and this is an orderly digestion of a hawkish Fed; lose it and the door opens to 7,400.’Technical support levels are price points where buying interest historically has been sufficient to arrest a decline. The 7,500 level had served as a contested zone through September’s rising-yield environment, and the index’s repeated return to it over multiple sessions had given it increasing analytical weight. The September 16 close sitting right on top of 7,500 — neither convincingly below it nor meaningfully above it — left the market in a binary position heading into the September 17 session.
The 7,500 level also had economic valuation context. With the S&P 500 at 19x earnings (the September 11 valuation per Reuters), the index’s ability to hold that multiple in a 5% yield environment was the underlying question. A move below 7,500 would begin re-pricing the market toward the 18x-17x earnings range that a higher-rate-for-longer environment might justify, based on historical discount rate relationships. This is not a technical observation — it is a fundamental one with a technical expression.
Oil Above $100: The Inflation Amplifier
The September 2026 rate hike did not occur in isolation. The specific inflation driver that had elevated the September rate-hike probability from the June baseline was oil. Brent crude had moved above $100 per barrel through August and September, driven by escalating Middle East tensions around the US-Israeli war with Iran and specific concerns about potential disruptions to energy flows through the Strait of Hormuz (Swiss Info/Bloomberg September 2026 markets wrap).At $91 per barrel in early September and above $100 later in the month — a Bloomberg September 2026 markets wrap reported Brent topping $91 at the start of September, with the Virginia Business/Reuters September 10 report noting oil at $107 briefly — the energy cost increase was feeding directly into CPI components in ways that complicated the Fed’s already-difficult inflation-targeting task. Higher oil prices raise transportation costs, which cascade into goods prices across the economy, and they raise household energy expenditures directly, which is a visible and politically salient inflation component.
The combination of a strong labour market (September 5 nonfarm payrolls: 162,000, well above the 56,000 consensus) and elevated oil prices created the specific inflation configuration that made the September hike unavoidable from the Fed’s perspective under Chair Warsh’s framework, which had been established as more inflation-sensitive than his predecessor’s approach.
For equity markets, oil above $100 is a double-edged data point: it lifts energy sector earnings in the short term but signals upstream inflation that tightens monetary policy, increases input costs for non-energy companies, and reduces consumer purchasing power. The net effect on September 16 was clearly negative for equities outside the energy sector, and even energy fell as the rate-hike and growth-slowdown implications outweighed the near-term commodity price benefit.
The Rebound: September 17 Markets Recover
The September 17, 2026 session provided the post-hike resolution that many investors had been anticipating: a reversal of the prior day’s losses. Pre-market futures showed the Dow up 383 points (+0.70%), the S&P 500 up 61.25 points (+0.80%), and the Nasdaq up 306.50 points (+1.05%) before the open (Investrade September 17 Morning Preview).The actual close confirmed the recovery: the S&P 500 rose 1.1% to 7,638 and the Nasdaq jumped 1.7% (MTC September 17, 2026 close). Treasury yields eased from their September 16 levels, providing relief to rate-sensitive growth stocks. Oil prices pulled back as reports emerged of additional Saudi crude cargoes routing through Oman, easing some of the Strait of Hormuz supply-disruption premium, though crude remained above $100.
The September 17 recovery followed a pattern that is common after hawkish FOMC decisions: an initial selloff as the market adjusts its forward rate expectations, followed by a bounce as dip-buyers enter and some of the initial reaction is assessed as oversold. The Nasdaq’s stronger relative recovery on September 17 (+1.7% vs the S&P’s +1.1%) partially reversed the technology sector’s underperformance in the preceding weeks and reflected the rate sensitivity of long-duration growth assets working in both directions.
The September 17 rebound did not, however, change the fundamental situation: the Fed had signalled at least one more hike, 10-year Treasury yields remained near multi-decade highs, oil was still above $100, and the S&P 500 was still trading approximately 3% below its August 13 record high. The rebound was a tactical recovery, not a fundamental resolution of the conditions that had produced the September selloff.
What Investors Are Watching Next
The September 16 decision created a specific forward-looking agenda for market participants. The key variables that will determine whether the September selloff was a temporary disruption or the beginning of a more sustained repricing are:- The November 2026 FOMC meeting: with 16 of 18 dot plot members expecting another hike, the November meeting is where a second 25-basis-point increase to 4.00%-4.25% appears most likely unless inflation data significantly surprises to the downside between now and then. The CPI and PCE data releases in October will be the primary input into whether the November hike probability stays near 100% or begins to moderate.
- Oil prices: the Strait of Hormuz risk premium remains the most volatile macro variable in the current environment. Any de-escalation in the Middle East that brings oil toward $80 would significantly reduce inflation pressure, potentially allowing the Fed to pause after September. Any escalation that pushes oil toward $120 would entrench the hawkish policy path and produce renewed equity market pressure.
- The 7,500 level on the S&P 500: MTC’s September 16 analysis identified this as the binary for the near-term: hold 7,500 and the market absorbs the hawkish hike in an orderly fashion; break below it and the next technical shelf is 7,400. The September 17 bounce to 7,638 temporarily resolved this question, but the level will remain relevant at any future pullback.
- Two-year Treasury yields: at 4.744% as of September 16, the two-year yield is now pricing a Fed funds rate well above the current 3.75%-4.00% target. Any moderation in two-year yields would suggest markets are beginning to price a pause or policy pivot, which would be supportive for equities. Continued increases would signal additional Fed tightening expectations.
- Federal Reserve commentary: with 16 of 18 dot plot members hawkish, the coming weeks will bring multiple FOMC member speeches. Markets will be parsing each for hints of whether the November hike is ‘locked in’ or ‘data dependent’ in a meaningful sense. The Cleveland Fed’s President Beth Hammack was already scheduled for commentary in the immediate aftermath of the September decision (Gotrade September 2026).
Conclusion
September 16, 2026 illustrated the specific challenge facing equity markets in the second half of 2026: the economy is strong, but that strength is the problem. Strong jobs data (162,000 nonfarm payrolls in August), oil above $100, and persistent inflation gave Kevin Warsh and the FOMC both the motivation and the political cover to resume rate hikes for the first time since 2023. The hike itself was expected. What markets reacted to was the confirmation that the Fed is not finished.Sixteen of 18 dot plot members expecting another hike before year-end. The 10-year Treasury settling at 5.00%, a level not seen in 16 years. The two-year yield at 4.744%. Brent crude above $100. The S&P 500 sitting exactly on 7,500 technical support after its seventh down session in eight. These are the coordinates of the market as of the September 16 close.
The September 17 recovery provided some relief, as it often does in the immediate aftermath of a hawkish FOMC decision. But the structural setup heading into the fall of 2026 is clear: the Fed intends to hike again, yields are near multi-decade highs, and the equity market’s ability to sustain near-20x earnings multiples in that environment will be the central question for the remainder of the year. Not investment advice — always consult a qualified financial adviser.
Frequently Asked Questions
Why did stocks fall on September 16, 2026?Stocks fell on September 16, 2026 primarily because of the Federal Reserve’s hawkish stance following its 25-basis-point rate hike to 3.75%-4.00%. While the hike itself was widely anticipated (CME FedWatch had priced in a 70% probability beforehand), what moved markets negatively was Fed Chair Kevin Warsh’s press conference and the dot plot projections. Warsh framed the economy as strong and inflation as the persistent problem, offering no language suggesting the hiking cycle was nearing its end. The dot plot showed 16 of 18 FOMC members expecting at least one more 25-basis-point hike before year-end 2026. Stocks had actually been positive going into the 2:00 PM announcement and turned negative during the press conference in real time as traders adjusted to a ‘hawkish hike’ rather than the ‘dovish hike’ many had hoped for. The Dow fell 630 points; the S&P 500 fell 0.45% to close at 7,551; the 10-year Treasury yield settled at 5.00%. Sources: MTC Market Close September 16, 2026; Investrade; AP. Not investment advice.
What did the Federal Reserve do on September 16, 2026?
The Federal Reserve’s Federal Open Market Committee (FOMC) voted unanimously (12-0) on September 16, 2026, to raise the federal funds rate target range by 25 basis points — from 3.50%-3.75% to 3.75%-4.00%. This was the Fed’s first rate hike in more than three years, dating back to a prior tightening cycle that ended in 2023. The decision was led by new Fed Chair Kevin Warsh. The accompanying dot plot (Summary of Economic Projections) showed 16 of 18 FOMC members expecting at least one more 25-basis-point rate hike before the end of 2026, with only 2 members projecting rates staying at 3.75%-4.00% through year-end. The Fed’s accompanying statement said ‘more tightening is likely in the near future’ to address persistent inflation, driven in part by oil prices above $100/barrel related to Middle East geopolitical tensions. Sources: Investrade September 16-17, 2026; MTC; AP; MyFederalRetirement.com. Not investment advice.
Why do Treasury yields affect stock prices?
Treasury yields affect stock prices through three primary channels. First, the discount rate effect: stock prices represent the present value of future earnings, discounted back to today at a rate that incorporates Treasury yields. When yields rise, the discount rate rises, which reduces the present value of every dollar of future earnings. This effect is most severe for growth stocks whose earnings are expected far in the future (long-duration assets). Second, the opportunity cost effect: when risk-free Treasury bonds yield 5%, the additional return required to justify holding riskier equities must exceed 5%. When the equity earnings yield (inverse of P/E ratio) is only marginally above 5%, the risk-return trade-off for equities becomes less compelling. Third, the economic growth channel: higher rates increase borrowing costs for companies, households, and governments, which slows earnings growth, reduces consumer spending, and constrains capital investment. All three channels were operating simultaneously on September 16, 2026, when the 10-year Treasury settled at 5.00%. Not investment advice.
What is the dot plot and what did it show on September 16, 2026?
The dot plot (formally the Summary of Economic Projections) is a quarterly publication from the Federal Reserve in which each FOMC member submits an anonymous projection of where they believe the appropriate federal funds rate should be at the end of each year. The distribution of these projections is displayed as a scatter chart of anonymous dots, allowing markets to read the committee’s collective forward rate expectations. The September 16, 2026 dot plot showed 16 of 18 FOMC members expecting at least one more 25-basis-point rate hike before the end of 2026, which would bring the target range to 4.00%-4.25%. Only 2 members projected rates remaining at 3.75%-4.00% through year-end. No members projected rate cuts in 2026. This represented a significant shift from the June 2026 dot plot, which had shown nine of 18 members expecting a hike. The movement from nine to sixteen between June and September dot plots indicated that the committee had become substantially more aligned toward further tightening. The dot plot is forward-looking and not a commitment — it reflects member expectations at the time of publication. Sources: Investrade; AP; Anadolu Agency. Not investment advice.
What happened to the stock market on September 17, 2026?
After the Federal Reserve’s hawkish hike sent the S&P 500 down 0.45% on September 16, markets rebounded on September 17. Pre-market futures showed the Dow up 383 points (+0.70%), S&P 500 up 61.25 (+0.80%), and Nasdaq up 306.50 (+1.05%). The actual session confirmed the recovery: the S&P 500 rose 1.1% to 7,638 and the Nasdaq jumped 1.7% (MTC September 17, 2026). Treasury yields eased from September 16 levels, and oil prices pulled back on reports of additional Saudi crude supply through Oman. Technology stocks led the rebound, with the Nasdaq’s 1.7% gain outpacing the broader market. In Asian markets, the Nikkei rose 213 points to 64,136, while European indices were also higher. The September 17 rebound is a common pattern after hawkish FOMC decisions — initial selling followed by a bounce as the new policy reality is digested and dip-buyers enter. However, the fundamental conditions — 10-year yields near 5%, 16 of 18 FOMC members hawkish, oil above $100 — remained unchanged. Sources: Investrade September 17, 2026; MTC September 17, 2026. Not investment advice.

0 Comments Comments