

Investing
Index Funds vs Prediction Markets: Which Wins ?
Kalshi’s combined trading volume with Polymarket hit $24 billion in April 2026. A winning contract on a political event can return 54% in days. The S&P 500, by contrast, averages about 10% per year. So why would anyone bother with index funds? The answer involves compounding, survivorship bias, Brier scores, and what ‘only a tiny percentage make it big’ actually means for your money.
Against this backdrop of explosive growth, viral social media posts, and stories of traders turning small stakes into large payouts on political events, the question feels increasingly urgent: why bother with a boring S&P 500 index fund averaging 10% per year when prediction markets seem to be where the real money is being made?
This article answers that question honestly. It does not dismiss prediction markets — which have genuine accuracy advantages over traditional forecasting and real utility for certain sophisticated strategies. But it does put the numbers side by side, expose the survivorship bias that makes prediction market returns look better than they are for the average participant, and make the empirical case for why the index fund argument is not just conventional wisdom but the conclusion of decades of hard data. Not financial advice.
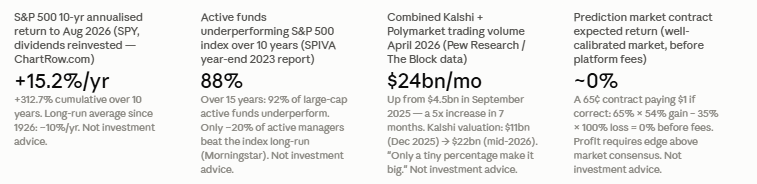
S&P 500 10-year annualized return (to August 25, 2026, SPY total return with dividends): +15.2% per year / +312.7% cumulative (ChartRow.com). S&P 500 YTD 2026 (to August): +12.9%. S&P 500 2025 full year: +16.4%. Long-run average since 1926: ~10% annualized. Combined Kalshi + Polymarket trading volume: $4.5bn (September 2025) → $24bn (April 2026). Kalshi valuation: $11bn (Dec 2025) → $22bn (mid-2026). Only a 'tiny percentage' of prediction market users 'make it big'. 88.08% of large-cap active funds underperformed the index over 10 years (SPIVA 2023). Sources: ChartRow; kill-the-newsletter.com; Keyrock; WSJ; SPIVA. Not investment advice.
Modern prediction markets cover an enormous range of events: the outcome of elections, the Federal Reserve’s next rate decision, whether the S&P 500 will close above a specific level on a specific date, whether a named company will file for bankruptcy within 90 days, the outcome of a Supreme Court case, the probability of a specific country entering recession, and increasingly, cultural events including awards shows, sporting events, and even entertainment outcomes. The markets are genuinely information-rich — in aggregate, they tend to produce more accurate probability estimates than either individual expert forecasters or most polling models.
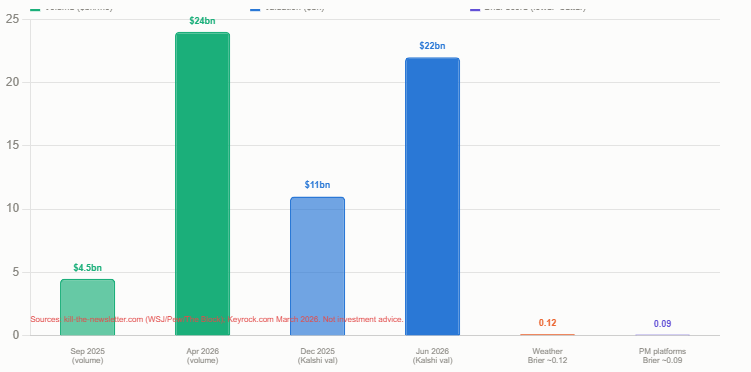
The two dominant platforms in 2026 are Kalshi and Polymarket. Kalshi operates under CFTC regulation in the United States, having reached a compliance agreement with the regulator that gives it a significant institutional advantage. Keyrock’s analysis (March 2026) reports that Kalshi achieves Brier scores near 0.09 across thousands of resolved contracts — Brier scores measure forecasting accuracy, with 0 being perfect and 1 being maximally wrong; 0.09 represents genuinely strong calibration. Polymarket operates via blockchain (Polygon PoS) and has been banned from US users since 2022, but remains the dominant global platform by liquidity.
What a Brier score of 0.09 means in practice: a Brier score measures the mean squared difference between a forecasted probability and the actual outcome (1 or 0). A score of 0.09 means that on average, across thousands of binary predictions, the platform's crowd-sourced probability estimates were very close to the true underlying probabilities. For context: weather forecasters achieve Brier scores around 0.10-0.15 for 24-hour precipitation forecasts. A Brier score of 0.09 at scale, across diverse political and economic events, is remarkable forecasting calibration. Source: Keyrock.com analysis (March 2026). Not investment advice.
3. The Kalshi and Polymarket Numbers: How Big Is This Market?
The growth of prediction markets in 2025–2026 has been genuinely extraordinary. According to kill-the-newsletter.com citing Pew Research Center analysis of data from The Block (a digital assets firm), combined trading volume across Kalshi and Polymarket reached $4.5 billion in September 2025 and surged to approximately $24 billion in April 2026. That is a roughly fivefold increase in seven months, and it reflects both the mainstreaming of the platforms following high-profile political event markets and the flood of institutional interest that followed.
Kalshi’s annualised revenue now exceeds $1.5 billion, and the platform controls more than 90% of the US prediction market by volume. Its valuation doubled in roughly six months, from $11 billion to $22 billion, per the Wall Street Journal. Paradigm, the prominent crypto and fintech venture capital firm that led a $185 million funding round, has publicly stated that it views prediction markets as ‘a future trillion-dollar asset class, much like early cryptocurrency.’ Polymarket, barred from US users by the CFTC since 2022, has reportedly been in talks to raise at a $15 billion valuation despite its US regulatory restriction — testament to the global appetite for the product.
The content of what is being traded is instructive. On Kalshi, politics, elections, and economics combined hold 2.5 times the open interest of sports throughout 2025. On Polymarket, politics led sports in open interest every single day of 2025 by an average of 400%. The inference is clear: sports betting volume — which is large — is not the primary driver of the conviction that has accumulated in these markets. The most-traded, highest-conviction markets are those where informational edge is theoretically possible: political outcomes, economic policy decisions, market level events.
This is the fundamental structure: binary outcome, asymmetric return in calendar-day or calendar-week time horizons, with the potential for both very high short-term percentage returns and complete loss of the staked capital. A 54% return in one week sounds, on the surface, extraordinary compared to an S&P 500 index fund averaging 10% per year. But the comparison is not straightforward. The 65-cent price implies the market assigns a 65% probability to the outcome. If the market is well-calibrated — which the Brier score data suggests it is — then the expected return on the trade is negative: 65% chance of 54% gain, 35% chance of 100% loss, gives an expected return of (0.65 × 0.54) – (0.35 × 1.00) = 35.1% – 35% = approximately 0% before fees.
This is the core mathematical reality of a well-calibrated prediction market: in aggregate, it is approximately zero-sum before fees, meaning that for every participant who profits, another participant loses an equivalent amount. This is structurally different from equity investing, where the underlying companies generate real economic value over time — value that grows the total pie rather than merely redistributing it. Not investment advice.
The implied return arithmetic on a typical prediction market contract (Kalshi S&P 500 weekly example, from Breaking AC / Kalshi): Contract price: 65 cents (implies 65% market probability of 'Yes'). Winning payout: $1.00 per contract. Profit if correct: 35 cents (54% return on stake). Loss if wrong: 65 cents (100% loss on stake). Expected return (if market is well-calibrated): (0.65 x 54%) – (0.35 x 100%) = 35.1% – 35% = ~0% before platform fees. KEY IMPLICATION: Prediction market profit, in aggregate, comes from better calibration than the market (i.e. having better information or judgment than the median participant), not from inherent positive expected return. Index fund profit, in aggregate, comes from the positive long-run expected return of equity markets. These are fundamentally different sources of return. Not investment advice.
There is also the legitimate opportunity cost argument: if you have genuine informational edge on a prediction market — if you know something about a political outcome, an economic data release, or a market event that is not yet reflected in the contract price — then the expected return on that trade is positive rather than zero, and potentially significantly so. Smart prediction market traders who correctly identify mispriced probabilities can and do earn returns that substantially exceed index fund performance in the short term. The question is how many people can genuinely and consistently identify mispriced probabilities across thousands of markets.
And prediction markets do have a genuine edge in one specific domain: information aggregation. A prediction market with deep liquidity on an election or economic event is arguably the most efficient probability machine in existence for that event. It aggregates diverse views, adjusts in real time to new information, and is self-correcting in a way that polls and expert panels are not. The Brier score evidence confirms that well-traded prediction markets are better calibrated than most alternatives. This information-aggregation function has real value — but that value accrues to the market as a mechanism, not necessarily to the individual participant trading within it.
The ChartRow data (to August 25, 2026, using SPY total return with dividends reinvested) provides the most current available figures: the S&P 500 has returned +15.2% per year over the past 10 years (+312.7% cumulative), +12.8% per year over 5 years (+82.9% cumulative), and +11.3% per year over 20 years (+747.5% cumulative). Since SPY’s inception in 1993, the annualised return is +10.6%, with total cumulative return of +2,869.8%. $10,000 invested in 1993 with dividends reinvested would now be worth approximately $296,980.
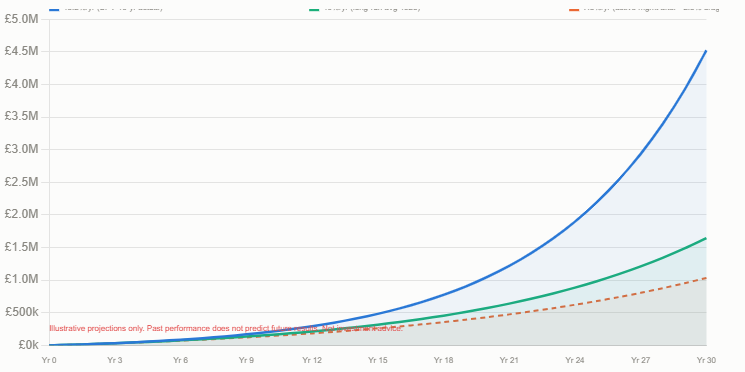
The wealth-building arithmetic over long periods is arresting. Yahoo Finance and the Motley Fool’s calculation shows that $25,000 invested today at a 10% average annual return grows to approximately £436,235 in 30 years. At £10,000 per year invested at 10% for 30 years, the result is approximately £1.8 million. These are not ‘beating the market’ outcomes — they are the outcome of simply matching the market, which an index fund does by definition. The compounding is purely mechanical. No skill, no research, no timing, no edge required. Not investment advice.
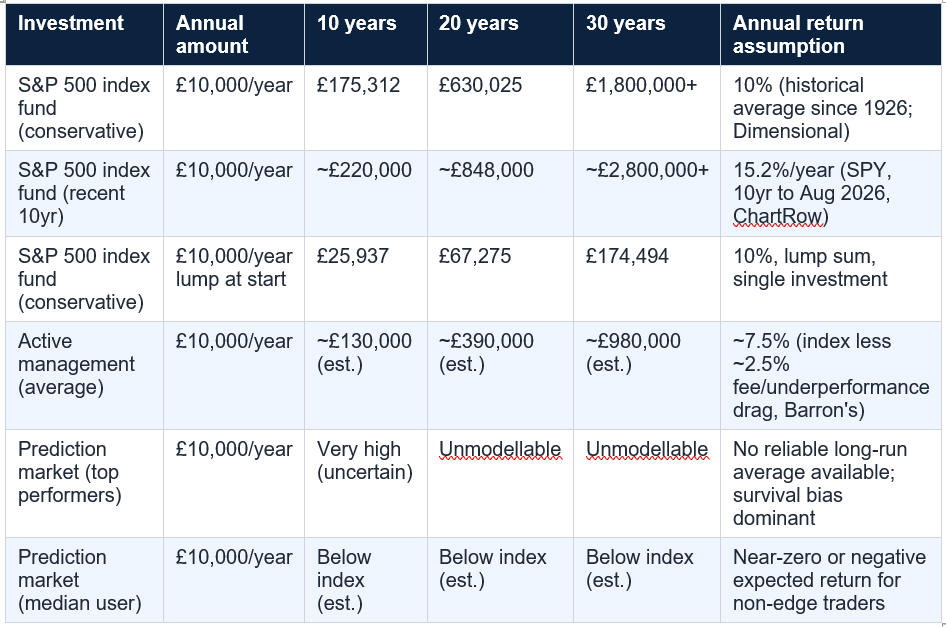
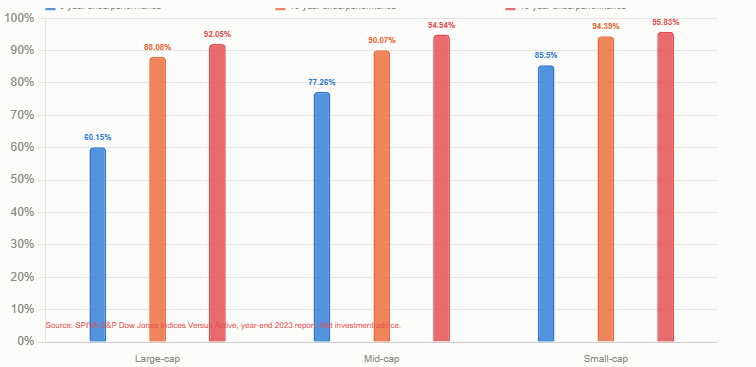
The SPIVA year-end 2023 report — the most comprehensive available — reveals: over a 5-year period, 60.15% of large-cap active funds underperformed the S&P 500; 77.26% of mid-cap funds underperformed; 85.50% of small-cap funds underperformed. Over 10 years: 88.08% of large-cap funds underperformed; 90.07% of mid-cap funds underperformed; 94.39% of small-cap funds underperformed. Over 15 years: 92.05% of large-cap funds; 94.94% of mid-cap; 95.83% of small-cap. Morningstar’s Active/Passive Barometer corroborates: only around 20% of active funds outperform their comparable index over the long run.
These are professional fund managers. They have Bloomberg terminals, research analysts, decades of experience, sophisticated models, and proprietary data. They dedicate their professional lives to outperforming the market. And over long periods, 80–95% of them fail to do so after fees. Barron’s put the drag at approximately 2.5% per year over 10-year periods on average. The implication for individual prediction market traders — who typically have less information, less experience, and are competing against institutions and sophisticated arbitrageurs on both sides of every contract — is sobering.
The SPIVA failure rates are not an argument that everyone is incompetent. They are an argument that the market is highly efficient and that the cost of trying to beat it (in time, fees, research, and errors) typically exceeds the benefit. The same argument applies to prediction markets: for every person who correctly identifies a mispriced contract and profits, there is a counterparty who had the opposite view and lost. The market is zero-sum before fees. Only sustained, verifiable edge produces reliable long-term profit. Sources: SPIVA year-end 2023; Morningstar Active/Passive Barometer; Barron's. Not investment advice.
Kill-the-newsletter.com, citing industry analysis of Kalshi and Polymarket, notes explicitly: ‘Kalshi and Polymarket have millions of users, but only a tiny percentage make it big.’ This is survivorship bias operating at its starkest. The platforms’ growth is driven by volume — millions of contracts, billions of dollars of stakes — not by the average user profiting. In a zero-sum market where the platforms take fees on every contract, the average user’s expected return is not zero but negative.
Survivorship bias also distorts the apparent accuracy of successful prediction market traders. If 1,000 people each bet on a coin flip and the 500 winners bet again, 250 of them will have ‘won twice in a row.’ They did not demonstrate skill; they demonstrated that in a population of 1,000 initial bettors, approximately 250 will win two consecutive 50/50 bets by chance. Applied to prediction markets: the people who appear consistently successful may include a significant proportion who have been lucky rather than skilled, and distinguishing the two requires far more data and far longer track records than most participants have accumulated.
This calibration data is significant for one purpose: understanding what the market is saying about the probability of an event. A Kalshi market showing 72% odds on a particular election outcome is a better calibration of the true probability than most polling models, most expert panels, and most news media commentary. This is genuinely useful, and it means prediction markets serve an important information function in society that goes beyond their entertainment or profit potential.
But strong collective calibration does not imply that individual traders profit. The market is calibrated precisely because the aggregate of all trades reflects all available information — meaning that no individual trade, on average, has positive expected value above the market’s implied probability. The contract that trades at 72 cents is correctly priced at 72 cents by the aggregate of all participants. For a specific individual to profit systematically, they need to consistently identify contracts that are mispriced relative to the true probability — and sustain that edge across many trades and over time. This is possible but difficult, and the evidence from analogous markets (stocks, sports betting) suggests that sustained, replicable edge is rare.
What does not make money systematically is the activity that most retail participants engage in: picking individual contracts on political events or market direction based on intuition, news headlines, or social media sentiment. This is not informed by verifiable informational edge. It is essentially speculating against a well-calibrated market where every publicly available piece of information is already reflected in the price. The parallels with active stock-picking are exact, and the SPIVA data on what happens to active stock pickers over time is the best available evidence for what will happen to most prediction market retail traders over time.
The platforms’ growth — $24 billion in April 2026, a fivefold increase in seven months — is primarily driven by volume, not by users profiting. Volume growth benefits the platforms and reflects the growing popularity of the product. It does not mean that the average participant is generating positive returns. In most large-volume speculative markets — from foreign exchange to cryptocurrency to sports betting — the retail participation rate is high, the retail profitability rate is low, and the platform or counterparty profits from both sides of the trade.
Prediction market contracts, by contrast, are resolved frequently — often within days or weeks. Each resolution is a taxable event. In the UK, prediction market profits are likely subject to income tax rather than capital gains tax (as they are classified as gambling or speculative trading income, though tax treatment depends on circumstances and should be confirmed with a tax adviser). The frequent realisation of gains and the high turnover of prediction market trading creates a tax friction that significantly reduces the after-tax return compared to the pre-tax return. A 54% return on a Kalshi contract may translate to a much lower after-tax gain depending on the trader’s marginal tax rate and the applicable classification.
Index fund investing, by contrast, requires almost no active engagement. You invest, you wait, and the market does the work. The emotional challenge is different: enduring drawdown periods (the S&P 500’s worst annual return since 1926 was approximately −43%) without selling at the wrong time. But the decision frequency is minimal, the monitoring burden is low, and the successful strategy is explicit and simple: do not sell in downturns. The absence of action required is a feature, not a bug.
The psychological cost of active trading is not merely emotional. Behavioural finance research consistently shows that active traders make systematically poor timing decisions — buying high and selling low, rotating too frequently between strategies, chasing recent performance. The DALBAR annual Quantitative Analysis of Investor Behaviour consistently shows that the average equity fund investor earns significantly less than the fund itself returns, because of poor entry and exit timing. The same behavioural pitfalls apply to prediction market trading, amplified by the faster feedback loop and the all-or-nothing contract resolution.
The core portfolio — the long-term wealth-building engine — is a diversified index fund or ETF portfolio. This runs on autopilot, compounds silently at the market rate, and requires no active management. This is the foundation that provides financial security and retirement wealth. No prediction market position, however successful, should be allowed to threaten this foundation.
A discretionary allocation — money that can be entirely lost without affecting lifestyle or retirement security — can be used for prediction market trading by those who have genuine interest in developing edge in this domain. The practical rule used by experienced speculative traders is the ‘1-5% rule’: no more than 1–5% of total investable assets in any speculative activity, including prediction market trading. At this allocation level, even a complete loss of the prediction market portfolio does not materially affect long-term financial outcomes. And if genuine edge is developed and profits are generated, they can be reinvested into the core index portfolio.
The two-bucket approach: Bucket 1 (90-99% of investable assets): Stocks and Shares ISA or pension-sheltered global/US index fund. Low-cost, tax-efficient, automated. This is your retirement and long-term wealth engine. Bucket 2 (1-10% maximum of investable assets): discretionary speculation account. Can include prediction market trading, individual stock picks, or other speculative strategies. Rules: (a) you must be prepared to lose it all; (b) profits are periodically transferred to Bucket 1; (c) losses never exceed the original allocation. This structure captures the entertainment and potential upside of speculation while protecting the long-term wealth engine. Not financial advice. Consult a qualified IFA.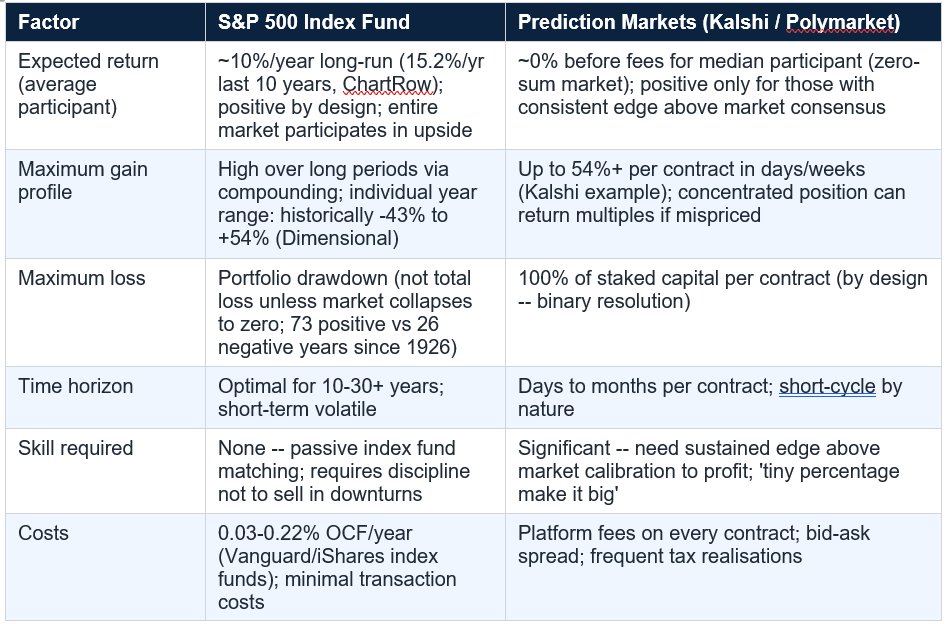
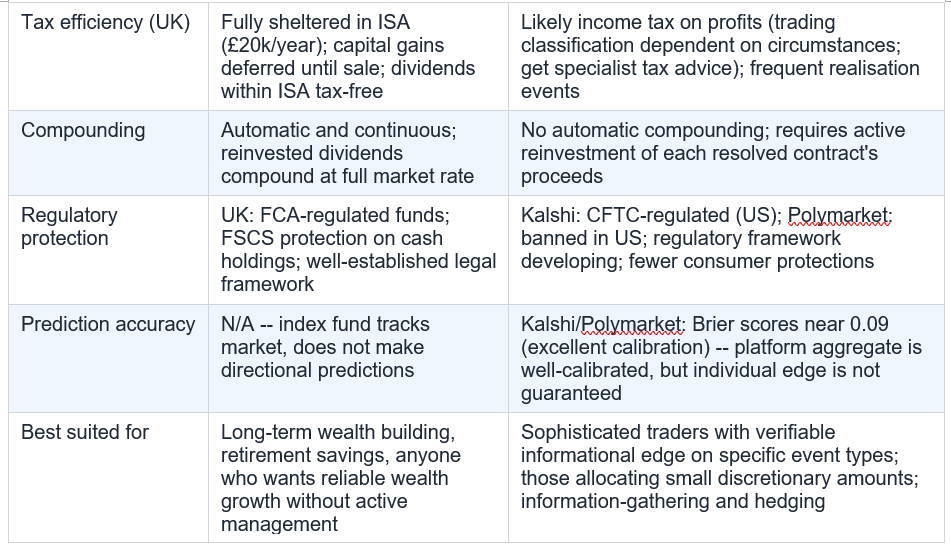
The SPIVA data says that 88–95% of professional active managers underperform the index over 10–15 years. The prediction market data says that only a tiny percentage of users make it big. These are consistent findings: most people, even smart and motivated people who dedicate significant resources to outperforming the market, do not do so consistently. The index fund solves this problem not by being clever but by being humble: it simply matches the market, at minimal cost, and allows compounding to do the rest. That is its enduring advantage.
The prediction markets’ explosive growth — $24 billion in monthly volume, valuations of $15–22 billion for the leading platforms — is real and important. They aggregate information brilliantly. They provide genuine hedging and speculative tools for those with edge. And they are financially significant enough that dismissing them is not intellectually honest. But for most investors, most of the time, the answer to the question of where to put the bulk of their long-term savings remains unchanged: a low-cost, broadly diversified index fund, in a tax-sheltered account, for as long as possible. Not financial advice. Always consult a qualified IFA.
In the short term, yes — a winning prediction market contract can return 50%+ in days, which no index fund achieves in the same time period. But this comparison is misleading. A prediction market contract is a binary outcome: you either win or lose 100% of your stake. The average expected return across all participants in a well-calibrated market is approximately zero before fees, because the contract price already reflects the true probability of the outcome. For the average retail participant, long-run prediction market returns are likely to be below, not above, index fund returns. The S&P 500 has returned +15.2% per year over the past 10 years (SPY, dividends reinvested, to August 2026; ChartRow). Prediction markets offer no comparable long-run average return data because the platforms are too new and survivorship bias dominates the visible statistics. Only a 'tiny percentage' of prediction market users 'make it big' (kill-the-newsletter.com). Not investment advice.
Are prediction markets like Kalshi safe to use?
Kalshi is regulated by the CFTC (Commodity Futures Trading Commission) in the United States, having reached a formal compliance agreement that distinguishes it from unregulated competitors. This regulatory status provides some protection: CFTC oversight means standardised contract design, capital requirements for the platform, and some recourse for users. Polymarket is banned from US users due to CFTC regulatory issues and operates via blockchain (Polygon PoS) without the same framework. Neither platform has FSCS-equivalent protection for UK users in the way that FCA-regulated investment products do. Capital invested in prediction market contracts can be entirely lost on any individual contract by design (binary resolution). Prediction market trading is speculative. Not financial advice — consult a qualified adviser before participating. Sources: pm.wiki/kalshi-vs-polymarket; founders-daily-briefing.beehiiv.com.
What is the S&P 500 index fund's average annual return?
The S&P 500 has returned approximately 10% per year on average since 1926, including dividends (Hartford Funds; Dimensional Fund Advisors; Morningstar). More recently, the 10-year annualised total return (SPY, dividends reinvested) to August 25, 2026 was +15.2% per year (+312.7% cumulative). The 20-year annualised return was +11.3% (+747.5% cumulative). Since SPY's inception in 1993 to August 2026, the return is +10.6% annualised (+2,869.8% cumulative). The S&P 500 returned +16.4% in 2025 and +12.9% year-to-date by August 2026. Annual returns have ranged from approximately -43% (worst) to +54% (best) since 1926. Only 6 of 99 years have been within 2 percentage points of the long-run average. Source: ChartRow.com; Dimensional; Hartford Funds. Past performance does not predict future results. Not investment advice.
Why do most active managers fail to beat index funds?
The SPIVA (S&P Indices Versus Active) year-end 2023 report found that over 10 years, 88.08% of large-cap active funds, 90.07% of mid-cap active funds, and 94.39% of small-cap active funds underperformed their S&P benchmarks. Over 15 years, these figures reach 92-96%. Morningstar's Active/Passive Barometer puts only ~20% of active funds as long-run outperformers. The primary reasons: fees (active funds charge 0.5-1.5% or more per year vs 0.03-0.22% for index funds); the efficiency of markets (all publicly available information is quickly priced in); and the zero-sum nature of active management (every outperformer needs an underperformer on the other side of the trade). The same logic applies to individual prediction market traders. Sources: SPIVA 2023; Morningstar Active/Passive Barometer; Barron's. Not investment advice.
Should I put any money in prediction markets?
This depends entirely on your financial situation, your risk tolerance, and whether you have genuine, verifiable informational edge on specific types of events. For the vast majority of people building long-term wealth, the foundation should be a tax-sheltered (ISA or pension), low-cost, diversified index fund portfolio. This captures the market's positive long-run return at minimal cost, with no skill required. Any participation in prediction markets should be limited to a small discretionary allocation — typically 1-5% of total investable assets — that you are genuinely prepared to lose entirely. If you have a specific informational edge (sophisticated political modelling, domain expertise in economic data, arbitrage tools across platforms), prediction markets may offer positive expected return on that edge. Without verifiable edge, the expected long-run return is approximately zero before fees. Not financial or investment advice. Consult a qualified IFA before making investment decisions.
Table of Contents
- The Question Everybody’s Asking in 2026
- What Prediction Markets Actually Are
- The Kalshi and Polymarket Numbers: How Big Is This Market?
- How a Prediction Market Contract Works — and What It Actually Pays
- The Case Against Index Funds: What the Critics Say
- The Compounding Case for Index Funds: 10% Every Year for 30 Years
- The SPIVA Data: What Active Managers (Who Do This Full-Time) Actually Achieve
- The Survivorship Bias Trap: Why You Only See the Winners
- Prediction Markets: What the Calibration Data Actually Shows
- Who Makes Money on Prediction Markets?
- The Tax and Friction Layer: What You Actually Keep
- Volatility, Sleep, and the Psychological Cost of Speculation
- The Case for Both: How Sophisticated Investors Use Prediction Markets
- The Honest Side-by-Side Comparison
- Conclusion: Different Games, Different Odds
- Frequently Asked Questions
Index fund compounding — the silent wealth engine
Active vs passive — the SPIVA scorecard
Prediction market mechanics — what the numbers show
The Question Everybody’s Asking in 2026
In May 2026, traders on Kalshi were assigning more than 50% odds that the S&P 500 would cross 8,000 during the year — a probability that had risen from around 40% at the start of the year as the market rallied. Simultaneously, the combined trading volume of Kalshi and Polymarket reached $24 billion in April 2026, up from $4.5 billion in September 2025 — a roughly fivefold increase in seven months. Kalshi’s valuation rocketed from $11 billion in December 2025 to $22 billion by mid-2026, per the Wall Street Journal. Polymarket, banned in the US since 2022 but dominant globally via blockchain, was reportedly in talks to raise money at a $15 billion valuation.Against this backdrop of explosive growth, viral social media posts, and stories of traders turning small stakes into large payouts on political events, the question feels increasingly urgent: why bother with a boring S&P 500 index fund averaging 10% per year when prediction markets seem to be where the real money is being made?
This article answers that question honestly. It does not dismiss prediction markets — which have genuine accuracy advantages over traditional forecasting and real utility for certain sophisticated strategies. But it does put the numbers side by side, expose the survivorship bias that makes prediction market returns look better than they are for the average participant, and make the empirical case for why the index fund argument is not just conventional wisdom but the conclusion of decades of hard data. Not financial advice.
S&P 500 10-year annualized return (to August 25, 2026, SPY total return with dividends): +15.2% per year / +312.7% cumulative (ChartRow.com). S&P 500 YTD 2026 (to August): +12.9%. S&P 500 2025 full year: +16.4%. Long-run average since 1926: ~10% annualized. Combined Kalshi + Polymarket trading volume: $4.5bn (September 2025) → $24bn (April 2026). Kalshi valuation: $11bn (Dec 2025) → $22bn (mid-2026). Only a 'tiny percentage' of prediction market users 'make it big'. 88.08% of large-cap active funds underperformed the index over 10 years (SPIVA 2023). Sources: ChartRow; kill-the-newsletter.com; Keyrock; WSJ; SPIVA. Not investment advice.
What Prediction Markets Actually Are
Prediction markets are exchanges where participants buy and sell contracts whose payoff is determined by the outcome of a specific real-world event. The contract either resolves to ‘Yes’ (paying out $1 per contract) or ‘No’ (paying out nothing). The price at which a contract trades reflects the market’s collective estimate of the probability that the event occurs. A contract trading at 65 cents on the dollar implies a 65% market-implied probability that the event resolves ‘Yes.’Modern prediction markets cover an enormous range of events: the outcome of elections, the Federal Reserve’s next rate decision, whether the S&P 500 will close above a specific level on a specific date, whether a named company will file for bankruptcy within 90 days, the outcome of a Supreme Court case, the probability of a specific country entering recession, and increasingly, cultural events including awards shows, sporting events, and even entertainment outcomes. The markets are genuinely information-rich — in aggregate, they tend to produce more accurate probability estimates than either individual expert forecasters or most polling models.
The two dominant platforms in 2026 are Kalshi and Polymarket. Kalshi operates under CFTC regulation in the United States, having reached a compliance agreement with the regulator that gives it a significant institutional advantage. Keyrock’s analysis (March 2026) reports that Kalshi achieves Brier scores near 0.09 across thousands of resolved contracts — Brier scores measure forecasting accuracy, with 0 being perfect and 1 being maximally wrong; 0.09 represents genuinely strong calibration. Polymarket operates via blockchain (Polygon PoS) and has been banned from US users since 2022, but remains the dominant global platform by liquidity.
What a Brier score of 0.09 means in practice: a Brier score measures the mean squared difference between a forecasted probability and the actual outcome (1 or 0). A score of 0.09 means that on average, across thousands of binary predictions, the platform's crowd-sourced probability estimates were very close to the true underlying probabilities. For context: weather forecasters achieve Brier scores around 0.10-0.15 for 24-hour precipitation forecasts. A Brier score of 0.09 at scale, across diverse political and economic events, is remarkable forecasting calibration. Source: Keyrock.com analysis (March 2026). Not investment advice.
3. The Kalshi and Polymarket Numbers: How Big Is This Market?
The growth of prediction markets in 2025–2026 has been genuinely extraordinary. According to kill-the-newsletter.com citing Pew Research Center analysis of data from The Block (a digital assets firm), combined trading volume across Kalshi and Polymarket reached $4.5 billion in September 2025 and surged to approximately $24 billion in April 2026. That is a roughly fivefold increase in seven months, and it reflects both the mainstreaming of the platforms following high-profile political event markets and the flood of institutional interest that followed.
Kalshi’s annualised revenue now exceeds $1.5 billion, and the platform controls more than 90% of the US prediction market by volume. Its valuation doubled in roughly six months, from $11 billion to $22 billion, per the Wall Street Journal. Paradigm, the prominent crypto and fintech venture capital firm that led a $185 million funding round, has publicly stated that it views prediction markets as ‘a future trillion-dollar asset class, much like early cryptocurrency.’ Polymarket, barred from US users by the CFTC since 2022, has reportedly been in talks to raise at a $15 billion valuation despite its US regulatory restriction — testament to the global appetite for the product.
The content of what is being traded is instructive. On Kalshi, politics, elections, and economics combined hold 2.5 times the open interest of sports throughout 2025. On Polymarket, politics led sports in open interest every single day of 2025 by an average of 400%. The inference is clear: sports betting volume — which is large — is not the primary driver of the conviction that has accumulated in these markets. The most-traded, highest-conviction markets are those where informational edge is theoretically possible: political outcomes, economic policy decisions, market level events.
How a Prediction Market Contract Works — and What It Actually Pays
The mechanics of a prediction market contract are simple but the implied return profile is radically different from index fund investing. Using a concrete Kalshi example from Breaking AC (published May 2025, based on actual Kalshi mechanics): if you believe the S&P 500 will end the week higher, you buy a ‘Yes’ contract for 65 cents. If the market closes up for the week, your contract pays out $1, giving you 35 cents of profit on a 65-cent stake — a return of approximately 54% on invested capital in under a week. If the market closes down, you lose the entire 65 cents, a 100% loss on that stake.This is the fundamental structure: binary outcome, asymmetric return in calendar-day or calendar-week time horizons, with the potential for both very high short-term percentage returns and complete loss of the staked capital. A 54% return in one week sounds, on the surface, extraordinary compared to an S&P 500 index fund averaging 10% per year. But the comparison is not straightforward. The 65-cent price implies the market assigns a 65% probability to the outcome. If the market is well-calibrated — which the Brier score data suggests it is — then the expected return on the trade is negative: 65% chance of 54% gain, 35% chance of 100% loss, gives an expected return of (0.65 × 0.54) – (0.35 × 1.00) = 35.1% – 35% = approximately 0% before fees.
This is the core mathematical reality of a well-calibrated prediction market: in aggregate, it is approximately zero-sum before fees, meaning that for every participant who profits, another participant loses an equivalent amount. This is structurally different from equity investing, where the underlying companies generate real economic value over time — value that grows the total pie rather than merely redistributing it. Not investment advice.
The implied return arithmetic on a typical prediction market contract (Kalshi S&P 500 weekly example, from Breaking AC / Kalshi): Contract price: 65 cents (implies 65% market probability of 'Yes'). Winning payout: $1.00 per contract. Profit if correct: 35 cents (54% return on stake). Loss if wrong: 65 cents (100% loss on stake). Expected return (if market is well-calibrated): (0.65 x 54%) – (0.35 x 100%) = 35.1% – 35% = ~0% before platform fees. KEY IMPLICATION: Prediction market profit, in aggregate, comes from better calibration than the market (i.e. having better information or judgment than the median participant), not from inherent positive expected return. Index fund profit, in aggregate, comes from the positive long-run expected return of equity markets. These are fundamentally different sources of return. Not investment advice.
The Case Against Index Funds: What the Critics Say
The critics of index fund investing are not wrong about everything. The most legitimate criticisms are these: index funds are passive by design, which means they will underperform in periods of significant market dispersion (where some stocks rise dramatically while others fall); the recent concentration of major US indices in a small number of mega-cap technology stocks means that ‘diversified’ index investing is less diversified than it once was; and the 10% long-run average return obscures enormous year-to-year variance — only 6 of the 99 years since 1926 have delivered returns within 2 percentage points of the average (Dimensional Fund Advisors).There is also the legitimate opportunity cost argument: if you have genuine informational edge on a prediction market — if you know something about a political outcome, an economic data release, or a market event that is not yet reflected in the contract price — then the expected return on that trade is positive rather than zero, and potentially significantly so. Smart prediction market traders who correctly identify mispriced probabilities can and do earn returns that substantially exceed index fund performance in the short term. The question is how many people can genuinely and consistently identify mispriced probabilities across thousands of markets.
And prediction markets do have a genuine edge in one specific domain: information aggregation. A prediction market with deep liquidity on an election or economic event is arguably the most efficient probability machine in existence for that event. It aggregates diverse views, adjusts in real time to new information, and is self-correcting in a way that polls and expert panels are not. The Brier score evidence confirms that well-traded prediction markets are better calibrated than most alternatives. This information-aggregation function has real value — but that value accrues to the market as a mechanism, not necessarily to the individual participant trading within it.
The Compounding Case for Index Funds: 10% Every Year for 30 Years
The core argument for index fund investing over a long time horizon is not that it is exciting, or that it produces the highest single-year return, or that it is immune to loss. It is that it reliably captures the positive long-run expected return of the equity market, at minimal cost, without requiring any skill, time, or information advantage on the part of the investor. The return compounds, silently, without any action required.The ChartRow data (to August 25, 2026, using SPY total return with dividends reinvested) provides the most current available figures: the S&P 500 has returned +15.2% per year over the past 10 years (+312.7% cumulative), +12.8% per year over 5 years (+82.9% cumulative), and +11.3% per year over 20 years (+747.5% cumulative). Since SPY’s inception in 1993, the annualised return is +10.6%, with total cumulative return of +2,869.8%. $10,000 invested in 1993 with dividends reinvested would now be worth approximately $296,980.
The wealth-building arithmetic over long periods is arresting. Yahoo Finance and the Motley Fool’s calculation shows that $25,000 invested today at a 10% average annual return grows to approximately £436,235 in 30 years. At £10,000 per year invested at 10% for 30 years, the result is approximately £1.8 million. These are not ‘beating the market’ outcomes — they are the outcome of simply matching the market, which an index fund does by definition. The compounding is purely mechanical. No skill, no research, no timing, no edge required. Not investment advice.
The SPIVA Data: What Active Managers (Who Do This Full-Time) Actually Achieve
The most damning evidence against the idea that individual investors can systematically beat passive index funds comes not from prediction markets but from the systematic measurement of professional active fund managers. The SPIVA (S&P Indices Versus Active) report is the industry’s most respected scorecard, updated semi-annually and covering decades of fund performance data.The SPIVA year-end 2023 report — the most comprehensive available — reveals: over a 5-year period, 60.15% of large-cap active funds underperformed the S&P 500; 77.26% of mid-cap funds underperformed; 85.50% of small-cap funds underperformed. Over 10 years: 88.08% of large-cap funds underperformed; 90.07% of mid-cap funds underperformed; 94.39% of small-cap funds underperformed. Over 15 years: 92.05% of large-cap funds; 94.94% of mid-cap; 95.83% of small-cap. Morningstar’s Active/Passive Barometer corroborates: only around 20% of active funds outperform their comparable index over the long run.
These are professional fund managers. They have Bloomberg terminals, research analysts, decades of experience, sophisticated models, and proprietary data. They dedicate their professional lives to outperforming the market. And over long periods, 80–95% of them fail to do so after fees. Barron’s put the drag at approximately 2.5% per year over 10-year periods on average. The implication for individual prediction market traders — who typically have less information, less experience, and are competing against institutions and sophisticated arbitrageurs on both sides of every contract — is sobering.
The SPIVA failure rates are not an argument that everyone is incompetent. They are an argument that the market is highly efficient and that the cost of trying to beat it (in time, fees, research, and errors) typically exceeds the benefit. The same argument applies to prediction markets: for every person who correctly identifies a mispriced contract and profits, there is a counterparty who had the opposite view and lost. The market is zero-sum before fees. Only sustained, verifiable edge produces reliable long-term profit. Sources: SPIVA year-end 2023; Morningstar Active/Passive Barometer; Barron's. Not investment advice.
The Survivorship Bias Trap: Why You Only See the Winners
The most seductive thing about prediction market success stories is that they are, by definition, stories told by people who won. Nobody makes a viral post about losing 100% of their stake on a political prediction that seemed like a certainty. Nobody writes a thread about the 12 consecutive weekly S&P 500 directional bets that all went wrong. The social media ecosystem around prediction markets is a highlight reel, not a track record.Kill-the-newsletter.com, citing industry analysis of Kalshi and Polymarket, notes explicitly: ‘Kalshi and Polymarket have millions of users, but only a tiny percentage make it big.’ This is survivorship bias operating at its starkest. The platforms’ growth is driven by volume — millions of contracts, billions of dollars of stakes — not by the average user profiting. In a zero-sum market where the platforms take fees on every contract, the average user’s expected return is not zero but negative.
Survivorship bias also distorts the apparent accuracy of successful prediction market traders. If 1,000 people each bet on a coin flip and the 500 winners bet again, 250 of them will have ‘won twice in a row.’ They did not demonstrate skill; they demonstrated that in a population of 1,000 initial bettors, approximately 250 will win two consecutive 50/50 bets by chance. Applied to prediction markets: the people who appear consistently successful may include a significant proportion who have been lucky rather than skilled, and distinguishing the two requires far more data and far longer track records than most participants have accumulated.
Prediction Markets: What the Calibration Data Actually Shows
The Brier score data from Keyrock’s March 2026 analysis is genuinely impressive and should be acknowledged honestly. Both Kalshi and Polymarket achieve average Brier scores near 0.09 across thousands of resolved contracts, which represents strong forecasting calibration. Kalshi’s distribution is tighter (most markets well below 0.10, reflecting CFTC-certified standardised contract design), while Polymarket’s is broader due to wider market variety. Critically: higher traded volume consistently correlates with lower Brier scores on both platforms, and Kalshi’s forecasting error approaches near zero in the final days before resolution.This calibration data is significant for one purpose: understanding what the market is saying about the probability of an event. A Kalshi market showing 72% odds on a particular election outcome is a better calibration of the true probability than most polling models, most expert panels, and most news media commentary. This is genuinely useful, and it means prediction markets serve an important information function in society that goes beyond their entertainment or profit potential.
But strong collective calibration does not imply that individual traders profit. The market is calibrated precisely because the aggregate of all trades reflects all available information — meaning that no individual trade, on average, has positive expected value above the market’s implied probability. The contract that trades at 72 cents is correctly priced at 72 cents by the aggregate of all participants. For a specific individual to profit systematically, they need to consistently identify contracts that are mispriced relative to the true probability — and sustain that edge across many trades and over time. This is possible but difficult, and the evidence from analogous markets (stocks, sports betting) suggests that sustained, replicable edge is rare.
Who Makes Money on Prediction Markets?
The honest answer to who makes money on prediction markets is a short list. Professional arbitrageurs who trade across multiple platforms to capture price discrepancies make money. Institutional traders with genuine informational edge on specific event types — perhaps those with models that are consistently better calibrated than the market on economic data releases, or who have access to granular political polling data — make money. The platforms themselves make money on every contract through fees and the bid-ask spread. And some retail traders, through a combination of skill and luck, make money on specific runs of trades.What does not make money systematically is the activity that most retail participants engage in: picking individual contracts on political events or market direction based on intuition, news headlines, or social media sentiment. This is not informed by verifiable informational edge. It is essentially speculating against a well-calibrated market where every publicly available piece of information is already reflected in the price. The parallels with active stock-picking are exact, and the SPIVA data on what happens to active stock pickers over time is the best available evidence for what will happen to most prediction market retail traders over time.
The platforms’ growth — $24 billion in April 2026, a fivefold increase in seven months — is primarily driven by volume, not by users profiting. Volume growth benefits the platforms and reflects the growing popularity of the product. It does not mean that the average participant is generating positive returns. In most large-volume speculative markets — from foreign exchange to cryptocurrency to sports betting — the retail participation rate is high, the retail profitability rate is low, and the platform or counterparty profits from both sides of the trade.
The Tax and Friction Layer: What You Actually Keep
Any comparison of prediction market returns versus index fund returns must account for the full cost of each strategy, including taxes and transaction friction. Index fund investing is among the most tax-efficient strategies available. A broadly diversified index fund generates minimal taxable events, because it does not frequently buy and sell its holdings. Capital gains tax is deferred until you sell, potentially for decades. If held in a tax-sheltered account (ISA in the UK, 401(k) or IRA in the US), index fund returns accumulate entirely tax-free or tax-deferred.Prediction market contracts, by contrast, are resolved frequently — often within days or weeks. Each resolution is a taxable event. In the UK, prediction market profits are likely subject to income tax rather than capital gains tax (as they are classified as gambling or speculative trading income, though tax treatment depends on circumstances and should be confirmed with a tax adviser). The frequent realisation of gains and the high turnover of prediction market trading creates a tax friction that significantly reduces the after-tax return compared to the pre-tax return. A 54% return on a Kalshi contract may translate to a much lower after-tax gain depending on the trader’s marginal tax rate and the applicable classification.
- Platform fees: Kalshi charges fees on contracts; the bid-ask spread represents additional friction. At high trading frequency, these costs accumulate materially.
- Transaction frequency: prediction market trading, by its nature, involves frequent high-turnover positions. Each trade generates potential tax and fee friction.
- ISA/pension sheltering: UK investors can hold S&P 500 index funds entirely within a Stocks and Shares ISA (£20,000 annual allowance), sheltering all growth and income from UK tax. No equivalent tax shelter exists for prediction market trading.
- Ongoing costs of index funds: a global or US index fund from Vanguard, BlackRock, or Fidelity typically carries an ongoing charge figure (OCF) of 0.03–0.22% per year. This is the total cost of passive index fund ownership. No research time, no trading costs beyond the initial purchase, no ongoing management required.
Volatility, Sleep, and the Psychological Cost of Speculation
The comparison between index funds and prediction markets is not only quantitative. It involves a qualitative dimension that investment literature consistently underweights: the psychological cost of actively speculative strategies. Research on investor behaviour consistently shows that the experience of losses is psychologically more intense than the experience of equivalent gains — a phenomenon called loss aversion, documented extensively by Kahneman and Tversky. For prediction market participants who are staking money on binary outcomes, every resolution is either a 100% gain (on the winning fraction) or a 100% loss (on the losing stake). This is a psychologically demanding environment, particularly across multiple simultaneous positions.Index fund investing, by contrast, requires almost no active engagement. You invest, you wait, and the market does the work. The emotional challenge is different: enduring drawdown periods (the S&P 500’s worst annual return since 1926 was approximately −43%) without selling at the wrong time. But the decision frequency is minimal, the monitoring burden is low, and the successful strategy is explicit and simple: do not sell in downturns. The absence of action required is a feature, not a bug.
The psychological cost of active trading is not merely emotional. Behavioural finance research consistently shows that active traders make systematically poor timing decisions — buying high and selling low, rotating too frequently between strategies, chasing recent performance. The DALBAR annual Quantitative Analysis of Investor Behaviour consistently shows that the average equity fund investor earns significantly less than the fund itself returns, because of poor entry and exit timing. The same behavioural pitfalls apply to prediction market trading, amplified by the faster feedback loop and the all-or-nothing contract resolution.
The Case for Both: How Sophisticated Investors Use Prediction Markets
The most sophisticated investors in 2026 are not choosing between index funds and prediction markets. They are using both — for different purposes and with different portions of their capital. This is the legitimate synthesis that most ‘index funds vs prediction markets’ debates fail to reach.The core portfolio — the long-term wealth-building engine — is a diversified index fund or ETF portfolio. This runs on autopilot, compounds silently at the market rate, and requires no active management. This is the foundation that provides financial security and retirement wealth. No prediction market position, however successful, should be allowed to threaten this foundation.
A discretionary allocation — money that can be entirely lost without affecting lifestyle or retirement security — can be used for prediction market trading by those who have genuine interest in developing edge in this domain. The practical rule used by experienced speculative traders is the ‘1-5% rule’: no more than 1–5% of total investable assets in any speculative activity, including prediction market trading. At this allocation level, even a complete loss of the prediction market portfolio does not materially affect long-term financial outcomes. And if genuine edge is developed and profits are generated, they can be reinvested into the core index portfolio.
The two-bucket approach: Bucket 1 (90-99% of investable assets): Stocks and Shares ISA or pension-sheltered global/US index fund. Low-cost, tax-efficient, automated. This is your retirement and long-term wealth engine. Bucket 2 (1-10% maximum of investable assets): discretionary speculation account. Can include prediction market trading, individual stock picks, or other speculative strategies. Rules: (a) you must be prepared to lose it all; (b) profits are periodically transferred to Bucket 1; (c) losses never exceed the original allocation. This structure captures the entertainment and potential upside of speculation while protecting the long-term wealth engine. Not financial advice. Consult a qualified IFA.
The Honest Side-by-Side Comparison
Conclusion
Prediction markets and index funds are not the same thing, and comparing them as if they were is the source of most of the confusion in this debate. Index funds are a wealth-building vehicle that captures the long-run positive expected return of the equity market through compounding. Prediction markets are information markets where well-calibrated crowd intelligence prices the probability of discrete events, and where individual profit requires sustained edge above the market consensus. Both can be part of a sophisticated financial life. But they serve different functions, operate on different time horizons, and have fundamentally different expected-return profiles for the average participant.The SPIVA data says that 88–95% of professional active managers underperform the index over 10–15 years. The prediction market data says that only a tiny percentage of users make it big. These are consistent findings: most people, even smart and motivated people who dedicate significant resources to outperforming the market, do not do so consistently. The index fund solves this problem not by being clever but by being humble: it simply matches the market, at minimal cost, and allows compounding to do the rest. That is its enduring advantage.
The prediction markets’ explosive growth — $24 billion in monthly volume, valuations of $15–22 billion for the leading platforms — is real and important. They aggregate information brilliantly. They provide genuine hedging and speculative tools for those with edge. And they are financially significant enough that dismissing them is not intellectually honest. But for most investors, most of the time, the answer to the question of where to put the bulk of their long-term savings remains unchanged: a low-cost, broadly diversified index fund, in a tax-sheltered account, for as long as possible. Not financial advice. Always consult a qualified IFA.
Frequently Asked Questions
Can you make more money on prediction markets than index funds?In the short term, yes — a winning prediction market contract can return 50%+ in days, which no index fund achieves in the same time period. But this comparison is misleading. A prediction market contract is a binary outcome: you either win or lose 100% of your stake. The average expected return across all participants in a well-calibrated market is approximately zero before fees, because the contract price already reflects the true probability of the outcome. For the average retail participant, long-run prediction market returns are likely to be below, not above, index fund returns. The S&P 500 has returned +15.2% per year over the past 10 years (SPY, dividends reinvested, to August 2026; ChartRow). Prediction markets offer no comparable long-run average return data because the platforms are too new and survivorship bias dominates the visible statistics. Only a 'tiny percentage' of prediction market users 'make it big' (kill-the-newsletter.com). Not investment advice.
Are prediction markets like Kalshi safe to use?
Kalshi is regulated by the CFTC (Commodity Futures Trading Commission) in the United States, having reached a formal compliance agreement that distinguishes it from unregulated competitors. This regulatory status provides some protection: CFTC oversight means standardised contract design, capital requirements for the platform, and some recourse for users. Polymarket is banned from US users due to CFTC regulatory issues and operates via blockchain (Polygon PoS) without the same framework. Neither platform has FSCS-equivalent protection for UK users in the way that FCA-regulated investment products do. Capital invested in prediction market contracts can be entirely lost on any individual contract by design (binary resolution). Prediction market trading is speculative. Not financial advice — consult a qualified adviser before participating. Sources: pm.wiki/kalshi-vs-polymarket; founders-daily-briefing.beehiiv.com.
What is the S&P 500 index fund's average annual return?
The S&P 500 has returned approximately 10% per year on average since 1926, including dividends (Hartford Funds; Dimensional Fund Advisors; Morningstar). More recently, the 10-year annualised total return (SPY, dividends reinvested) to August 25, 2026 was +15.2% per year (+312.7% cumulative). The 20-year annualised return was +11.3% (+747.5% cumulative). Since SPY's inception in 1993 to August 2026, the return is +10.6% annualised (+2,869.8% cumulative). The S&P 500 returned +16.4% in 2025 and +12.9% year-to-date by August 2026. Annual returns have ranged from approximately -43% (worst) to +54% (best) since 1926. Only 6 of 99 years have been within 2 percentage points of the long-run average. Source: ChartRow.com; Dimensional; Hartford Funds. Past performance does not predict future results. Not investment advice.
Why do most active managers fail to beat index funds?
The SPIVA (S&P Indices Versus Active) year-end 2023 report found that over 10 years, 88.08% of large-cap active funds, 90.07% of mid-cap active funds, and 94.39% of small-cap active funds underperformed their S&P benchmarks. Over 15 years, these figures reach 92-96%. Morningstar's Active/Passive Barometer puts only ~20% of active funds as long-run outperformers. The primary reasons: fees (active funds charge 0.5-1.5% or more per year vs 0.03-0.22% for index funds); the efficiency of markets (all publicly available information is quickly priced in); and the zero-sum nature of active management (every outperformer needs an underperformer on the other side of the trade). The same logic applies to individual prediction market traders. Sources: SPIVA 2023; Morningstar Active/Passive Barometer; Barron's. Not investment advice.
Should I put any money in prediction markets?
This depends entirely on your financial situation, your risk tolerance, and whether you have genuine, verifiable informational edge on specific types of events. For the vast majority of people building long-term wealth, the foundation should be a tax-sheltered (ISA or pension), low-cost, diversified index fund portfolio. This captures the market's positive long-run return at minimal cost, with no skill required. Any participation in prediction markets should be limited to a small discretionary allocation — typically 1-5% of total investable assets — that you are genuinely prepared to lose entirely. If you have a specific informational edge (sophisticated political modelling, domain expertise in economic data, arbitrage tools across platforms), prediction markets may offer positive expected return on that edge. Without verifiable edge, the expected long-run return is approximately zero before fees. Not financial or investment advice. Consult a qualified IFA before making investment decisions.

0 Comments Comments