

Investing
Buy and Hold vs Market Timing Strategy: The Cost of Missing Best Days

The S&P 500 returned +17.88% in 2025. Miss just the single best day of the year — April 9, 2025 — and your return collapsed to +7.64%. Miss the four best days, and your return turned negative. The best day of 2025 arrived the moment after the worst stretch of the year, when panic was at its peak and the temptation to move to cash was highest. Over 30 years (1995–2025), staying fully invested produced an 8.45% annualised return. Missing just the 50 best days turned that into a -0.65% annual loss. This is the case for buy and hold. But the bear case is equally real: if you could somehow avoid the 30 worst days, you’d have made a fortune. The question is whether that’s achievable. This article shows you the data from both sides — and lets you decide. Not financial advice.
The evidence this article draws on comes from Hartford Funds (DataTrek Research and Morningstar, January 2026), Wells Fargo Investment Institute (‘Perils of Timing Volatile Markets,’ 2025), AllianceBernstein (July 2025), Masterworks Academy (June 2026), and Landmark Wealth Management (citing Ned Davis Research). All use the same underlying framework: calculate the annualised return of a fully invested S&P 500 portfolio over various time periods, then recalculate what happens if you remove the N best days. The results are consistent across every time period studied, every institutional analyst that has run them, and every market cycle from 1995 to 2026.
This article presents both sides of the argument: the overwhelming case for staying invested and the legitimate bear case for managing risk during extreme conditions. The conclusion is not a simple endorsement of doing nothing — it is a frank assessment of what the data says is achievable for the real investor. Not financial advice.
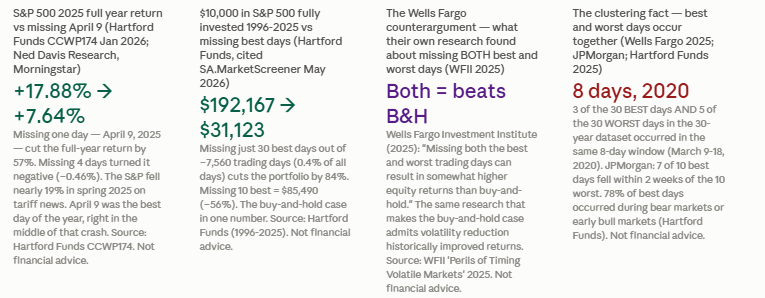
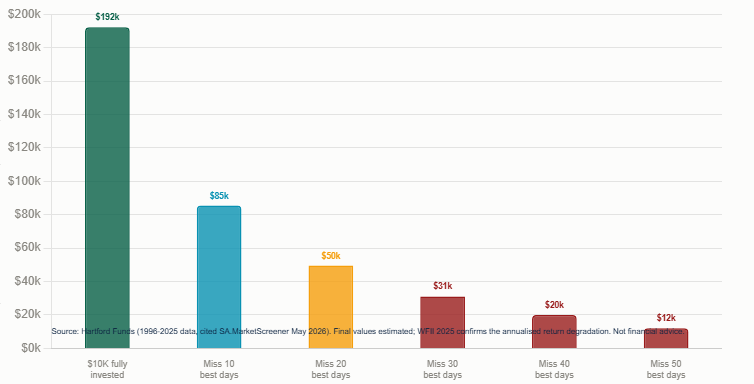
S&P 500 full-year 2025: +17.88%. Miss the 1 best day: +7.64%. Miss 2: +4.23%. Miss 3: +1.67%. Miss 4: NEGATIVE -0.46%. H1 2025: +6.2% fully invested; missing 5 best days in H1: -12.1% LOSS. MSCI EAFE H1 2025: +19.4% fully invested; missing 5 best: +2.0%. 30 years (1995-2025): 8.45% annualised fully invested; 5.56% missing 10 best; -0.65% missing 50 best. Sources: Hartford Funds/Morningstar January 2026; AllianceBernstein July 2025; Wells Fargo Investment Institute 2025/Masterworks June 2026.
.
Hartford Funds’ 2026 whitepaper (CCWP174, citing DataTrek Research and Morningstar, January 2026) identifies the best single day of the 2025 year: April 9, 2025. This was not an arbitrary calm Tuesday. April 9, 2025 was the trading day immediately after the tariff-driven market crash reached its worst point. The investor who had moved to cash during the crash — watching their portfolio fall and deciding that further losses needed to be prevented — missed the best single day of the entire year.
The arithmetic is stark. According to analysis by Landmark Wealth Management citing Ned Davis Research, Morningstar, and Hartford Funds: missing that single day cut the full-year return from +17.88% to +7.64% — a 57% decrease in total returns from one day. Missing the two best days: +4.23% — a 76% decrease. Missing the three best days: +1.67% — a 91% decrease. Missing the four best days: -0.46% — the investor who sat out the four best trading days of 2025 lost money in a year the market was up nearly 18%. Not financial advice.
The 2025 lesson: the best single day of the year (April 9, 2025) arrived immediately after the worst period of the year (the tariff-driven -19% crash in April). The investor most likely to have missed April 9 was the one who fled during the -19% decline -- exactly when fear was at its peak and the instinct to preserve capital was strongest. The year's best return and the year's worst stretch were almost precisely adjacent. This is not a coincidence; it is the structural pattern that makes market timing so difficult. Source: Hartford Funds CCWP174, 2026; Landmark Wealth/Ned Davis Research/Morningstar. Past performance does not predict future results. Not financial advice.
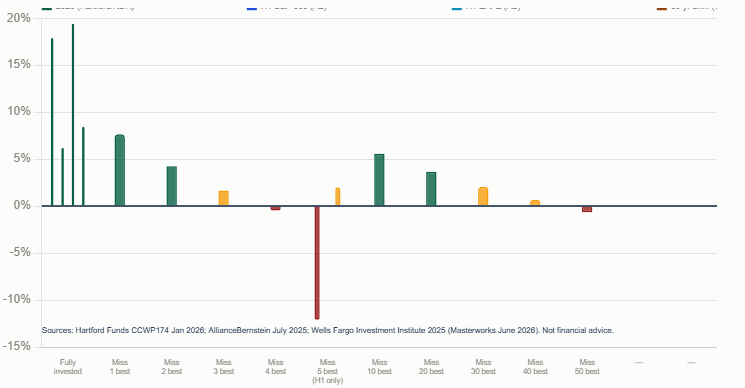
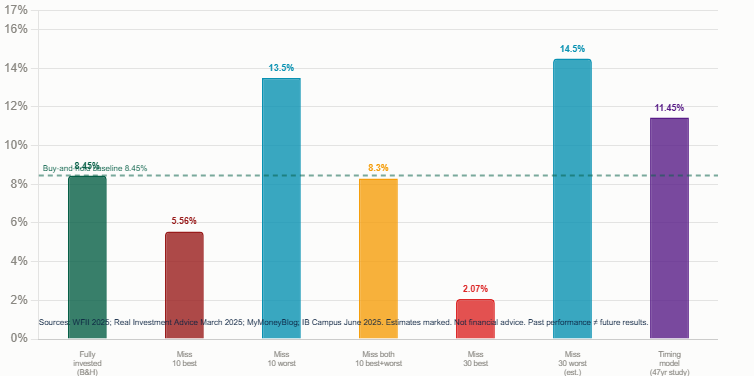
The scenario analysis removes the best days one tranche at a time. Missing the 10 best days over 30 years reduces the annualised return from 8.45% to 5.56% — a reduction of 2.89 percentage points per year. Compounded over 30 years, the difference between 8.45% and 5.56% on $100,000 is approximately $700,000 in terminal portfolio value. Missing the 20 best days reduces the return to 3.66%. Missing the 30 best days: 2.07%. Missing the 40 best days: 0.66%. Missing the 50 best days: -0.65% per year — a negative annualised return over 30 years, in one of the great bull market runs in history.
The 50 best days out of approximately 7,560 trading days across 30 years is less than 0.66% of all trading days. An investor who was out of the market for less than 1% of the available trading days — but happened to be out on the 50 most explosive days — would have lost money in nominal terms over three decades. This is why Masterworks (June 2026) concludes: ‘Time in the market beats timing the market because compounding rewards presence, and the best days cannot be scheduled.’ Not financial advice.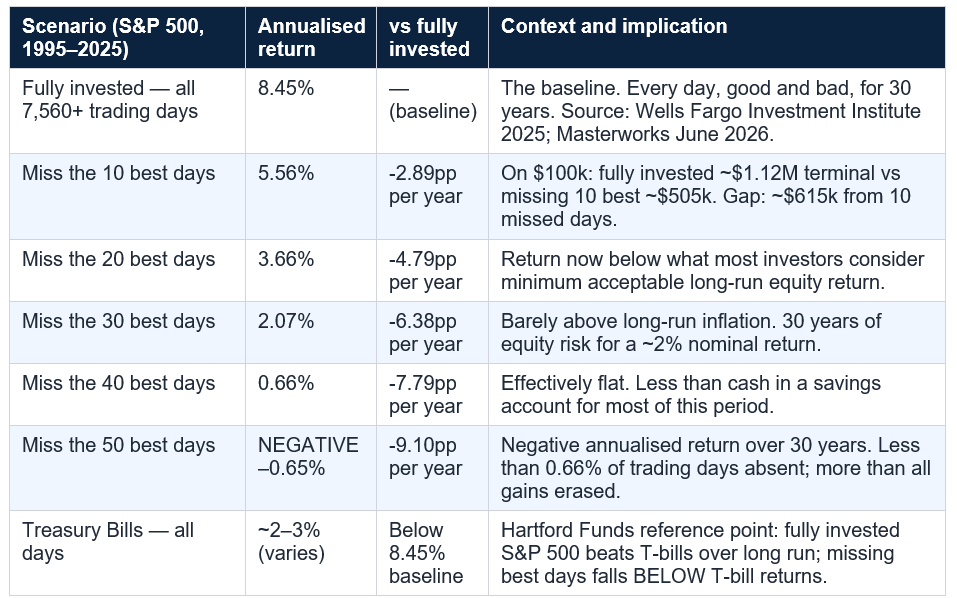
Masterworks (June 2026) quantifies this precisely for the 30 best and 30 worst days in the S&P 500 over 30 years: three of the 30 best days and five of the 30 worst days fell inside the same eight trading days of March 2020 — the COVID crash and recovery period. Seven of the 10 best days over the past 20 years occurred within two weeks of the 10 worst days (a finding consistent with long-running Hartford Funds analysis). The April 2025 tariff sequence is the most recent confirmation: the worst single-day declines of the year (April 3–4) and the best single day of the year (April 9) were separated by fewer than five trading days.
AllianceBernstein (July 2025) makes the investor behaviour point explicit: ‘Panic selling not only locks in losses, but also puts investors at risk for missing the market’s best days.’ The investor who acted rationally in response to the worst days — fleeing to safety to prevent further losses — was also the investor who missed the recovery. Not financial advice.
Historical clustering of best and worst days: March 2020 (COVID crash): 3 of 30 all-time best S&P 500 days AND 5 of 30 all-time worst S&P 500 days fell within the same 8 trading days. April 2025 (tariff crash): worst single-day declines (April 3-4) and best single day of 2025 (April 9) within 5 trading days. 2008-2009 (financial crisis): similarly extreme clustering of best and worst days. October 1987 (Black Monday crash and recovery). The pattern is not coincidence -- it is structural: the same extreme market conditions (uncertainty, fear, forced selling) that create sharp crashes also create the sharp reversals. Source: Masterworks June 2026; Hartford Funds CCWP174 2026. Not financial advice.
April 9, 2025: the Trump administration announced a 90-day pause on the reciprocal tariffs for most countries. The S&P 500 surged — posting the largest single-day gain of the entire year. Hartford Funds (2026 whitepaper) explicitly identifies this as the year’s best single day: ‘The best single day of the entire year happened on April 9, right in the middle of all that volatility. Missing just that one day would have slashed your full-year return by more than half.’
The investor profile most likely to have missed April 9 is precisely the investor who had been doing the most prudent-seeming thing: cutting equity exposure during the -19% decline. Every news headline between early April 1 and April 8 was bearish. The rational, news-following investor who had reduced risk exposure on the basis of deteriorating fundamentals and escalating trade war headlines was the one sitting in cash when April 9 arrived. The investor who had done ‘nothing’ — the passive holder, the buy-and-hold investor who had ignored the headlines — captured the full return. Not financial advice.
April 9, 2025 in numbers: fully invested full-year return +17.88%. Missing ONLY April 9 (the best day): full-year return +7.64% -- more than halved. The tariff announcement (April 2-4) was followed by the tariff pause (April 9). The investor who fled DURING the crash arrived AFTER the recovery. This is the buy-and-hold case in one year: the single most important day was unscheduled, unexpected, and arrived when fear was at maximum. Source: Hartford Funds CCWP174 2026; Landmark Wealth Management/Ned Davis Research/Morningstar. Not financial advice.
The key Hartford data point: investors who were out of the market for the 40 or 50 best days over the 20-year period ended up below what they would have earned simply holding Treasury Bills. An investor who accepted the full volatility of equity market ownership — the bear markets of 2000–2002, 2008–2009, 2020, and 2022 — but stayed invested for all days including the explosive recovery rallies, received the long-run equity premium over bonds and cash. An investor who reduced their equity exposure in the worst moments missed those rallies and fell below the risk-free rate.
Hartford’s 2025 analysis also provides the H1 2025 specific data: ‘For the S&P 500, missing the five best days in the first half of 2025 translated to a 12.1% loss compared with a 6.2% gain for the full period.’ The swing: 18.3 percentage points from five days out of approximately 126 trading days. The same analysis for international stocks (MSCI EAFE): missing the five best days in H1 2025 turned a 19.4% gain into a 2.0% gain — a 17.4 percentage point loss of return (AllianceBernstein, July 16, 2025). Not financial advice.
This is arithmetically true and theoretically elegant. If you could consistently avoid the worst market days, your returns would substantially exceed buy-and-hold. The question is the operative word: ‘if you could.’ The evidence from institutional fund managers — who have every informational advantage over retail investors, including dedicated research teams, proprietary models, and real-time market data — shows that only approximately 21% of active funds beat their passive benchmark over 10 years (Morningstar Active/Passive Barometer, 2025). If professional fund managers with every available tool cannot consistently time the market, the case for an individual retail investor doing so with greater consistency is fragile.
Real Investment Advice acknowledges this explicitly: ‘The problem with market timing is consistency.’ The investor who successfully moves to cash before April 3, 2025 and back into stocks before April 9, 2025 has executed a perfect trade. But to profit consistently from market timing requires executing this correctly dozens of times over a lifetime of investing. The research on investor behaviour consistently shows that human decision-making under conditions of financial fear is unreliable, emotion-driven, and systematically biased toward exactly the wrong timing. Not financial advice.
The worst-days avoidance calculation (theoretical): avoiding the S&P 500's 10 worst days over a 30-year period would have substantially increased portfolio returns above the 8.45% fully-invested annualized return. The arithmetic is real. The problem: the 10 worst days and the 10 best days cluster together. The investor who exits to avoid the worst days is likely to also miss the best days. Over 40 years, avoiding the worst 10 days produces gains; but the same avoidance strategy also misses some of the best days. The net result of imperfect market timing (which is the only kind that exists in practice) is typically worse than buy-and-hold. Source: Real Investment Advice; Masterworks June 2026. Not financial advice.
The structural reason for the consistency failure is the clustering of best and worst days. An investor attempting to avoid the worst days is not making a single clean binary decision. They must decide to exit before the crash and re-enter before the recovery. Both decisions must be correct. In April 2025, an investor would have had to be out of the market before April 3 AND back in the market before April 9, both within a five-day window, while news sentiment was catastrophically negative throughout. The investor who got the exit right (selling before the crash) but delayed re-entry missed the best day. The investor who waited for ‘more certainty’ before returning missed the entire recovery.
This is why Masterworks (June 2026) frames the issue as structural rather than behavioural: ‘Market timing fails because the market’s largest single-day gains arrive without warning, cluster right next to its worst days, and tend to land near the bottom of a decline, exactly when a timer has gone to cash.’ The conditions under which the best days arrive — peak fear, maximum uncertainty, consensus bearishness — are precisely the conditions under which market timers are most likely to be in cash. Not financial advice.
Carl Richards, who coined the term ‘behavior gap,’ captured the dynamic precisely: investors earn less than the investments they own because they make emotional decisions at exactly the wrong moments. The best available institutional-level data — Morningstar’s Active/Passive Barometer (Year-End 2025), showing only 38% of active funds beat passive in 2025 and only 21% over 10 years — reflects the failure of professional market timing at the fund management level. If institutional managers with Bloomberg terminals, PhDs in quantitative finance, and teams of analysts cannot consistently time markets, the evidence for individual retail investors succeeding consistently is thin.
AllianceBernstein (July 2025) identified the emotional sequence in the 2025 tariff crash: ‘Two big sell-offs in early 2025 reminded us why it’s important to fight those responses and stay invested through downturns.’ The ‘responses’ they are urging investors to fight are the natural human responses to financial loss: fear, the desire to prevent further pain, the conviction that ‘this time is different.’ Not financial advice.
Landmark Wealth Management: ‘Dollar-cost averaging and a long-term buy-and-hold approach protect you from the regret of missing those critical days. The cost of being wrong about when to exit is far higher than most people realise.’ DCA has an important psychological advantage over lump-sum buy-and-hold for investors who are building a portfolio over time: it removes the pressure of deciding when to invest. The monthly contribution goes in on the 1st regardless of whether the market has fallen 10% or risen 10%. This automation prevents the two most damaging investor behaviours — waiting for the ‘right time’ to invest (and missing the recovery) and panic-selling at the bottom.
DCA does not solve the core challenge of being present for the best days — because it keeps the investor continuously invested, it ensures they are present for all days. The DCA investor who set up a monthly contribution in January 2025 was buying at the tariff-crash lows in April 2025 and was fully invested when April 9 arrived. This is the practical and psychologically sustainable implementation of the buy-and-hold principle for the regular investor. Not financial advice.
There is also a legitimate distinction between passive holding and active neglect. A buy-and-hold investor still needs to: maintain appropriate asset allocation for their age and risk tolerance (shifting from equities to bonds as retirement approaches); ensure geographic diversification beyond a single country index; rebalance periodically when one asset class grows disproportionately large; and avoid concentration in single stocks or sectors. ‘Buy and hold’ as a philosophy does not mean ‘buy and ignore’ — it means making deliberate, long-term allocation decisions and not reversing them in response to short-term market noise.
The data also does not tell us what the next 30 years will look like. The 1995–2025 period included the dot-com bull market, the dot-com crash, the 2008 financial crisis, and the extraordinary 2010–2021 bull market. A different 30-year period might have produced different numbers. Not financial advice.
The evidence also supports: the bear case is real in theory but essentially unachievable in practice. Avoiding the worst days would be hugely profitable. But the best and worst days cluster together, and the conditions that create the worst days are the same conditions that create the best days — meaning the investor trying to avoid one will almost certainly miss the other. Not financial advice.
The practical implication: for most individual investors, a long-term, continuously invested position in a broadly diversified index fund (S&P 500, global all-world, or equivalent) implemented through regular contributions (dollar-cost averaging) is the strategy most consistent with the empirical evidence. It does not require predicting the best days — it simply requires being present for them. Not financial advice. Consult a qualified financial adviser for personalised guidance.
Over 30 years, only 50 days out of more than 7,500 contain the difference between a positive and a negative total return. Less than 1% of trading days. Those 50 days cannot be scheduled, predicted, or isolated from the days around them. The only reliable way to be present for them is to be present for all days — the +5% rallies and the -9% crashes; the ordinary Tuesdays and the extraordinary Aprils.
Buy and hold, implemented through a low-cost diversified index fund and sustained through market cycles, is the strategy most consistent with the available evidence. Not because markets always go up, not because it avoids all losses, and not because it produces the theoretical maximum return. But because it is the strategy that ensures you are present for the days that cannot be predicted and that contain most of the market’s long-run returns. Not financial advice. Consult a qualified financial adviser.
Based on actual 2025 data (Hartford Funds, Morningstar, Ned Davis Research): missing the single best day of 2025 (April 9) cut the S&P 500's full-year return from +17.88% to +7.64% -- a 57% decrease. Missing the two best days: +4.23% (-76%). Missing three: +1.67% (-91%). Missing four: -0.46% (you lost money in a year the market was up 18%). Over 30 years (1995-2025, Wells Fargo Investment Institute 2025): fully invested 8.45% annualised; missing 10 best: 5.56%; missing 50 best: -0.65% (negative return). For H1 2025 (AllianceBernstein July 2025): missing the five best days turned a +6.2% gain into a -12.1% loss. Past performance does not predict future results. Not financial advice.
Why do the market's best days happen right after the worst days?
The clustering of best and worst days is structural, not coincidental. The same market conditions that create extreme volatility -- heightened uncertainty, forced selling by leveraged investors, panic by retail investors -- also create the conditions for sudden sharp reversals. Policy announcements (like the April 9, 2025 tariff pause), central bank interventions, or simply the exhaustion of selling pressure tend to arrive at the market's worst moments. Masterworks (June 2026): 'The best days hide next to the worst. Three of the 30 best days and five of the 30 worst days fell inside the same eight trading days of March 2020.' Seven of the 10 best days in the last 20 years occurred within two weeks of the 10 worst days. The implication: an investor who exits to avoid the worst days is very likely to miss the best days that follow immediately after.
Is buy and hold always the best strategy?
Buy-and-hold in a diversified index fund has the strongest empirical support for the majority of individual investors over long time horizons. However, it has genuine limitations: (1) It works best in long-term rising markets (e.g. the S&P 500's 30-year run). A buy-and-hold investor in Japanese equities in 1989 waited decades to recover. (2) It does not mean 'ignore the portfolio' -- appropriate rebalancing and age-based asset allocation shifts are part of a sound long-term strategy. (3) The 30-year data is backward-looking. It reflects the specific performance of the US equity market from 1995-2025 and cannot be guaranteed to repeat. (4) The bear case is valid in theory: avoiding the worst days would produce higher returns than buy-and-hold. The problem is that it is unachievable consistently in practice because the best and worst days cluster together. Real Investment Advice: 'Buy and hold works great in a long-term rising bull market.' Not financial advice.
What is dollar-cost averaging and is it better than a lump sum?
Dollar-cost averaging (DCA) means investing a fixed amount at regular intervals -- monthly, bi-weekly -- regardless of what the market is doing. During declines, the fixed contribution buys more shares (lower price). During rallies, it buys fewer (higher price). Over time, the average purchase price is lower than the average market price across the same period. The academic debate between DCA and lump-sum investing (deploying all available capital immediately) consistently finds that lump-sum investing outperforms DCA in the long run, because markets rise over time and lump-sum exposure starts earning returns sooner. However, for investors building wealth from regular income (most people), DCA is not a choice: it is the natural structure of their investing (monthly contributions from salary). In practice, DCA also removes the psychological pressure of timing large investments and prevents panic-selling because the next contribution arrives regardless. Landmark Wealth Management: 'Dollar-cost averaging and a long-term buy-and-hold approach protect you from the regret of missing those critical days.' Not financial advice.
Can any investor consistently time the market?
The evidence from institutional data is consistently negative. Morningstar's Active/Passive Barometer (Year-End 2025): only 38% of active fund managers beat their passive benchmark in 2025; only ~21% did so over 10 years. Fund managers with Bloomberg terminals, PhD-level quantitative analysts, and real-time market data fail to consistently time markets -- the only form of market timing that matters is consistent timing, not one or two successful calls. Real Investment Advice acknowledges the theoretical benefit ('missing the 10 worst days would have an even bigger positive impact') while noting: 'The problem with market timing is consistency.' The investor who successfully exits before one crash typically becomes overconfident and makes a costly error in the next cycle. The structural reason: the best days and worst days cluster together, making it impossible to reliably avoid one while capturing the other. Not financial advice.
Table of Contents
- The Central Question: Can Anyone Reliably Time the Market?
- The 2025 Data: One Year That Proved the Point
- The 30-Year Data: What Staying Invested vs Timing Has Actually Produced
- The Critical Insight: Best Days and Worst Days Are Neighbours
- The April 2025 Case Study: How One Day Made or Broke the Year
- The 30-Year Return Table: What Each Missing-Day Scenario Produces
- The Bear Case: What If You Could Avoid the Worst Days?
- The Real Problem with Market Timing: The Consistency Trap
- What Actually Happens When Investors Try to Time the Market?
- The Practical Alternative: Dollar-Cost Averaging
- When Buy and Hold Has Genuine Limitations
- The Verdict: What the Evidence Actually Supports
- Conclusion: Be Present for the Days You Cannot Predict
- Frequently Asked Questions
The cost of missing best days — 2025, H1 2025, and 30 years
The $10,000 test — what Hartford's data shows over 30 years
The counterargument — missing worst days and symmetry
The Central Question: Can Anyone Reliably Time the Market?
Market timing is the idea of moving to cash (or other safe assets) before the market falls and returning to stocks before it rises again. The appeal is obvious: if you could reliably do this, you would capture all the upside and none of the downside. The data question is equally obvious: can you? The answer from decades of performance data, academic research, and fund manager track records is almost uniformly negative. Not because markets are entirely random, but because the specific days that contain most of a year’s total return are unpredictable, concentrated, and tend to arrive in the worst of times.The evidence this article draws on comes from Hartford Funds (DataTrek Research and Morningstar, January 2026), Wells Fargo Investment Institute (‘Perils of Timing Volatile Markets,’ 2025), AllianceBernstein (July 2025), Masterworks Academy (June 2026), and Landmark Wealth Management (citing Ned Davis Research). All use the same underlying framework: calculate the annualised return of a fully invested S&P 500 portfolio over various time periods, then recalculate what happens if you remove the N best days. The results are consistent across every time period studied, every institutional analyst that has run them, and every market cycle from 1995 to 2026.
This article presents both sides of the argument: the overwhelming case for staying invested and the legitimate bear case for managing risk during extreme conditions. The conclusion is not a simple endorsement of doing nothing — it is a frank assessment of what the data says is achievable for the real investor. Not financial advice.
S&P 500 full-year 2025: +17.88%. Miss the 1 best day: +7.64%. Miss 2: +4.23%. Miss 3: +1.67%. Miss 4: NEGATIVE -0.46%. H1 2025: +6.2% fully invested; missing 5 best days in H1: -12.1% LOSS. MSCI EAFE H1 2025: +19.4% fully invested; missing 5 best: +2.0%. 30 years (1995-2025): 8.45% annualised fully invested; 5.56% missing 10 best; -0.65% missing 50 best. Sources: Hartford Funds/Morningstar January 2026; AllianceBernstein July 2025; Wells Fargo Investment Institute 2025/Masterworks June 2026.
.
The 2025 Data: One Year That Proved the Point
The year 2025 was unusually good at illustrating the core argument for staying invested — partly because it contained within it both a severe market panic and a historic recovery, compressed into a few weeks. The S&P 500 finished the year at +17.88%. To get that return, an investor had to be present for the full year, including the period in early April when the index fell nearly 19% following President Trump’s tariff announcement.Hartford Funds’ 2026 whitepaper (CCWP174, citing DataTrek Research and Morningstar, January 2026) identifies the best single day of the 2025 year: April 9, 2025. This was not an arbitrary calm Tuesday. April 9, 2025 was the trading day immediately after the tariff-driven market crash reached its worst point. The investor who had moved to cash during the crash — watching their portfolio fall and deciding that further losses needed to be prevented — missed the best single day of the entire year.
The arithmetic is stark. According to analysis by Landmark Wealth Management citing Ned Davis Research, Morningstar, and Hartford Funds: missing that single day cut the full-year return from +17.88% to +7.64% — a 57% decrease in total returns from one day. Missing the two best days: +4.23% — a 76% decrease. Missing the three best days: +1.67% — a 91% decrease. Missing the four best days: -0.46% — the investor who sat out the four best trading days of 2025 lost money in a year the market was up nearly 18%. Not financial advice.
The 2025 lesson: the best single day of the year (April 9, 2025) arrived immediately after the worst period of the year (the tariff-driven -19% crash in April). The investor most likely to have missed April 9 was the one who fled during the -19% decline -- exactly when fear was at its peak and the instinct to preserve capital was strongest. The year's best return and the year's worst stretch were almost precisely adjacent. This is not a coincidence; it is the structural pattern that makes market timing so difficult. Source: Hartford Funds CCWP174, 2026; Landmark Wealth/Ned Davis Research/Morningstar. Past performance does not predict future results. Not financial advice.
The 30-Year Data: What Staying Invested vs Timing Has Actually Produced
The 2025 data is dramatic but it is one year. The 30-year data from Wells Fargo Investment Institute (‘Perils of Timing Volatile Markets,’ 2025), subsequently summarised and cited by Masterworks Academy (June 2026), tells the same story across an entire investing career. Over the 30 years from 1995 to 2025, the S&P 500 delivered an annualised return of 8.45% for a fully invested investor who experienced every up day and every down day.The scenario analysis removes the best days one tranche at a time. Missing the 10 best days over 30 years reduces the annualised return from 8.45% to 5.56% — a reduction of 2.89 percentage points per year. Compounded over 30 years, the difference between 8.45% and 5.56% on $100,000 is approximately $700,000 in terminal portfolio value. Missing the 20 best days reduces the return to 3.66%. Missing the 30 best days: 2.07%. Missing the 40 best days: 0.66%. Missing the 50 best days: -0.65% per year — a negative annualised return over 30 years, in one of the great bull market runs in history.
The 50 best days out of approximately 7,560 trading days across 30 years is less than 0.66% of all trading days. An investor who was out of the market for less than 1% of the available trading days — but happened to be out on the 50 most explosive days — would have lost money in nominal terms over three decades. This is why Masterworks (June 2026) concludes: ‘Time in the market beats timing the market because compounding rewards presence, and the best days cannot be scheduled.’ Not financial advice.
The 30-Year Return Table: What Each Scenario Produces
The Critical Insight: Best Days and Worst Days Are Neighbours
The single most important structural fact in the buy-and-hold vs timing debate is this: the best days and the worst days do not occur at different points in the market cycle. They occur next to each other. An investor trying to avoid the worst days by moving to cash is almost certainly going to miss the best days at the same time — because the same market events that create the worst days also create the best ones.Masterworks (June 2026) quantifies this precisely for the 30 best and 30 worst days in the S&P 500 over 30 years: three of the 30 best days and five of the 30 worst days fell inside the same eight trading days of March 2020 — the COVID crash and recovery period. Seven of the 10 best days over the past 20 years occurred within two weeks of the 10 worst days (a finding consistent with long-running Hartford Funds analysis). The April 2025 tariff sequence is the most recent confirmation: the worst single-day declines of the year (April 3–4) and the best single day of the year (April 9) were separated by fewer than five trading days.
AllianceBernstein (July 2025) makes the investor behaviour point explicit: ‘Panic selling not only locks in losses, but also puts investors at risk for missing the market’s best days.’ The investor who acted rationally in response to the worst days — fleeing to safety to prevent further losses — was also the investor who missed the recovery. Not financial advice.
Historical clustering of best and worst days: March 2020 (COVID crash): 3 of 30 all-time best S&P 500 days AND 5 of 30 all-time worst S&P 500 days fell within the same 8 trading days. April 2025 (tariff crash): worst single-day declines (April 3-4) and best single day of 2025 (April 9) within 5 trading days. 2008-2009 (financial crisis): similarly extreme clustering of best and worst days. October 1987 (Black Monday crash and recovery). The pattern is not coincidence -- it is structural: the same extreme market conditions (uncertainty, fear, forced selling) that create sharp crashes also create the sharp reversals. Source: Masterworks June 2026; Hartford Funds CCWP174 2026. Not financial advice.
The April 2025 Case Study: How One Day Made or Broke the Year
The April 2025 tariff sequence is the clearest real-world illustration of the best-days/worst-days clustering principle in recent history. President Trump announced a new tariff policy on April 2–3, 2025. Markets reacted sharply: the S&P 500 fell approximately 9.5% on April 3–4 in one of the largest two-day point declines in years. This extended a broader decline that had taken the index down nearly 19% from its January 2025 high.April 9, 2025: the Trump administration announced a 90-day pause on the reciprocal tariffs for most countries. The S&P 500 surged — posting the largest single-day gain of the entire year. Hartford Funds (2026 whitepaper) explicitly identifies this as the year’s best single day: ‘The best single day of the entire year happened on April 9, right in the middle of all that volatility. Missing just that one day would have slashed your full-year return by more than half.’
The investor profile most likely to have missed April 9 is precisely the investor who had been doing the most prudent-seeming thing: cutting equity exposure during the -19% decline. Every news headline between early April 1 and April 8 was bearish. The rational, news-following investor who had reduced risk exposure on the basis of deteriorating fundamentals and escalating trade war headlines was the one sitting in cash when April 9 arrived. The investor who had done ‘nothing’ — the passive holder, the buy-and-hold investor who had ignored the headlines — captured the full return. Not financial advice.
April 9, 2025 in numbers: fully invested full-year return +17.88%. Missing ONLY April 9 (the best day): full-year return +7.64% -- more than halved. The tariff announcement (April 2-4) was followed by the tariff pause (April 9). The investor who fled DURING the crash arrived AFTER the recovery. This is the buy-and-hold case in one year: the single most important day was unscheduled, unexpected, and arrived when fear was at maximum. Source: Hartford Funds CCWP174 2026; Landmark Wealth Management/Ned Davis Research/Morningstar. Not financial advice.
The 20-Year Data: Hartford Funds’ Long-Run Framework (1996–2025)
Hartford Funds’ whitepaper CCWP174 (January 2026, using DataTrek Research and Morningstar data) presents the same analysis over 20 years from 1996 to 2025. The S&P 500’s long-run average annual total return including dividends is approximately 10–11% over this period. Hartford’s analysis removes tranches of the best days and shows the progression from full-market returns down through T-bill equivalent returns and below.The key Hartford data point: investors who were out of the market for the 40 or 50 best days over the 20-year period ended up below what they would have earned simply holding Treasury Bills. An investor who accepted the full volatility of equity market ownership — the bear markets of 2000–2002, 2008–2009, 2020, and 2022 — but stayed invested for all days including the explosive recovery rallies, received the long-run equity premium over bonds and cash. An investor who reduced their equity exposure in the worst moments missed those rallies and fell below the risk-free rate.
Hartford’s 2025 analysis also provides the H1 2025 specific data: ‘For the S&P 500, missing the five best days in the first half of 2025 translated to a 12.1% loss compared with a 6.2% gain for the full period.’ The swing: 18.3 percentage points from five days out of approximately 126 trading days. The same analysis for international stocks (MSCI EAFE): missing the five best days in H1 2025 turned a 19.4% gain into a 2.0% gain — a 17.4 percentage point loss of return (AllianceBernstein, July 16, 2025). Not financial advice.
The Bear Case: What If You Could Avoid the Worst Days?
The buy-and-hold case is not the only side of this analysis. Real Investment Advice (Lance Roberts), publishing a counterpoint perspective, makes a valid observation: the same data that shows the cost of missing the best days also shows the extraordinary benefit of missing the worst days. ‘Over an investing period of about 40 years, just missing the 10-best days would have cost you about half your capital gains. But successfully avoiding the 10-worst days would have had an even bigger positive impact on your portfolio.’This is arithmetically true and theoretically elegant. If you could consistently avoid the worst market days, your returns would substantially exceed buy-and-hold. The question is the operative word: ‘if you could.’ The evidence from institutional fund managers — who have every informational advantage over retail investors, including dedicated research teams, proprietary models, and real-time market data — shows that only approximately 21% of active funds beat their passive benchmark over 10 years (Morningstar Active/Passive Barometer, 2025). If professional fund managers with every available tool cannot consistently time the market, the case for an individual retail investor doing so with greater consistency is fragile.
Real Investment Advice acknowledges this explicitly: ‘The problem with market timing is consistency.’ The investor who successfully moves to cash before April 3, 2025 and back into stocks before April 9, 2025 has executed a perfect trade. But to profit consistently from market timing requires executing this correctly dozens of times over a lifetime of investing. The research on investor behaviour consistently shows that human decision-making under conditions of financial fear is unreliable, emotion-driven, and systematically biased toward exactly the wrong timing. Not financial advice.
The worst-days avoidance calculation (theoretical): avoiding the S&P 500's 10 worst days over a 30-year period would have substantially increased portfolio returns above the 8.45% fully-invested annualized return. The arithmetic is real. The problem: the 10 worst days and the 10 best days cluster together. The investor who exits to avoid the worst days is likely to also miss the best days. Over 40 years, avoiding the worst 10 days produces gains; but the same avoidance strategy also misses some of the best days. The net result of imperfect market timing (which is the only kind that exists in practice) is typically worse than buy-and-hold. Source: Real Investment Advice; Masterworks June 2026. Not financial advice.
The Real Problem with Market Timing: The Consistency Trap
The challenge of market timing is not that it is impossible in principle. It is that it is almost impossible to execute consistently over an investing lifetime. Real Investment Advice makes this point carefully: ‘I do not strictly endorse market timing, which is specifically being all-in or all-out of the market at any given time. The problem with market timing is consistency.’ A successful timing call — moving to cash in March 2020 and returning after the COVID low — creates a cognitive trap: the investor who succeeded once now believes they can do it again, approaches the next market event with overconfidence, and is more likely to make a costly error.The structural reason for the consistency failure is the clustering of best and worst days. An investor attempting to avoid the worst days is not making a single clean binary decision. They must decide to exit before the crash and re-enter before the recovery. Both decisions must be correct. In April 2025, an investor would have had to be out of the market before April 3 AND back in the market before April 9, both within a five-day window, while news sentiment was catastrophically negative throughout. The investor who got the exit right (selling before the crash) but delayed re-entry missed the best day. The investor who waited for ‘more certainty’ before returning missed the entire recovery.
This is why Masterworks (June 2026) frames the issue as structural rather than behavioural: ‘Market timing fails because the market’s largest single-day gains arrive without warning, cluster right next to its worst days, and tend to land near the bottom of a decline, exactly when a timer has gone to cash.’ The conditions under which the best days arrive — peak fear, maximum uncertainty, consensus bearishness — are precisely the conditions under which market timers are most likely to be in cash. Not financial advice.
What Actually Happens When Investors Try to Time the Market?
The academic and practitioner evidence on what real investors actually achieve through market timing is consistently negative. DALBAR’s annual Quantitative Analysis of Investor Behavior (QAIB) consistently shows that the average equity mutual fund investor earns significantly less than the mutual funds they invest in — because investors buy and sell at the wrong times, increasing exposure after gains and reducing it after losses. The gap between investor returns (what people actually earn) and investment returns (what the fund earns) is called the ‘behavior gap.’Carl Richards, who coined the term ‘behavior gap,’ captured the dynamic precisely: investors earn less than the investments they own because they make emotional decisions at exactly the wrong moments. The best available institutional-level data — Morningstar’s Active/Passive Barometer (Year-End 2025), showing only 38% of active funds beat passive in 2025 and only 21% over 10 years — reflects the failure of professional market timing at the fund management level. If institutional managers with Bloomberg terminals, PhDs in quantitative finance, and teams of analysts cannot consistently time markets, the evidence for individual retail investors succeeding consistently is thin.
AllianceBernstein (July 2025) identified the emotional sequence in the 2025 tariff crash: ‘Two big sell-offs in early 2025 reminded us why it’s important to fight those responses and stay invested through downturns.’ The ‘responses’ they are urging investors to fight are the natural human responses to financial loss: fear, the desire to prevent further pain, the conviction that ‘this time is different.’ Not financial advice.
The Practical Alternative: Dollar-Cost Averaging
For investors who find the idea of passively holding through a -19% decline psychologically impossible, the practical alternative to both pure buy-and-hold and active market timing is dollar-cost averaging (DCA). DCA means investing a fixed amount at regular intervals — monthly, fortnightly, or with each paycheck — regardless of what the market is doing. During declines, the fixed contribution buys more shares. During rallies, it buys fewer. Over time, the average purchase price is lower than the average market price during the same period.Landmark Wealth Management: ‘Dollar-cost averaging and a long-term buy-and-hold approach protect you from the regret of missing those critical days. The cost of being wrong about when to exit is far higher than most people realise.’ DCA has an important psychological advantage over lump-sum buy-and-hold for investors who are building a portfolio over time: it removes the pressure of deciding when to invest. The monthly contribution goes in on the 1st regardless of whether the market has fallen 10% or risen 10%. This automation prevents the two most damaging investor behaviours — waiting for the ‘right time’ to invest (and missing the recovery) and panic-selling at the bottom.
DCA does not solve the core challenge of being present for the best days — because it keeps the investor continuously invested, it ensures they are present for all days. The DCA investor who set up a monthly contribution in January 2025 was buying at the tariff-crash lows in April 2025 and was fully invested when April 9 arrived. This is the practical and psychologically sustainable implementation of the buy-and-hold principle for the regular investor. Not financial advice.
When Buy and Hold Has Genuine Limitations
The buy-and-hold case is powerful but it is not without legitimate limitations. Real Investment Advice is correct that buy-and-hold works best in a long-term rising bull market. An investor who applied a rigid buy-and-hold strategy to Japanese equities in 1989 and held through the subsequent 30-year stagnation would have waited decades to recover. A buy-and-hold investor in the NASDAQ Composite in March 2000 waited approximately 15 years to break even. The buy-and-hold argument is built on the S&P 500’s long-run performance, which reflects the extraordinary dynamism of the US economy over the past century. It does not necessarily apply to all markets, all indices, or all time periods.There is also a legitimate distinction between passive holding and active neglect. A buy-and-hold investor still needs to: maintain appropriate asset allocation for their age and risk tolerance (shifting from equities to bonds as retirement approaches); ensure geographic diversification beyond a single country index; rebalance periodically when one asset class grows disproportionately large; and avoid concentration in single stocks or sectors. ‘Buy and hold’ as a philosophy does not mean ‘buy and ignore’ — it means making deliberate, long-term allocation decisions and not reversing them in response to short-term market noise.
The data also does not tell us what the next 30 years will look like. The 1995–2025 period included the dot-com bull market, the dot-com crash, the 2008 financial crisis, and the extraordinary 2010–2021 bull market. A different 30-year period might have produced different numbers. Not financial advice.
The Verdict: What the Evidence Actually Supports
The evidence supports the following conclusions: first, that the market’s best days are unpredictable, concentrated, and clustered with the worst days, making timing both of them simultaneously essentially impossible in practice. Second, that the cost of missing the best days is catastrophic — missing the 50 best days over 30 years turns a positive 8.45% annual return into a -0.65% annual loss. Third, that professional fund managers with every informational advantage fail to time markets consistently (21% beat their passive benchmark over 10 years, Morningstar 2025). Fourth, that individual investors, guided by emotion, systematically underperform their own investments by buying high and selling low.The evidence also supports: the bear case is real in theory but essentially unachievable in practice. Avoiding the worst days would be hugely profitable. But the best and worst days cluster together, and the conditions that create the worst days are the same conditions that create the best days — meaning the investor trying to avoid one will almost certainly miss the other. Not financial advice.
The practical implication: for most individual investors, a long-term, continuously invested position in a broadly diversified index fund (S&P 500, global all-world, or equivalent) implemented through regular contributions (dollar-cost averaging) is the strategy most consistent with the empirical evidence. It does not require predicting the best days — it simply requires being present for them. Not financial advice. Consult a qualified financial adviser for personalised guidance.
Conclusion
April 9, 2025 was not announced in advance. No news service, no analyst, no trading algorithm predicted on April 8 that the following day would be the single best trading day of the year. The tariff pause that triggered the rally was made in the White House and communicated before the market open. It could have been announced in any of the preceding or following weeks. The best day of the year arrived unscheduled, in the worst market environment of the year, at the precise moment when the instinct to be in cash was strongest.Over 30 years, only 50 days out of more than 7,500 contain the difference between a positive and a negative total return. Less than 1% of trading days. Those 50 days cannot be scheduled, predicted, or isolated from the days around them. The only reliable way to be present for them is to be present for all days — the +5% rallies and the -9% crashes; the ordinary Tuesdays and the extraordinary Aprils.
Buy and hold, implemented through a low-cost diversified index fund and sustained through market cycles, is the strategy most consistent with the available evidence. Not because markets always go up, not because it avoids all losses, and not because it produces the theoretical maximum return. But because it is the strategy that ensures you are present for the days that cannot be predicted and that contain most of the market’s long-run returns. Not financial advice. Consult a qualified financial adviser.
Frequently Asked Questions
How much do you lose by missing the best days in the stock market?Based on actual 2025 data (Hartford Funds, Morningstar, Ned Davis Research): missing the single best day of 2025 (April 9) cut the S&P 500's full-year return from +17.88% to +7.64% -- a 57% decrease. Missing the two best days: +4.23% (-76%). Missing three: +1.67% (-91%). Missing four: -0.46% (you lost money in a year the market was up 18%). Over 30 years (1995-2025, Wells Fargo Investment Institute 2025): fully invested 8.45% annualised; missing 10 best: 5.56%; missing 50 best: -0.65% (negative return). For H1 2025 (AllianceBernstein July 2025): missing the five best days turned a +6.2% gain into a -12.1% loss. Past performance does not predict future results. Not financial advice.
Why do the market's best days happen right after the worst days?
The clustering of best and worst days is structural, not coincidental. The same market conditions that create extreme volatility -- heightened uncertainty, forced selling by leveraged investors, panic by retail investors -- also create the conditions for sudden sharp reversals. Policy announcements (like the April 9, 2025 tariff pause), central bank interventions, or simply the exhaustion of selling pressure tend to arrive at the market's worst moments. Masterworks (June 2026): 'The best days hide next to the worst. Three of the 30 best days and five of the 30 worst days fell inside the same eight trading days of March 2020.' Seven of the 10 best days in the last 20 years occurred within two weeks of the 10 worst days. The implication: an investor who exits to avoid the worst days is very likely to miss the best days that follow immediately after.
Is buy and hold always the best strategy?
Buy-and-hold in a diversified index fund has the strongest empirical support for the majority of individual investors over long time horizons. However, it has genuine limitations: (1) It works best in long-term rising markets (e.g. the S&P 500's 30-year run). A buy-and-hold investor in Japanese equities in 1989 waited decades to recover. (2) It does not mean 'ignore the portfolio' -- appropriate rebalancing and age-based asset allocation shifts are part of a sound long-term strategy. (3) The 30-year data is backward-looking. It reflects the specific performance of the US equity market from 1995-2025 and cannot be guaranteed to repeat. (4) The bear case is valid in theory: avoiding the worst days would produce higher returns than buy-and-hold. The problem is that it is unachievable consistently in practice because the best and worst days cluster together. Real Investment Advice: 'Buy and hold works great in a long-term rising bull market.' Not financial advice.
What is dollar-cost averaging and is it better than a lump sum?
Dollar-cost averaging (DCA) means investing a fixed amount at regular intervals -- monthly, bi-weekly -- regardless of what the market is doing. During declines, the fixed contribution buys more shares (lower price). During rallies, it buys fewer (higher price). Over time, the average purchase price is lower than the average market price across the same period. The academic debate between DCA and lump-sum investing (deploying all available capital immediately) consistently finds that lump-sum investing outperforms DCA in the long run, because markets rise over time and lump-sum exposure starts earning returns sooner. However, for investors building wealth from regular income (most people), DCA is not a choice: it is the natural structure of their investing (monthly contributions from salary). In practice, DCA also removes the psychological pressure of timing large investments and prevents panic-selling because the next contribution arrives regardless. Landmark Wealth Management: 'Dollar-cost averaging and a long-term buy-and-hold approach protect you from the regret of missing those critical days.' Not financial advice.
Can any investor consistently time the market?
The evidence from institutional data is consistently negative. Morningstar's Active/Passive Barometer (Year-End 2025): only 38% of active fund managers beat their passive benchmark in 2025; only ~21% did so over 10 years. Fund managers with Bloomberg terminals, PhD-level quantitative analysts, and real-time market data fail to consistently time markets -- the only form of market timing that matters is consistent timing, not one or two successful calls. Real Investment Advice acknowledges the theoretical benefit ('missing the 10 worst days would have an even bigger positive impact') while noting: 'The problem with market timing is consistency.' The investor who successfully exits before one crash typically becomes overconfident and makes a costly error in the next cycle. The structural reason: the best days and worst days cluster together, making it impossible to reliably avoid one while capturing the other. Not financial advice.
0 Comments
Be the first to share your thoughts on this article.