

Savings
Am I Saving Enough? The One Graph That Will Tell You

Milestones (retiring at 67): 1x salary at 30, 2x at 35, 3x at 40, 4x at 45, 6x at 50, 7x at 55, 8x at 60, 10x at 67; about 12x if retiring at 65. Vanguard: save 12%–15% of income; average total savings rate 12.1% (2026). Reality: Vanguard average 401(k) $167,970 vs median about $44,115; NIRS median $955 for all workers and $40,000 among savers; one breakdown shows ages 35–44 average $141,520 vs median $45,000. Only 46% could cover three months of expenses (Bankrate). My arithmetic: a $60,000 earner saving 12% from age 35 to 67 at a constant 7% reaches about $793,600 (13.2x salary); starting at 45 reaches about $352,800 (5.9x). At 5% returns: 9.0x and 4.6x. Social Security: average benefit about $2,071 a month; Trustees project 78%–83% payable in 2032–2034 without action. UK: PLSA moderate £31,700 a year (single); full State Pension £241.30 a week; auto-enrolment minimum 8%.
The graph is a ladder of milestones that ties your savings to your salary at each age. It is not perfect, and I will explain where it breaks, but it gives a quick, honest first answer, which beats a vague feeling of guilt. Below, we test the ladder against what typical people actually have and show what to do if you are not where you hoped to be.
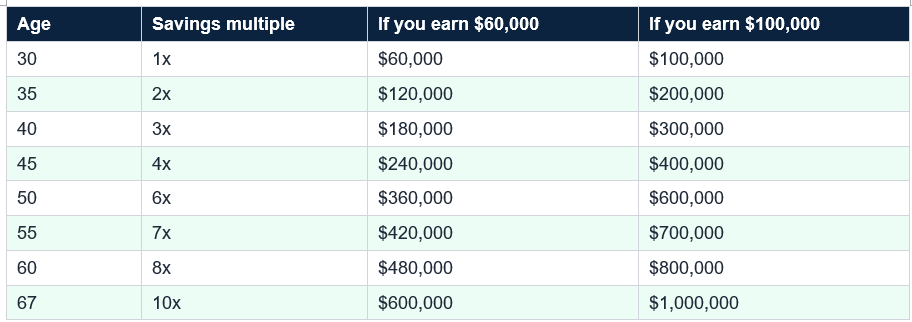
Here is what that looks like in dollars for two example salaries, my own multiplications of Fidelity’s multiples rather than Fidelity’s figures. At $60,000, the target at 40 is $180,000; at $100,000, it is $300,000. At 67, the targets are $600,000 and $1 million.
A few adjustments make the check fairer. If you plan to retire before 67, aim higher; if you expect a pension, you can aim lower. Social Security helps: the average retirement benefit is about $2,071 a month in 2026, or about $24,850 a year, roughly 41% of a $60,000 salary. By my arithmetic, a $600,000 portfolio withdrawn at 4% adds about $24,000 a year, giving about $48,850 in total, or about 81% of that salary, which is why 10 times salary is the usual target.
There are also risks the ladder cannot see. The 2026 Social Security Trustees Report projects that benefits could be cut to about 78% to 83% of scheduled levels in 2032 to 2034 without legislative action, so a cautious saver might aim above the line. Fidelity estimates a 65-year-old retiring this year will need about $185,500 for healthcare. And a market fall just before retirement hurts more than one in your thirties. Use the graph to start the conversation, not to end it.
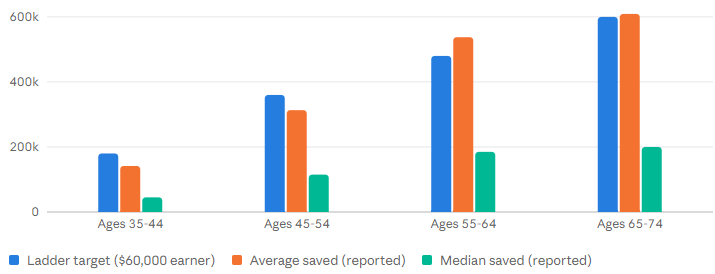
One 2026 breakdown by age shows the same gap, though I could not trace it to its original source, so treat it as indicative. Averages of $141,520 (ages 35–44), $313,220 (45–54), $537,560 (55–64) and $609,230 (65–74) compare with medians of $45,000, $115,000, $185,000 and about $200,000. Against the ladder for a $60,000 earner, averages roughly match the milestones, but medians sit far below them.
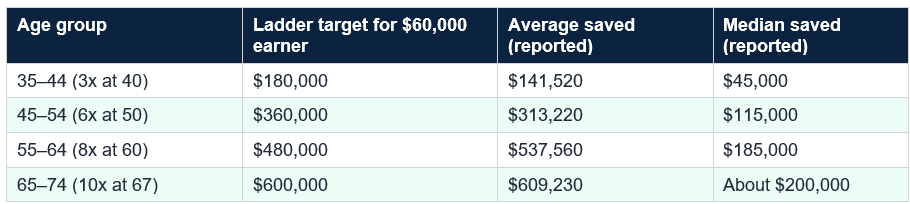
Averages are pulled up by a few very large balances. The median is the better picture of the typical person, and it is well below the ladder. If you are behind the ladder, you are in large company, but company is not a plan.
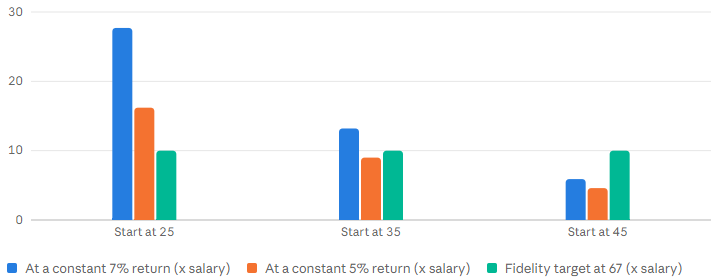
Here is what the rate does over time, in my own illustration. Take a $60,000 earner saving 12% a year with no raises and a constant 7% return. Starting at 35 and saving until 67 produces about $793,600, or 13.2 times salary, above the 10x target. Starting at 45 produces about $352,800, or 5.9 times salary, well short. Starting at 25 produces about $1.66 million. At a 5% return, those become 9.0x, 4.6x and 16.2x. Time and rate both matter, and returns are never guaranteed.
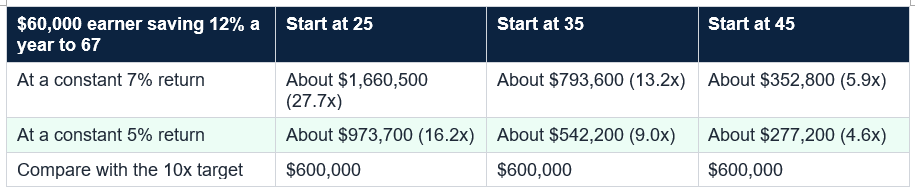
$60,000 earner, 12% saved a year, to age 67, no raises: starting at 35 gives about $793,600 at 7% (13.2x) or $542,200 at 5% (9.0x); starting at 45 gives about $352,800 (5.9x) or $277,200 (4.6x). Illustrative constant-return arithmetic.
One adviser in recent coverage suggested the 50/30/20 rule: about 50% of income to essentials, 30% to discretionary spending and 20% to savings. It is not law, and high housing costs can make it hard, but it gives a sense of scale. If you carry credit card debt at around 21%, paying it off should come before extra investing.
Fourth, work a little longer or phase into retirement, which adds savings and shortens the withdrawal period. Fifth, delay claiming Social Security if you can, which permanently increases the monthly benefit. Sixth, trim fees and costs, since low-cost index funds keep more of your return. None of these requires a windfall. They require a decision and a date.
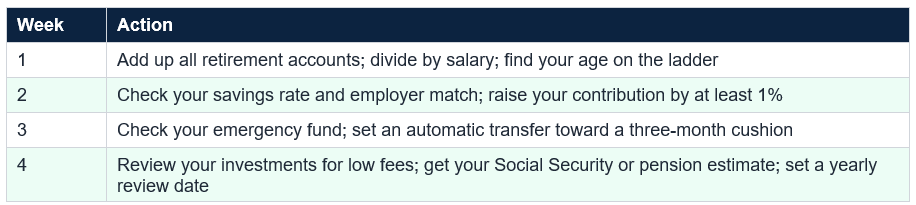
Your move: Pick one lever this week. The simplest is to log in to your retirement plan and raise your contribution by 1% or capture the full employer match.
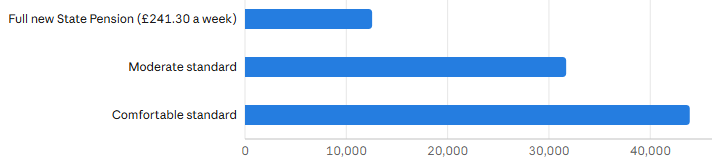
By my arithmetic, a single person aiming for the moderate standard has a gap of about £19,150 a year above the State Pension. At a 4% withdrawal rate, that implies a pot of roughly £479,000, in line with the PLSA’s estimate of £330,000 to £490,000 to buy an annuity. The auto-enrolment minimum is 8% (3% from you, 5% from your employer), and experts, including Pensions UK, recommend at least 12%. Check your workplace pension statement and use the free MoneyHelper tools.
The best next step is the unglamorous one: raise your savings rate, capture your match, build a cushion and revisit your plan each year. No graph can know your life, but this one can tell you where you stand and which lever to pull first. A qualified adviser can help tailor it.
A widely used rule of thumb from Fidelity is about 1 times your salary by 30, 3 times by 40, 6 times by 50, 8 times by 60 and 10 times by 67. It is a guideline for people who plan to retire at 67 and save steadily, not a pass-or-fail test. Divide your retirement savings by your salary to see where you stand.
What percentage of income should I save for retirement?
Vanguard recommends 12% to 15% of income, including any employer contribution. Its 2026 report found that the average total savings rate, employee plus employer, was a record 12.1%. If you started later, you may need to save more, and if you receive a generous pension, you may need less.
Is the median or the average a better comparison?
The median. Averages are pulled up by a small number of large balances. Vanguard reported an average 401(k) balance of $167,970 but a median of about $44,115. One breakdown showed average savings of $141,520 for ages 35 to 44 against a median of $45,000. Comparing yourself with the average can make you feel better or worse than your real position.
I am behind. Is it too late?
No. Raising your savings rate, capturing any employer match, using catch-up contributions after 50, working a little longer and delaying Social Security can each help. In 2026 the 401(k) catch-up is $8,000 at 50 and over and $11,250 at ages 60 to 63, and the IRA catch-up is $1,100. Starting now is worth far more than waiting for a perfect moment.
Do these benchmarks apply in the UK?
Not directly, because the UK has the State Pension and auto-enrolment. The Pensions and Lifetime Savings Association estimates a single person needs about £31,700 a year for a moderate retirement. The full new State Pension is £241.30 a week from April 2026, and the minimum auto-enrolment contribution of 8% is widely seen as too low for a moderate lifestyle.
Table of Contents
- The Question Behind the Graph
- The Short Answer: Three Numbers
- The One Graph: Savings Milestones by Age
- How to Use It in 60 Seconds
- Why the Graph Is a Guide, Not a Verdict
- Reality Check: Average vs. Median
- Your Savings Rate Matters More Than Your Age
- The Other Savings: Emergency and Short-Term
- If You Are Behind: Six Levers
- A UK Check: Pensions and the State Pension
- A Five-Question Self-Test and 30-Day Plan
- Conclusion
- Frequently Asked Questions
Reality check: the ladder vs. what people actually have ($)
Retirement savings ($) by Averages and medians from PocketGuard (original source not clearly stated); median 65-74 is approximate
Savings rate and start age: $60,000 earner saving 12% a year to age 67 (x salary)
Savings at 67 as a multiple of salary by Author's illustration: no raises, constant returns, contributions at year end; not a forecast
UK check: full State Pension vs. PLSA retirement income standards (single person, \u00a3 a year)
£ per year by Sources: PLSA via Financial Planning Today; TPT; State Pension annualised by author
The Question Behind the Graph
Almost everyone asks it eventually, usually at an awkward moment: lying awake at 2 a.m., or glancing at a 401(k) statement you have not opened in a year. Am I saving enough? The honest answer depends on your age, income, plans and how much help you will get from Social Security or a pension. But there is a surprisingly good shortcut, and it fits on a single graph.The graph is a ladder of milestones that ties your savings to your salary at each age. It is not perfect, and I will explain where it breaks, but it gives a quick, honest first answer, which beats a vague feeling of guilt. Below, we test the ladder against what typical people actually have and show what to do if you are not where you hoped to be.
The Short Answer: Three Numbers
Three numbers answer most of the question. First, your savings multiple: retirement savings divided by annual salary, compared with the ladder. Second, your savings rate: Vanguard recommends 12% to 15% of income, including any employer contribution. Third, your cushion: enough emergency savings that a bad month does not force you to raid your retirement. If you are roughly on the ladder, saving 12% or more and holding three months of expenses, you are probably fine. If not, the gap is fixable.The One Graph: Savings Milestones by Age
The most widely quoted ladder comes from Fidelity. It suggests having about 1 times your salary saved by 30, 2 times by 35, 3 times by 40, 4 times by 45, 6 times by 50, 7 times by 55, 8 times by 60 and 10 times by 67. The ladder assumes retirement at 67, and one source reports Fidelity’s estimate that someone retiring at 65 needs about 12 times their income, and more for earlier retirement.Here is what that looks like in dollars for two example salaries, my own multiplications of Fidelity’s multiples rather than Fidelity’s figures. At $60,000, the target at 40 is $180,000; at $100,000, it is $300,000. At 67, the targets are $600,000 and $1 million.
How to Use It in 60 Seconds
Divide your total retirement savings, including 401(k)s, IRAs and old workplace plans, by your current annual salary, then find your age on the ladder. At or above the multiple, you are on track by this measure. Someone aged 40 with $90,000 saved and a $60,000 salary has a multiple of 1.5, half of the 3x milestone. That is a gap, not a verdict.A few adjustments make the check fairer. If you plan to retire before 67, aim higher; if you expect a pension, you can aim lower. Social Security helps: the average retirement benefit is about $2,071 a month in 2026, or about $24,850 a year, roughly 41% of a $60,000 salary. By my arithmetic, a $600,000 portfolio withdrawn at 4% adds about $24,000 a year, giving about $48,850 in total, or about 81% of that salary, which is why 10 times salary is the usual target.
Why the Graph Is a Guide, Not a Verdict
Every rule of thumb hides assumptions. The ladder assumes a steady savings habit, a retirement age of 67, average investment returns and typical Social Security benefits. It does not know whether you have a pension, a spouse with their own savings, a house you will downsize or above-average health costs. Fidelity itself notes that most people will not hit every milestone.There are also risks the ladder cannot see. The 2026 Social Security Trustees Report projects that benefits could be cut to about 78% to 83% of scheduled levels in 2032 to 2034 without legislative action, so a cautious saver might aim above the line. Fidelity estimates a 65-year-old retiring this year will need about $185,500 for healthcare. And a market fall just before retirement hurts more than one in your thirties. Use the graph to start the conversation, not to end it.
Reality Check: Average vs. Median
Now compare the ladder with what people actually have, where it matters whether you read the average or the median. Vanguard’s data show an average 401(k) balance of $167,970 but a median of about $44,115, according to a secondary summary. The National Institute on Retirement Security found a median of just $955 across all employed Americans aged 21 to 64, and $40,000 among those with an account.One 2026 breakdown by age shows the same gap, though I could not trace it to its original source, so treat it as indicative. Averages of $141,520 (ages 35–44), $313,220 (45–54), $537,560 (55–64) and $609,230 (65–74) compare with medians of $45,000, $115,000, $185,000 and about $200,000. Against the ladder for a $60,000 earner, averages roughly match the milestones, but medians sit far below them.
Averages are pulled up by a few very large balances. The median is the better picture of the typical person, and it is well below the ladder. If you are behind the ladder, you are in large company, but company is not a plan.
Your Savings Rate Matters More Than Your Age
The ladder is really a shortcut for a savings rate. Vanguard’s 2026 report found a record average total savings rate of 12.1%, employee plus employer, and recommends 12% to 15%. Automation plays a major part: employees who are automatically enrolled participate at 94%, compared with 64% when they must opt in.Here is what the rate does over time, in my own illustration. Take a $60,000 earner saving 12% a year with no raises and a constant 7% return. Starting at 35 and saving until 67 produces about $793,600, or 13.2 times salary, above the 10x target. Starting at 45 produces about $352,800, or 5.9 times salary, well short. Starting at 25 produces about $1.66 million. At a 5% return, those become 9.0x, 4.6x and 16.2x. Time and rate both matter, and returns are never guaranteed.
$60,000 earner, 12% saved a year, to age 67, no raises: starting at 35 gives about $793,600 at 7% (13.2x) or $542,200 at 5% (9.0x); starting at 45 gives about $352,800 (5.9x) or $277,200 (4.6x). Illustrative constant-return arithmetic.
The Other Savings: Emergency and Short-Term
Retirement is only one bucket. If an unexpected bill forces you to raid your 401(k), you lose growth and may pay taxes and penalties. Bankrate’s 2026 survey found that only 47% of Americans could cover a $1,000 emergency, 46% three months of expenses and 27% six. Start with a $1,000 starter fund, then build toward three to six months of essentials.One adviser in recent coverage suggested the 50/30/20 rule: about 50% of income to essentials, 30% to discretionary spending and 20% to savings. It is not law, and high housing costs can make it hard, but it gives a sense of scale. If you carry credit card debt at around 21%, paying it off should come before extra investing.
If You Are Behind: Six Levers
If the ladder says you are behind, do not panic. There are six levers, and you can pull several. First, raise your savings rate, ideally by one percentage point every few months or with each raise. Second, capture any employer match; it is an instant return on your contribution. Third, use catch-up contributions if you are 50 or older: in 2026 the 401(k) limit is $24,500, with an extra $8,000 catch-up at 50 and $11,250 at ages 60 to 63, and the IRA limit is $7,500 plus $1,100.Fourth, work a little longer or phase into retirement, which adds savings and shortens the withdrawal period. Fifth, delay claiming Social Security if you can, which permanently increases the monthly benefit. Sixth, trim fees and costs, since low-cost index funds keep more of your return. None of these requires a windfall. They require a decision and a date.
Your move: Pick one lever this week. The simplest is to log in to your retirement plan and raise your contribution by 1% or capture the full employer match.
A UK Check: Pensions and the State Pension
If you are reading this in Britain, the US ladder does not apply directly. The UK system rests on the State Pension plus workplace pensions. The full new State Pension rose to £241.30 a week in April 2026, roughly £12,550 a year. The Pensions and Lifetime Savings Association’s Retirement Living Standards put a moderate retirement at about £31,700 a year for a single person and £43,900 for a couple, and a comfortable one at £43,900 for a single person and £60,600 for a couple.By my arithmetic, a single person aiming for the moderate standard has a gap of about £19,150 a year above the State Pension. At a 4% withdrawal rate, that implies a pot of roughly £479,000, in line with the PLSA’s estimate of £330,000 to £490,000 to buy an annuity. The auto-enrolment minimum is 8% (3% from you, 5% from your employer), and experts, including Pensions UK, recommend at least 12%. Check your workplace pension statement and use the free MoneyHelper tools.
A Five-Question Self-Test and 30-Day Plan
Answer five questions honestly. Is my savings multiple at or near the ladder for my age? Am I saving at least 12% of income, including my employer’s share? Do I have three months of expenses saved outside retirement accounts? Am I free of high-interest debt? Do I know roughly what Social Security or a pension will provide? Four or five yeses mean you are probably on track. Two or fewer mean it is time to act, not to feel ashamed.
Conclusion
So, am I saving enough? The graph gives a first answer: about 1 times your salary by 30, 3 times by 40, 6 times by 50, 8 times by 60 and 10 times by 67, and 12% to 15% of income along the way. Most people are behind it: the median saver has far less than the ladder suggests, even though averages look closer. That is not a reason to give up. A $60,000 earner who starts at 35 and saves 12% could reach 13 times salary at a 7% return, and even starting at 45 can reach about six times.The best next step is the unglamorous one: raise your savings rate, capture your match, build a cushion and revisit your plan each year. No graph can know your life, but this one can tell you where you stand and which lever to pull first. A qualified adviser can help tailor it.
Frequently Asked Questions
How much should I have saved by my age?A widely used rule of thumb from Fidelity is about 1 times your salary by 30, 3 times by 40, 6 times by 50, 8 times by 60 and 10 times by 67. It is a guideline for people who plan to retire at 67 and save steadily, not a pass-or-fail test. Divide your retirement savings by your salary to see where you stand.
What percentage of income should I save for retirement?
Vanguard recommends 12% to 15% of income, including any employer contribution. Its 2026 report found that the average total savings rate, employee plus employer, was a record 12.1%. If you started later, you may need to save more, and if you receive a generous pension, you may need less.
Is the median or the average a better comparison?
The median. Averages are pulled up by a small number of large balances. Vanguard reported an average 401(k) balance of $167,970 but a median of about $44,115. One breakdown showed average savings of $141,520 for ages 35 to 44 against a median of $45,000. Comparing yourself with the average can make you feel better or worse than your real position.
I am behind. Is it too late?
No. Raising your savings rate, capturing any employer match, using catch-up contributions after 50, working a little longer and delaying Social Security can each help. In 2026 the 401(k) catch-up is $8,000 at 50 and over and $11,250 at ages 60 to 63, and the IRA catch-up is $1,100. Starting now is worth far more than waiting for a perfect moment.
Do these benchmarks apply in the UK?
Not directly, because the UK has the State Pension and auto-enrolment. The Pensions and Lifetime Savings Association estimates a single person needs about £31,700 a year for a moderate retirement. The full new State Pension is £241.30 a week from April 2026, and the minimum auto-enrolment contribution of 8% is widely seen as too low for a moderate lifestyle.
0 Comments
Be the first to share your thoughts on this article.