
Savings
What Have You Cut Back On Because of the Economy?

66% cut everyday spending. 71% kept pet care. 59% held onto dining out. 45% of Americans already reduced expenses. The cutback economy is not about giving everything up — it is about hard choices between what survives and what doesn’t. It started with noticing the grocery bill. Then the gas price. Then the electricity statement. Then the insurance renewal. At some point, you stopped spending on something. Maybe you make coffee at home now instead of buying it on the way to work. Maybe you cancelled the streaming service you barely used. Maybe the clothing shop has become a charity shop. Maybe you kept the gym membership but started wondering every time you paid it whether it was still worth it. This is the cutback economy — and it is not one dramatic decision. It is dozens of small, accumulating adjustments made across months and years in response to a cost-of-living squeeze that has become the background noise of everyday financial life. PYMNTS Intelligence surveyed 2,283 US consumers in 2026 and found that 66% of those facing cost-of-living challenges had cut everyday spending, up four points since October. Leger’s WIN World Survey from May 2025 found that 45% of Americans had already reduced expenses and another 28% were planning to. KPMG’s Consumer Pulse from summer 2025 found that 50% of shoppers were cutting back overall, with nearly 80% expecting prices to go even higher. This article does not lecture you about what to cut. It documents what people are actually cutting, what they are stubbornly keeping, and what the data says about how real households are navigating the economy in 2025 and 2026.
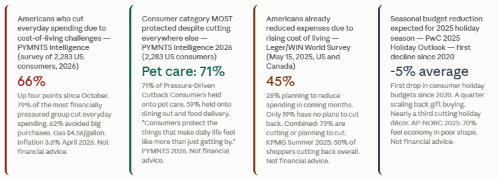
45% of Americans already reduced expenses; 28% planning to (Leger/WIN May 2025). 50% of shoppers cutting back overall (KPMG Summer 2025). 66% of consumers facing cost-of-living challenges cut everyday spending (PYMNTS 2026, N=2,283). 70% feel economy is in poor shape (AP-NORC 2025).
Gas: $4.56/gallon Memorial Day weekend 2026 (PYMNTS 2026). US inflation April 2026: 3.8% — highest in nearly 3 years (PYMNTS 2026). 67% of TD Bank survey respondents said some aspect of finances keeps them up at night (2024). Only 11% of Americans did not change behaviour in response to inflation (Statista Q + We Are Social, April 2023, N=1,009).
The grocery bill is the cutback economy’s cruelest paradox. Most people are not cutting back on groceries — they are spending more on them than ever. TD Bank’s Consumer Spending Index found that 50% of respondents said their spending has increased the most on groceries over the past year, and 58% say they spend the most money on groceries in a typical month. The cutback, when it comes to food, is in the quality and brand tier rather than the frequency. KPMG’s Summer 2025 Consumer Pulse identified that shoppers are cutting back across nearly all spending categories except essentials like groceries. What that means in practice: the switch from name brands to store brands, the shift away from organic where the premium feels untenable, the meal-planning that now starts with what is on sale rather than what sounds good. PYMNTS Intelligence, reporting on their 2026 survey of 2,283 consumers, warned that some economists expect grocery inflation could reach 4% to 4.5% by year-end 2026. For a household spending $800 per month on groceries, a 4.5% increase is $36 per month, $432 per year, from a budget line that already feels unavoidable. The grocery squeeze is real, persistent, and growing regardless of whether the household is cutting back on anything else. 50% of TD Bank survey respondents said spending increased most on groceries (TD Bank 2024). 58% spend most money on groceries monthly. PYMNTS 2026: grocery inflation could reach 4%-4.5% by year-end. KPMG Summer 2025: shoppers cutting across nearly all categories EXCEPT groceries.
The coffee shop is the cutback economy’s most discussed symbol. It appeared in personal finance writing during every previous downturn and it has reappeared now. But the data tells a more nuanced story than ‘people stopped buying lattes.’ PYMNTS Intelligence’s 2026 survey found that 59% of consumers facing cost-of-living challenges held onto dining out and food delivery. That is a majority. The cutback has been in frequency and occasion rather than elimination. The person who went to their favourite coffee shop every weekday morning is now going twice a week. The household that ordered takeaway three times per week has cut to once. The birthday dinner restaurant has been replaced by a mid-range alternative. What KPMG’s Consumer Pulse described in summer 2025 as ‘purpose behind every dollar spent’ applies directly here: the spending has not stopped, but the automatic, habitual, unexamined purchase has. Leger’s WIN World Survey from May 2025 found that 45% of Americans had already reduced expenses and 28% were planning to — and food and drink choices outside the home are among the first areas where intention translates to action. The daily coffee shop visit is a $5 decision made 260 times a year. At $5 per visit, 260 working days, that is $1,300 annually. Cutting from five visits per week to two saves $780. The math is why this category appears in almost every consumer budget audit.
59% of Pressure-Driven Cutback Consumers held onto dining out and food delivery despite cost-of-living challenges (PYMNTS 2026, N=2,283). 45% of Americans already reduced expenses (Leger/WIN May 2025). KPMG Summer 2025: 'Today's consumer wants purpose behind every dollar spent.
Clothing is one of the clearest examples of the cutback economy’s characteristic move: not elimination but substitution. KPMG’s Summer 2025 Consumer Pulse identified that thrift store apparel spending is up 2%. People have not stopped buying clothes. They have changed where and how they buy them. Statista’s survey data shows that cutting back on clothing purchases was among the top planned spending reductions. But ‘cutting back’ in practice looks different for different income segments. For higher-income households, it is buying one quality item instead of three fast-fashion purchases. For middle-income households, it is the shift to resale and thrift. For lower-income households, it may mean wearing existing clothes longer and postponing replacement. The shift to direct-to-consumer channels identified by KPMG — consumers moving toward D2C for basics like clothing — reflects a parallel trend: cutting out the retailer margin by buying directly from brands or through resale platforms. AP-NORC’s 2025 poll on holiday spending found that consumers planned to spend less on gifts — and clothing is consistently among the top gift categories most affected when holiday budgets tighten. PwC’s 2025 Holiday Outlook found consumers expected their seasonal budgets to decline by 5% on average — the first drop since 2020.
Thrift store apparel spending up 2% (KPMG Summer 2025). Statista global survey: clothing purchases among top planned cutbacks. PwC 2025 Holiday Outlook: seasonal budgets to decline 5% — first drop since 2020. AP-NORC 2025: half of respondents cutting back on non-essential purchases.
The subscription audit has become one of the most common financial self-help recommendations of the 2025-2026 period — and the data confirms that people are taking it seriously, to a point. Statista’s Global Consumer Survey identified that two thirds of respondents planned to cut back on current contracts and subscriptions to save money. But a specific finding from the PYMNTS 2026 survey complicates the headline: many consumers who said they planned to cut subscriptions have not. The cutback economy tends to spare the subscriptions people actually use daily and eliminate the ones they forgot they had. KPMG’s Consumer Pulse identified the shift toward smarter buying, with consumers becoming more deliberate about what they pay recurring costs for. The subscription that gets cancelled is typically the gym membership that hasn’t been used since February, the streaming service that duplicates what the main service provides, the magazine that arrives unread. What remains is the subscription that has genuinely embedded itself in daily life — and the cutback economy, as PYMNTS notes, consistently spares the things that ‘make daily life feel like more than just getting by.’ TD Bank’s Consumer Spending Index found that 67% of those surveyed revealed some aspect of their finances keeps them up at night. The subscription review is often one of the first active steps people take when that financial anxiety converts into action.
Two thirds (66%) of Statista survey respondents planned to cut subscriptions and contracts to save money. 67% of TD Bank survey respondents said some aspect of their finances keeps them up at night (TD Bank 2024 Consumer Spending Index, N=1,510). KPMG: shift toward value-first behavior and deliberate spending.
The most revealing finding in the PYMNTS Intelligence 2026 survey is not what people cut but what they refused to cut despite significant financial pressure. 71% of consumers held onto pet care. 59% held onto dining out and food delivery. KPMG’s Julia Wilson observed: ‘Wellness is evolving, not disappearing.’ These protected categories reveal something important about how people navigate financial pressure: the things that provide emotional sustenance, connection, and a sense of normal life are the last to go. Pet care is the most striking example. In a survey where 79% of Pressure-Driven Cutback Consumers reported cutting everyday spending, 71% still held onto pet care. The emotional relationship with a pet, and the responsibility that comes with it, outweighs the financial calculation. The PYMNTS analysis frames this as the human side of the cutback economy: ‘Even in the Cutback Economy, consumers are protecting the things that make daily life feel like more than just getting by.’ For many households, the dining out that remains is not indulgence for its own sake. It is the birthday dinner that still happens, the Sunday brunch that marks the rhythm of the week, the Friday takeaway that signals the end of a hard five days. These purchases are not financially irrational. They are the minimum viable quality of life that people are determined to protect.
71% of consumers held onto pet care despite cost-of-living pressure (PYMNTS 2026, N=2,283). 59% held onto dining out and food delivery. KPMG: 'Wellness is evolving, not disappearing.' PYMNTS framing: protecting the things that 'make daily life feel like more than just getting by.
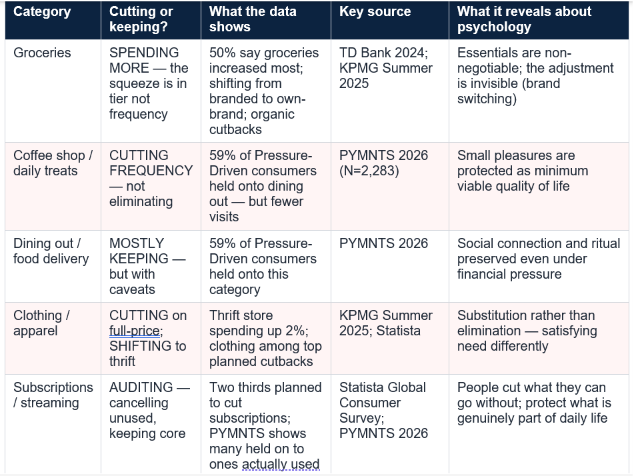
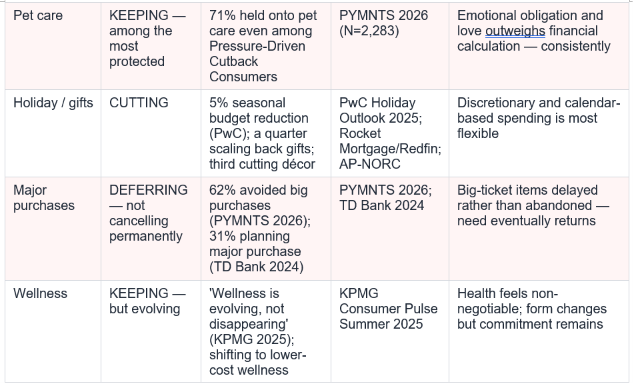
Multiple 2025-2026 surveys converge on a consistent picture. PYMNTS Intelligence's 2026 survey of 2,283 US consumers found that 66% of consumers facing cost-of-living challenges cut everyday spending, up four points since October, with 79% of the most financially pressured group cutting everyday spending and 62% avoiding big purchases. Leger/WIN World Survey (May 2025) found 45% of Americans had already reduced expenses and 28% were planning to — a combined 73%. KPMG's Consumer Pulse (Summer 2025) found 50% of shoppers cutting back overall. AP-NORC's 2025 holiday poll found about half cutting back on non-essential purchases. The consistent finding across all surveys: the majority of Americans are making some form of spending reduction. Only 19% in the Leger survey had no plans to cut back at all.
What are people cutting back on most right now?
The categories with the most widespread reported cuts are: non-essential purchases broadly (around 50% cutting, multiple surveys); subscription and contract reviews (two thirds planned to cut per Statista Global Consumer Survey); holiday gifts and décor (PwC 2025 Holiday Outlook: 5% budget decline, first drop since 2020); clothing and apparel (among top planned cutbacks per Statista; shift to thrift stores per KPMG 2025); restaurant and food delivery frequency (reduced but not eliminated — 59% of Pressure-Driven consumers still holding on per PYMNTS 2026); and daily treat frequency (coffee shops, takeaways). The consistent pattern: people cut frequency and tier before eliminating categories entirely.
Why are people keeping pet care despite cutting other things?
PYMNTS Intelligence's 2026 survey found that 71% of consumers held onto pet care even among the most financially pressured group — the highest retention rate of any discretionary category measured. The explanation appears to be a combination of emotional obligation and the irreversibility of the decision: a pet requires ongoing care regardless of financial circumstances, and the emotional bond makes reducing that care feel unconscionable to most pet owners. PYMNTS's framing is accurate: even in the cutback economy, people protect 'the things that make daily life feel like more than just getting by.' Pet care falls into the category of purchases that are psychologically near-non-negotiable regardless of their discretionary economic status.
Is the grocery bill actually going up or are people just spending less?
Both are true simultaneously. Grocery spending is going up in dollar terms because prices are rising — TD Bank's 2024 Consumer Spending Index found 50% of respondents said their spending increased most on groceries, and 58% say they spend the most money on groceries monthly. At the same time, people are changing what they buy: switching from branded to own-brand products, cutting back on premium and organic ranges, and meal-planning around sales rather than preferences. PYMNTS 2026 warns that grocery inflation could reach 4%-4.5% by year-end 2026. KPMG's Consumer Pulse confirmed shoppers are cutting across nearly all categories except groceries. The grocery bill is the one category where the cutback is happening within the bill rather than to it.
Are these cutbacks temporary or are they permanent behaviour changes?
The data cannot definitively answer this — but several indicators suggest the changes are more durable than previous cycles. Statista Q + We Are Social's April 2023 survey found only 11% of Americans had not changed their behaviour at all in response to inflation, showing near-universal adjustment. KPMG's 2025 consumer framing — 'consumers are not just spending less, they're spending smarter' — suggests some of the behavioural changes (subscription auditing, value-first shopping, thrift store adoption) have utility beyond the specific inflationary period that triggered them. The shift to supermarket own-brands and thrift stores historically shows lasting stickiness once established. However, the categories people most want to return to (dining out, entertainment, big purchases) are also the ones they are most actively deferring rather than abandoning permanently.
Table of Contents
- The Cutback Economy: What It Is and How We Got Here
- The Numbers Behind the Squeeze
- Cutback 1 Groceries: The Squeeze Hiding in Plain Sight
- Cutback 2 Coffee, Takeaways, and the Little Things That Add Up
- Cutback 3 Clothing: The Shift to Thrift
- Cutback 4 Subscriptions: The Monthly Drain Under Review
- Cutback 5 The Sacred Items: What People Refuse to Cut
- Cut vs Keep: The Master Comparison Table
- The UK Picture: Different Numbers, Same Squeeze
- Conclusion: It Is Not About Giving Up — It Is About Choosing
- Frequently Asked Questions
The Cutback Economy: What It Is and How We Got Here
The term ‘cutback economy’ was coined in PYMNTS Intelligence’s 2026 consumer research to describe a specific economic moment: one where the cost-of-living squeeze has become structural rather than cyclical, and where consumer behaviour has fundamentally reorganised around a new set of priorities. This is not a recession, technically speaking. Unemployment is not at crisis levels. The stock market has not collapsed. But the accumulated effect of several years of inflation, the persistence of high interest rates through 2024 and into 2025, and the arrival of tariff-driven price increases in 2025-2026 has produced something that feels, in the grocery aisle and the petrol station and the insurance renewal letter, like exactly the kind of financial pressure that recessions are supposed to produce. KPMG’s Consumer Pulse from summer 2025 found that nearly 80% of consumers expected prices to go even higher. Leger’s WIN World Survey from May 2025 found that only 19% of Americans had no plans to cut back. PYMNTS Intelligence’s 2026 survey of 2,283 consumers found that 66% of those facing cost-of-living challenges had cut everyday spending, up four points since October. The shift from ‘I plan to cut back’ to ‘I am already cutting back’ is the defining characteristic of the cutback economy. And the decisions people make about what stays and what goes reveal something about human psychology under financial pressure that is worth understanding beyond the numbers.45% of Americans already reduced expenses; 28% planning to (Leger/WIN May 2025). 50% of shoppers cutting back overall (KPMG Summer 2025). 66% of consumers facing cost-of-living challenges cut everyday spending (PYMNTS 2026, N=2,283). 70% feel economy is in poor shape (AP-NORC 2025).
The Numbers Behind the Squeeze
Before the what-people-cut conversation, the why matters. The PYMNTS Intelligence 2026 report identifies the specific economic conditions producing the cutback behaviour. Gas hit $4.56 per gallon heading into the Memorial Day weekend 2026. US inflation was 3.8% in April 2026, its highest level in nearly three years. Companies that had absorbed tariff costs through most of 2025 began passing those costs on to consumers in early 2026. Economists were warning that grocery inflation could reach 4% to 4.5% by year-end. TD Bank’s Consumer Spending Index found that 67% of respondents said some aspect of their finances kept them up at night. Two-thirds said some aspect of finances was causing them overnight anxiety. That is not an economic statistic. That is a public health observation. KPMG’s Consumer Pulse added the psychological dimension: consumers have not surrendered to pessimism. They have recalibrated. ‘Consumers in 2025 are not just spending less — they’re spending smarter.’ The Statista survey from April 2023 — the foundational data point for this pattern — found that only 11% of US adults said they had not changed their behaviour at all in response to inflation. That near-universality of behavioural change is the backdrop for everything that follows. The cutback economy is not a niche experience. It is the mainstream one.Gas: $4.56/gallon Memorial Day weekend 2026 (PYMNTS 2026). US inflation April 2026: 3.8% — highest in nearly 3 years (PYMNTS 2026). 67% of TD Bank survey respondents said some aspect of finances keeps them up at night (2024). Only 11% of Americans did not change behaviour in response to inflation (Statista Q + We Are Social, April 2023, N=1,009).
Cutback 1 Groceries: The Squeeze Hiding in Plain Sight
Cut: Brand loyalty. Premium versions. Organic ranges. Meal frequency per week in some households. | Kept: The weekly shop itself — non-negotiable.The grocery bill is the cutback economy’s cruelest paradox. Most people are not cutting back on groceries — they are spending more on them than ever. TD Bank’s Consumer Spending Index found that 50% of respondents said their spending has increased the most on groceries over the past year, and 58% say they spend the most money on groceries in a typical month. The cutback, when it comes to food, is in the quality and brand tier rather than the frequency. KPMG’s Summer 2025 Consumer Pulse identified that shoppers are cutting back across nearly all spending categories except essentials like groceries. What that means in practice: the switch from name brands to store brands, the shift away from organic where the premium feels untenable, the meal-planning that now starts with what is on sale rather than what sounds good. PYMNTS Intelligence, reporting on their 2026 survey of 2,283 consumers, warned that some economists expect grocery inflation could reach 4% to 4.5% by year-end 2026. For a household spending $800 per month on groceries, a 4.5% increase is $36 per month, $432 per year, from a budget line that already feels unavoidable. The grocery squeeze is real, persistent, and growing regardless of whether the household is cutting back on anything else. 50% of TD Bank survey respondents said spending increased most on groceries (TD Bank 2024). 58% spend most money on groceries monthly. PYMNTS 2026: grocery inflation could reach 4%-4.5% by year-end. KPMG Summer 2025: shoppers cutting across nearly all categories EXCEPT groceries.
Cutback 2 Coffee, Takeaways, and the Little Things That Add Up
Cut: Daily coffee shop visits. Takeaway frequency. Impulse food and drink purchases. | Kept: Occasional treat: 59% of Pressure-Driven consumers holding onto dining out (PYMNTS 2026).The coffee shop is the cutback economy’s most discussed symbol. It appeared in personal finance writing during every previous downturn and it has reappeared now. But the data tells a more nuanced story than ‘people stopped buying lattes.’ PYMNTS Intelligence’s 2026 survey found that 59% of consumers facing cost-of-living challenges held onto dining out and food delivery. That is a majority. The cutback has been in frequency and occasion rather than elimination. The person who went to their favourite coffee shop every weekday morning is now going twice a week. The household that ordered takeaway three times per week has cut to once. The birthday dinner restaurant has been replaced by a mid-range alternative. What KPMG’s Consumer Pulse described in summer 2025 as ‘purpose behind every dollar spent’ applies directly here: the spending has not stopped, but the automatic, habitual, unexamined purchase has. Leger’s WIN World Survey from May 2025 found that 45% of Americans had already reduced expenses and 28% were planning to — and food and drink choices outside the home are among the first areas where intention translates to action. The daily coffee shop visit is a $5 decision made 260 times a year. At $5 per visit, 260 working days, that is $1,300 annually. Cutting from five visits per week to two saves $780. The math is why this category appears in almost every consumer budget audit.
59% of Pressure-Driven Cutback Consumers held onto dining out and food delivery despite cost-of-living challenges (PYMNTS 2026, N=2,283). 45% of Americans already reduced expenses (Leger/WIN May 2025). KPMG Summer 2025: 'Today's consumer wants purpose behind every dollar spent.
Cutback 3 Clothing: The Shift to Thrift
Cut: Fast fashion frequency. New-season impulse buying. Full-price department store purchases. | Kept: Clothing itself — but purchased differently.Clothing is one of the clearest examples of the cutback economy’s characteristic move: not elimination but substitution. KPMG’s Summer 2025 Consumer Pulse identified that thrift store apparel spending is up 2%. People have not stopped buying clothes. They have changed where and how they buy them. Statista’s survey data shows that cutting back on clothing purchases was among the top planned spending reductions. But ‘cutting back’ in practice looks different for different income segments. For higher-income households, it is buying one quality item instead of three fast-fashion purchases. For middle-income households, it is the shift to resale and thrift. For lower-income households, it may mean wearing existing clothes longer and postponing replacement. The shift to direct-to-consumer channels identified by KPMG — consumers moving toward D2C for basics like clothing — reflects a parallel trend: cutting out the retailer margin by buying directly from brands or through resale platforms. AP-NORC’s 2025 poll on holiday spending found that consumers planned to spend less on gifts — and clothing is consistently among the top gift categories most affected when holiday budgets tighten. PwC’s 2025 Holiday Outlook found consumers expected their seasonal budgets to decline by 5% on average — the first drop since 2020.
Thrift store apparel spending up 2% (KPMG Summer 2025). Statista global survey: clothing purchases among top planned cutbacks. PwC 2025 Holiday Outlook: seasonal budgets to decline 5% — first drop since 2020. AP-NORC 2025: half of respondents cutting back on non-essential purchases.
Cutback 4 Subscriptions: The Monthly Drain Under Review
Cut: Overlapping streaming services. Gym memberships not being used. Auto-renewal subscriptions. | Kept: One or two core streaming services (most households).The subscription audit has become one of the most common financial self-help recommendations of the 2025-2026 period — and the data confirms that people are taking it seriously, to a point. Statista’s Global Consumer Survey identified that two thirds of respondents planned to cut back on current contracts and subscriptions to save money. But a specific finding from the PYMNTS 2026 survey complicates the headline: many consumers who said they planned to cut subscriptions have not. The cutback economy tends to spare the subscriptions people actually use daily and eliminate the ones they forgot they had. KPMG’s Consumer Pulse identified the shift toward smarter buying, with consumers becoming more deliberate about what they pay recurring costs for. The subscription that gets cancelled is typically the gym membership that hasn’t been used since February, the streaming service that duplicates what the main service provides, the magazine that arrives unread. What remains is the subscription that has genuinely embedded itself in daily life — and the cutback economy, as PYMNTS notes, consistently spares the things that ‘make daily life feel like more than just getting by.’ TD Bank’s Consumer Spending Index found that 67% of those surveyed revealed some aspect of their finances keeps them up at night. The subscription review is often one of the first active steps people take when that financial anxiety converts into action.
Two thirds (66%) of Statista survey respondents planned to cut subscriptions and contracts to save money. 67% of TD Bank survey respondents said some aspect of their finances keeps them up at night (TD Bank 2024 Consumer Spending Index, N=1,510). KPMG: shift toward value-first behavior and deliberate spending.
Cutback 5 The Sacred Items: What People Refuse to Cut
Cut: Almost nothing in this category — these are the protected spend. | Kept: Pet care (71%), daily treats, wellness, core relationships.The most revealing finding in the PYMNTS Intelligence 2026 survey is not what people cut but what they refused to cut despite significant financial pressure. 71% of consumers held onto pet care. 59% held onto dining out and food delivery. KPMG’s Julia Wilson observed: ‘Wellness is evolving, not disappearing.’ These protected categories reveal something important about how people navigate financial pressure: the things that provide emotional sustenance, connection, and a sense of normal life are the last to go. Pet care is the most striking example. In a survey where 79% of Pressure-Driven Cutback Consumers reported cutting everyday spending, 71% still held onto pet care. The emotional relationship with a pet, and the responsibility that comes with it, outweighs the financial calculation. The PYMNTS analysis frames this as the human side of the cutback economy: ‘Even in the Cutback Economy, consumers are protecting the things that make daily life feel like more than just getting by.’ For many households, the dining out that remains is not indulgence for its own sake. It is the birthday dinner that still happens, the Sunday brunch that marks the rhythm of the week, the Friday takeaway that signals the end of a hard five days. These purchases are not financially irrational. They are the minimum viable quality of life that people are determined to protect.
71% of consumers held onto pet care despite cost-of-living pressure (PYMNTS 2026, N=2,283). 59% held onto dining out and food delivery. KPMG: 'Wellness is evolving, not disappearing.' PYMNTS framing: protecting the things that 'make daily life feel like more than just getting by.
Cut vs Keep: The Master Comparison Table
Sources: PYMNTS Intelligence 2026 (N=2,283); KPMG Consumer Pulse Summer 2025; Leger/WIN May 2025; TD Bank 2024; AP-NORC 2025; PwC 2025; Statista. Not financial advice.
The UK Picture: Different Numbers, Same Squeeze
The cutback economy is not uniquely American. UK consumers have been navigating their own version of the same squeeze, shaped by their specific cost drivers: energy prices that surged dramatically in 2022-2023, mortgage rate increases that followed the Bank of England’s rate hiking cycle, and food inflation that exceeded 19% at its 2023 peak before easing. Statista’s premium data tracks British adults reporting cost of living increases continuously from 2021 through 2026. The pattern of what UK consumers cut and protect broadly mirrors the American data, with some notable differences in emphasis. UK-specific cuts have been particularly pronounced in: energy usage reduction (turning down thermostats, fewer appliance cycles, LED lighting upgrades driven by bill anxiety); the shift from branded to supermarket own-brand across almost every food category; reduction in takeaway frequency; and downgrading of holidays from abroad to domestic. UK consumers have also protected their pets, their core social rituals, and the occasional small treat with a ferocity that mirrors PYMNTS’s American findings. The psychological dynamic is identical even if the numbers differ: under financial pressure, people protect the things that make their lives feel like lives rather than mere survival exercises. The BoE base rate of 3.75% as of September 2026, combined with the September 2026 CPI of 3.70%, means UK savers with money in competitive accounts are in slightly better shape relative to inflation than a year ago — but the cumulative effect of four years of above-target inflation has permanently reset spending expectations.Conclusion
The PYMNTS Intelligence framing of the cutback economy is the most honest summary of what the data shows: ‘Even in the Cutback Economy, consumers are protecting the things that make daily life feel like more than just getting by.’ The 71% who kept pet care despite cutting everywhere else are not being financially reckless. They are making a human decision about what is non-negotiable. The 59% who held onto dining out and food delivery despite significant pressure are not ignoring the economy. They are deciding that the occasional restaurant meal is part of a life worth living, not a luxury they can’t justify. What the data from PYMNTS (2,283 consumers, 2026), KPMG (Summer 2025), Leger/WIN (May 2025), TD Bank (1,510 consumers, 2024), AP-NORC (2025), and Statista collectively shows is a population making difficult, deliberate trade-offs — not surrendering entirely, not pretending nothing has changed. The cutback economy is characterised by something that financial data alone cannot fully capture: the negotiation between what a household can afford and what a household is willing to give up. Those are related calculations but they are not the same one. The things people cut reveal what they valued least. The things they protect reveal what they cannot imagine living without.Frequently Asked Questions
What percentage of Americans are currently cutting back on spending?Multiple 2025-2026 surveys converge on a consistent picture. PYMNTS Intelligence's 2026 survey of 2,283 US consumers found that 66% of consumers facing cost-of-living challenges cut everyday spending, up four points since October, with 79% of the most financially pressured group cutting everyday spending and 62% avoiding big purchases. Leger/WIN World Survey (May 2025) found 45% of Americans had already reduced expenses and 28% were planning to — a combined 73%. KPMG's Consumer Pulse (Summer 2025) found 50% of shoppers cutting back overall. AP-NORC's 2025 holiday poll found about half cutting back on non-essential purchases. The consistent finding across all surveys: the majority of Americans are making some form of spending reduction. Only 19% in the Leger survey had no plans to cut back at all.
What are people cutting back on most right now?
The categories with the most widespread reported cuts are: non-essential purchases broadly (around 50% cutting, multiple surveys); subscription and contract reviews (two thirds planned to cut per Statista Global Consumer Survey); holiday gifts and décor (PwC 2025 Holiday Outlook: 5% budget decline, first drop since 2020); clothing and apparel (among top planned cutbacks per Statista; shift to thrift stores per KPMG 2025); restaurant and food delivery frequency (reduced but not eliminated — 59% of Pressure-Driven consumers still holding on per PYMNTS 2026); and daily treat frequency (coffee shops, takeaways). The consistent pattern: people cut frequency and tier before eliminating categories entirely.
Why are people keeping pet care despite cutting other things?
PYMNTS Intelligence's 2026 survey found that 71% of consumers held onto pet care even among the most financially pressured group — the highest retention rate of any discretionary category measured. The explanation appears to be a combination of emotional obligation and the irreversibility of the decision: a pet requires ongoing care regardless of financial circumstances, and the emotional bond makes reducing that care feel unconscionable to most pet owners. PYMNTS's framing is accurate: even in the cutback economy, people protect 'the things that make daily life feel like more than just getting by.' Pet care falls into the category of purchases that are psychologically near-non-negotiable regardless of their discretionary economic status.
Is the grocery bill actually going up or are people just spending less?
Both are true simultaneously. Grocery spending is going up in dollar terms because prices are rising — TD Bank's 2024 Consumer Spending Index found 50% of respondents said their spending increased most on groceries, and 58% say they spend the most money on groceries monthly. At the same time, people are changing what they buy: switching from branded to own-brand products, cutting back on premium and organic ranges, and meal-planning around sales rather than preferences. PYMNTS 2026 warns that grocery inflation could reach 4%-4.5% by year-end 2026. KPMG's Consumer Pulse confirmed shoppers are cutting across nearly all categories except groceries. The grocery bill is the one category where the cutback is happening within the bill rather than to it.
Are these cutbacks temporary or are they permanent behaviour changes?
The data cannot definitively answer this — but several indicators suggest the changes are more durable than previous cycles. Statista Q + We Are Social's April 2023 survey found only 11% of Americans had not changed their behaviour at all in response to inflation, showing near-universal adjustment. KPMG's 2025 consumer framing — 'consumers are not just spending less, they're spending smarter' — suggests some of the behavioural changes (subscription auditing, value-first shopping, thrift store adoption) have utility beyond the specific inflationary period that triggered them. The shift to supermarket own-brands and thrift stores historically shows lasting stickiness once established. However, the categories people most want to return to (dining out, entertainment, big purchases) are also the ones they are most actively deferring rather than abandoning permanently.
0 Comments
Be the first to share your thoughts on this article.