

Finance
Capitalism vs Socialism: What the Data Says

Pure capitalism and pure socialism both exist nowhere. Every functioning economy on earth is a mixture — the debate is about the degree. The data shows something more interesting than either ideological tribe typically admits: the world’s happiest countries combine free markets with the largest welfare states. The world’s most unequal developed nation is also its wealthiest by GDP per capita. The world’s most market-oriented economies generate the most innovation. And the world’s most socialist-leaning command economies have often produced humanitarian crises. This article presents the genuine evidence on both sides — and then presents the data that complicates both narratives. This is Not financial or political advice.
What actually exist in the world are mixed economies across a spectrum: from highly market-oriented economies like Singapore, the United States, and the UK, to social democratic welfare states like Denmark, Sweden, and Finland, to state-directed hybrid economies like China, to heavily state-controlled systems like Cuba and North Korea. Venezuela attempted democratic socialism and collapsed. The Nordic countries run comprehensive welfare states with highly competitive private market economies. The US runs market capitalism with a substantial public sector.
The debate about ‘which is better’ therefore depends entirely on: which outcomes you prioritise (GDP, equality, happiness, innovation, freedom, health), which time horizon you use, and which comparison you make. This article presents the data for each outcome category and lets the evidence speak. Not political advice.
Key definitions for this analysis: Capitalism = private ownership, market prices, profit motive. Socialism = collective/state ownership, planning over markets. Mixed economy = varying combinations of both, which describes all real-world economies. Social democracy (Nordic model) = market capitalism with high taxation and comprehensive welfare state — NOT the same as Marxist socialism. The OECD, Fraser Institute, and Heritage Foundation measure 'economic freedom' (degree of market vs state) and cross-reference against outcomes. All comparisons in this article use this spectrum approach, not a binary.
Innovation is the strongest card in capitalism’s empirical hand. Market economies generate innovation through the profit motive, intellectual property rights, and competitive pressure. The United States, the world’s largest and most open major economy, leads the world in patent filings, technology investment, pharmaceutical research, and venture capital deployment. The private sector-driven innovation ecosystems of Silicon Valley, Route 128, and other market-driven clusters have no direct equivalent in state-planned economies. Every major technology platform that dominates global communication emerged from market economies.
The productivity data supports the output argument. The US Bureau of Labor Statistics data showing US productivity at 139.3 hours per $1,000 of GDP versus Cuba’s approximately 65 hours per $1,000 reflects the core efficiency argument: market price signals allocate labour toward its highest-valued uses in ways that central planning consistently struggles to replicate. Not political advice.
The capitalism data case: (1) Economic freedom correlates with higher GDP per capita across all major indices (Fraser; Heritage). (2) Bottom 10% income in most-free countries higher than average income in least-free countries (Fraser Institute). (3) US productivity significantly higher than command economies. (4) All major global technology innovations emerged from market economies. (5) OECD nations (predominantly market economies) average $55,000 GDP per capita (IMF 2023). (6) Chile: shift toward more inclusive market policies boosted GDP 5% over a decade while reducing extreme poverty 40%. Sources: Fraser Institute Economic Freedom of the World; IMF 2023; BLS; OECD.
The public goods argument is where socialist principles produce the most durable empirical wins. Universal healthcare, universal education, childcare, and social insurance against job loss or illness are consistently better funded and more broadly available in societies that have adopted socialist principles for public goods provision. The Nordic countries, Finland’s education system (repeatedly ranked world-leading), universal healthcare systems across Europe, and universal childcare in Scandinavia represent practical applications of collective provision that produce measurable outcomes: longer healthy life expectancy, higher literacy, lower infant mortality, greater social mobility.
Cuba’s HDI score — ranking 126th globally despite a GDP per capita of approximately $10,000 — driven by universal literacy and one of the lowest infant mortality rates in the Western hemisphere, represents the strongest case for the claim that social outcomes can decouple from pure market output. This is contested data, but it is the data. Not political advice.
The socialism data case: (1) Nordic social democracies score higher on the World Happiness Report than the US: Finland 1st, Denmark 2nd vs US 15th (World Happiness Report 2025). (2) Lower Gini inequality: Denmark/Sweden 0.25; Norway/Finland 0.27 vs US 0.39 (OECD). (3) Cuba: low GDP but achieves universal literacy and low infant mortality (HDI rank 126 — challenging GDP-centric orthodoxy). (4) Denmark unemployment: 2.5% (February 2024) with comprehensive welfare state. (5) Finland: world's best education system (PISA rankings) — publicly funded. (6) Nordic countries lead on 2024 Sustainable Development Goals. Sources: OECD; World Happiness Report 2025; Per Capita UK; Cambridge 2024; UN HDI.
The question the Gini/GDP data poses is: what are you optimising for? If the goal is maximising total national output, market capitalism has a clear lead. If the goal is distributing the fruits of that output more equally while maintaining high total output, the Nordic social democratic model appears to do this successfully. If the goal is maximising equality at the cost of output (as in some command socialist economies), neither objective is achieved optimally.
The World Inequality Lab’s 2024 report introduced ‘opportunity gaps’ as a metric — measuring access to education, healthcare, and credit — and found that some high-GDP countries perform poorly on opportunity even while producing high total output. The US scores lower on social mobility metrics (the ability to move from a lower income bracket to a higher one) than most Nordic countries, despite having more total wealth to climb through. Not political advice.
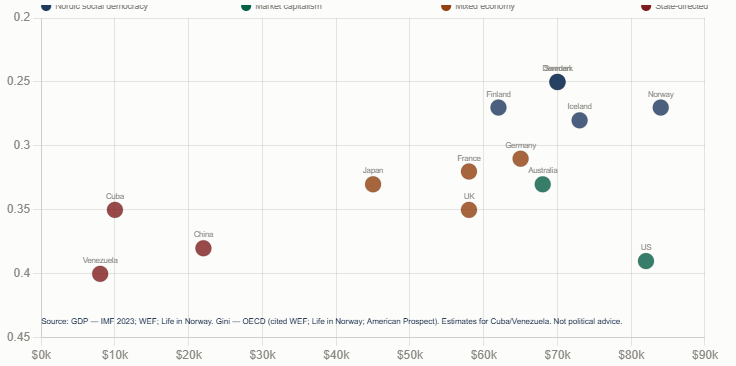
The GDP/Gini paradox: the US has the highest GDP per capita of any large nation (~$80,000+) AND a Gini coefficient of 0.39 — the highest income inequality of any OECD country. Nordic countries have GDP per capita of $60,000-$80,000 (lower than US, but close) AND Gini coefficients of 0.25-0.28 — the most equal in the OECD. This means the GDP difference between the US and Nordic countries is modest (Norway is actually 3% ABOVE the US in GDP per capita), but the inequality difference is very large. The question is whether the higher inequality of market capitalism is an acceptable trade-off for the same or marginally higher output. Sources: OECD; WEF; Life in Norway.
The Nordic countries are not socialist in the Marxist sense. They have private property, stock markets, free trade, and competitive markets. What they have that differs from the US model is: very high unionisation rates (52–81%; American Prospect), wages set by collective bargaining rather than minimum wage laws, very high social spending (Finland government expenditure approximately 57-58% of GDP vs US approximately 37%), comprehensive universal public services, and some of the highest individual tax rates in the world.
The American Prospect notes the historical explanation: ‘Yes, the Nordic nations are capitalist social democracies, but the reason they are capitalist is that their Social Democratic parties created unprecedented levels of worker power, social welfare and income equality as far back as the 1930s, and had the power to maintain those levels to this very day.’ The model is market capitalism + very strong unions + very high social spending — not state ownership. Not political advice.
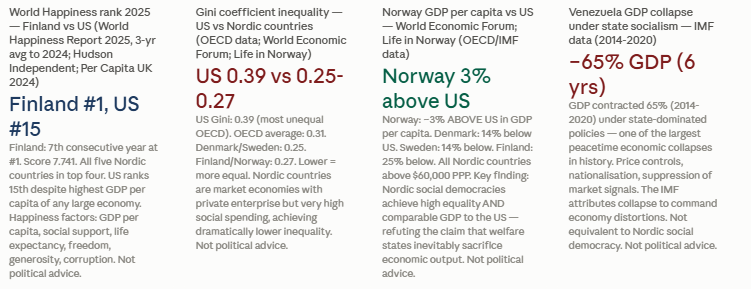
Nordic countries vs US key metrics (OECD; WEF; World Happiness Report 2025; Cambridge 2024): Gini: Denmark 0.25 / Sweden 0.25 / Finland 0.27 / Norway 0.27 / US 0.39. GDP per capita: Norway 3% ABOVE US; Denmark 14% below; Sweden 14% below; Finland 25% below. World Happiness rank: Finland 1st / Denmark 2nd / Iceland 3rd / Sweden 4th / US 15th. UN HDI: Norway 1st / Denmark 5th / US (not top 5). Corruption: Denmark, Finland, Norway, Sweden among world's six least corrupt. Gender equality: Iceland 1st for 15 years; US 49th. Democracy: Norway most democratic for 14 consecutive years.
The happiness data is where the Nordic model’s empirical case is strongest and most difficult to dismiss. Finland has topped the World Happiness Report for seven consecutive years despite having a GDP per capita approximately 25% below the United States. The factors driving Finland’s happiness score are primarily the non-GDP components: social support (strong welfare state, universal healthcare, childcare), freedom to make life choices (the security that a comprehensive welfare state provides), low perceptions of corruption, and generosity. These are, in aggregate, the outputs of social democratic policy.
The happiness index does not resolve the philosophical debate, but it directly challenges the claim that higher GDP automatically produces better lives. A Finnish citizen with 25% less GDP per capita than their American counterpart reports significantly higher life satisfaction on every survey that captures this question. Per Capita UK’s March 2024 analysis quotes Jon Clifton, CEO of Gallup: the World Happiness Report attempts to ‘bridge the gap between what governments measure and what people actually care about.’ Not political advice.
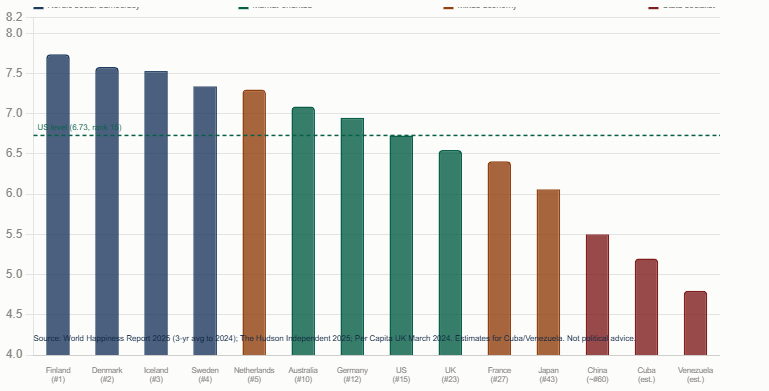
World Happiness Report 2025 (three-year average up to 2024; The Hudson Independent 2025): Finland 1st (7th consecutive year), Denmark 2nd, Iceland 3rd, Sweden 4th, Netherlands 5th, US 15th. Factors scored: GDP per capita, social support, healthy life expectancy, freedom to make life choices, generosity, perceptions of corruption. Finland's score: 7.741. The top five are all Nordic or Northern European countries with high-welfare, high-tax market economies. The US ranks 15th despite having the highest GDP per capita of any large country.
A 2024 McKinsey study of 15 OECD countries found that hybrid models (market economies with significant public investment) allocated 18% more capital to productivity-enhancing sectors (R&D, green technology) versus pure market or state monopoly systems. This is a nuanced finding: neither pure capitalism nor pure state control produces optimal innovation investment. The most innovative countries combine strong market incentives with significant public research funding — the US National Institutes of Health, for example, publicly funds foundational medical research that private pharmaceuticals then commercialise.
The Nordic countries are not innovation laggards: Denmark has led the world in sustainable business practices, Finland’s Nokia was once the world’s leading mobile phone manufacturer, and Sweden produces global companies (Spotify, H&M, IKEA, Volvo, Ericsson) despite its high-tax welfare state. The innovation argument for pure free markets is real but more nuanced than a simple market/state dichotomy suggests. Not political advice.
Cuba’s case is more contested. Its HDI rank of 126th — driven by universal literacy and healthcare outcomes — represents a genuine social achievement under severe constraints. But its GDP per capita of approximately $10,000 reflects decades of economic stagnation and Soviet-era central planning. The combination of the US embargo and internal state planning makes isolating the causal factors difficult, but economists generally assess central planning as the primary constraint on Cuba’s economic development.
The Soviet Union’s economic performance tells a similar story at scale: rapid industrialisation in the early Soviet period, followed by decades of stagnation, innovation deficits, and eventual collapse. Centrally planned allocation of resources consistently produced misallocation over time — the absence of price signals meant the system could not efficiently determine where resources were most needed. Not political advice.
The cautionary tale data: Venezuela: GDP contracted 65% (2014-2020) under state socialist policies — one of the largest peacetime economic collapses (IMF). The Soviet Union: early growth followed by stagnation and collapse; central planning produced chronic misallocation. Cuba: achieves social outcomes (literacy, infant mortality) above its income level but cannot generate the economic growth of market economies. KEY NUANCE: these failures of 'socialist' command economies should not be conflated with the Nordic social democratic model, which is a market economy with a large welfare state — a fundamentally different system with fundamentally different outcomes.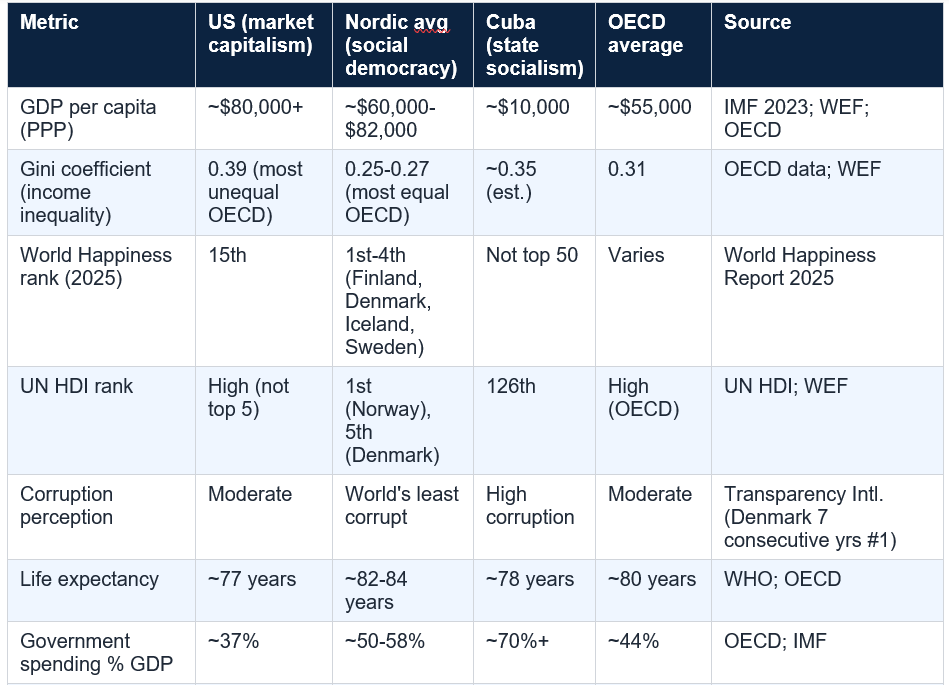
The debate, properly framed, is not capitalism or socialism but which mix of market and state produces the best outcomes — and for whom. The McKinsey 2024 finding that hybrid models allocate 18% more capital to R&D and green technology than pure market or pure state systems suggests that the optimal point on the spectrum may lie somewhere between the poles. The OECD’s 2024 Trust in Institutions Index found that nations with ‘balanced systems — where public services are robust but markets remain dynamic’ report 30% higher cross-sector investment.
The Nordic countries, which sit at approximately the midpoint of the economic freedom spectrum in terms of market competition and private ownership but at the high end of social spending, consistently outperform both pure market economies and command economies on the wellbeing indicators most people actually care about. Not political advice.
The strongest counterargument to socialism’s appeal is the body count of failed experiments. The Soviet Union, Maoist China, the Cultural Revolution, the Great Leap Forward, Cambodia under the Khmer Rouge, and Venezuela all represent cases where attempts at comprehensive state control of economic life produced human suffering at scale. This is not merely a historical argument — it raises genuine questions about whether the concentration of economic and political power in the state creates conditions for abuse that markets, by distributing economic power more widely, partially prevent.
The most intellectually honest position, supported by the available evidence, is that the question is not ‘which system is better’ but ‘which combination of market and state, in which institutional context, produces the best outcomes for the most people’ — and that the answer varies by historical context, institutional quality, culture, and what outcomes you prioritise. Not political advice.
The failure of many developing countries’ experiments with both capitalism and socialism has often been explained primarily by institutional weakness: without rule of law and control of corruption, market capitalism produces oligarchy rather than broad prosperity, and state planning produces kleptocracy rather than redistribution. This is why simply transplanting either system from one country to another does not produce reliable outcomes — the institutional context shapes the outcomes as much as the economic system itself.
Venezuela is a case study: a country that had market capitalism (in the oil era) that failed to distribute its wealth broadly due to institutional weakness, then swung to state socialism, which compounded the institutional problems rather than solving them. The Nordic model works partly because it was built in societies that had already developed high-trust institutions, strong rule of law, and democratic accountability. Not political advice.
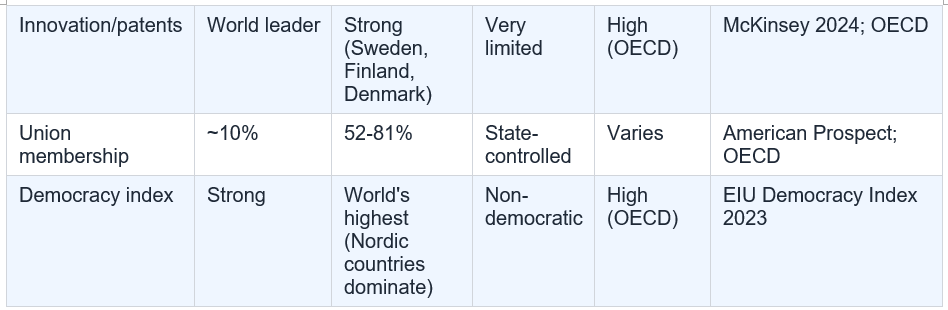
The Nordic model makes the most compelling empirical case for what the optimal mixture looks like in a high-income democracy: competitive market economies generating high output, combined with very high social spending, strong unions, and comprehensive public services. The result is the world’s highest happiness scores, lowest inequality, lowest corruption, strongest democracy, and comparable or close to comparable GDP per capita to the United States. The trade-off is high taxes and a larger state.
Neither capitalism’s champions nor socialism’s advocates can fully claim the Nordic evidence for their side: the Nordic countries are market economies that refute the claim that large welfare states inevitably collapse, and they are welfare states that refute the claim that market freedom automatically produces equal outcomes. The evidence points toward a debate about the optimal mixture — not a binary choice. Not political advice. The debate about which mix is right is a legitimate political question that voters and policymakers, not economists, ultimately resolve.
No country is purely either. All functioning economies are mixed. The most market-oriented economies include Singapore, Hong Kong, the US, and the UK (per Heritage Foundation and Fraser Institute economic freedom indices). The Nordic countries (Denmark, Finland, Iceland, Norway, Sweden) are social democracies — market economies with very high social spending and strong welfare states. Cuba and North Korea have the most state-controlled (socialist-leaning) economies. China is a hybrid: state control of key sectors with private enterprise in others. Venezuela attempted democratic socialism and experienced a 65% GDP collapse from 2014-2020. The academic consensus is that the relevant question is not which pure system is better, but which mix of market and state produces the best outcomes in a given context.
Why are Nordic countries so happy if they are not purely capitalist?
The Nordic countries (Finland, Denmark, Iceland, Sweden) have ranked in the top four of the World Happiness Report for multiple consecutive years. The 2025 World Happiness Report (using a three-year average up to 2024) ranks Finland 1st (seventh consecutive year), Denmark 2nd, Iceland 3rd, Sweden 4th — all above the US at 15th. The happiness scores reflect not just GDP per capita but social support, healthy life expectancy, freedom to make life choices, low corruption, and generosity — all areas where the Nordic welfare state model scores very highly. Nordic countries are market economies (not state socialist), but they run very large welfare states funded by high taxes on market income. Their institutional quality — lowest corruption, most democratic, strongest rule of law — is a key enabler of this model. Sources: World Happiness Report 2025 (The Hudson Independent 2025; Per Capita UK 2024); World Economic Forum; Cambridge University Press 2024.
What does the Gini coefficient show about capitalism vs socialism?
The Gini coefficient measures income inequality (0 = perfect equality; 1 = complete inequality). OECD data shows: US = 0.39 (most unequal in OECD); OECD average = 0.31; Denmark = approximately 0.25; Sweden = approximately 0.25; Finland = approximately 0.27; Norway = approximately 0.27. The Nordic social democracies have significantly lower income inequality than the US, despite being market economies with private property and free trade. Their lower Gini scores result from very high social spending, strong union-negotiated wages, and comprehensive public services. This data is often cited in the socialism argument — that market capitalism naturally produces high inequality — but the Nordic counterexample shows that market economies can maintain low inequality with appropriate redistribution. The question the Gini data raises is not capitalism vs socialism but the degree of redistribution built into a market economy. Sources: OECD (cited World Economic Forum; Life in Norway; American Prospect).
Is Venezuela proof that socialism fails?
Venezuela's GDP contracted 65% between 2014 and 2020 under state-dominated policies — one of the largest peacetime economic collapses in history. Price controls, nationalisation, and suppression of market signals produced hyperinflation, food shortages, and mass emigration. This is a powerful empirical case against comprehensive state control of economic life. However, several important qualifications apply: (1) Venezuela's institutional quality was already weak before the socialist turn — corruption, weak rule of law, and oil-dependency were pre-existing conditions that state control compounded rather than created; (2) The US economic sanctions imposed real external pressure; (3) The Venezuelan experiment should not be conflated with the Nordic social democratic model, which maintains market competition, private property, and operates in countries with very strong institutions. Most economists treat Venezuela as an example of command economy failure, not as representative of social democracy more broadly. Sources: IMF; Kiwi IRC Hub analysis citing IMF data.
What does the data say about inequality under capitalism?
The data shows a consistent pattern: more market-oriented (capitalist) economies tend to generate more total GDP, but also more income inequality, than social democratic welfare states. Key data points: US Gini coefficient = 0.39 (OECD) — highest income inequality among major OECD economies. US GDP per capita = approximately $80,000+ — highest among large economies. Nordic countries: Gini 0.25-0.27 (most equal OECD), GDP per capita $60,000-$82,000 (Norway 3% above US). The Fraser Institute's economic freedom data shows the bottom 10% in the most free-market economies earn more absolutely than those in least-free economies — but the comparison is between rich and poor countries, not within a single economic tier. Within high-income economies, the Nordic model consistently produces better outcomes for lower-income groups than pure market capitalism, while maintaining comparable total output. Sources: OECD (Gini); IMF (GDP); World Economic Forum; Fraser Institute Economic Freedom of the World.
Table of Contents
- Setting the Scene: What We Are Actually Comparing
- Capitalism’s Strongest Arguments: The Case From the Data
- Socialism’s Strongest Arguments: The Case From the Data
- The Inequality Paradox: GDP vs Gini
- The Nordic Complication: The World’s Happiest Countries
- The Happiness Data: What the World Happiness Report Shows
- Innovation, Productivity, and Who Drives Growth
- The Cautionary Tales: Venezuela, Cuba, and Command Economies
- The Comparison Table: Key Metrics Across Systems
- The Real World: No Country Is Purely Either
- The Strongest Counterarguments on Both Sides
- What Determines Which Works: The Institutional Variable
- Conclusion: The Evidence Supports a Different Question
- Frequently Asked Questions
Happiness vs economic system — World Happiness Report 2025
GDP vs inequality — the output/equality trade-off
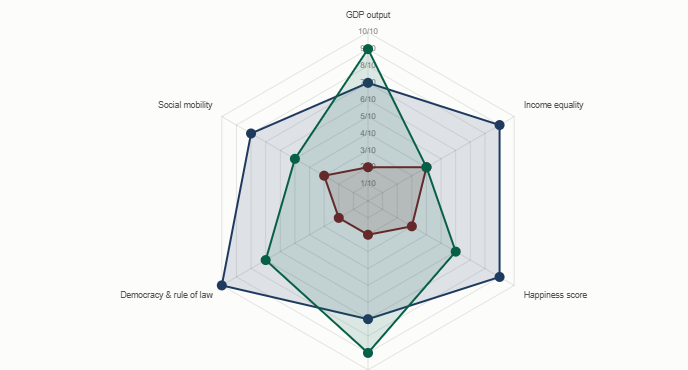
Country comparison — key metrics across systems
Setting the Scene: What We Are Actually Comparing
The capitalism vs socialism debate is one of the most contested in political economy, and it is almost always conducted with imprecise definitions. Capitalism, at its core, means private ownership of the means of production, market-based price signals, and the profit motive driving resource allocation. Socialism, at its core, means social or collective ownership of the means of production, with resource allocation guided by planning rather than markets. In pure form, neither has ever been fully implemented.What actually exist in the world are mixed economies across a spectrum: from highly market-oriented economies like Singapore, the United States, and the UK, to social democratic welfare states like Denmark, Sweden, and Finland, to state-directed hybrid economies like China, to heavily state-controlled systems like Cuba and North Korea. Venezuela attempted democratic socialism and collapsed. The Nordic countries run comprehensive welfare states with highly competitive private market economies. The US runs market capitalism with a substantial public sector.
The debate about ‘which is better’ therefore depends entirely on: which outcomes you prioritise (GDP, equality, happiness, innovation, freedom, health), which time horizon you use, and which comparison you make. This article presents the data for each outcome category and lets the evidence speak. Not political advice.
Key definitions for this analysis: Capitalism = private ownership, market prices, profit motive. Socialism = collective/state ownership, planning over markets. Mixed economy = varying combinations of both, which describes all real-world economies. Social democracy (Nordic model) = market capitalism with high taxation and comprehensive welfare state — NOT the same as Marxist socialism. The OECD, Fraser Institute, and Heritage Foundation measure 'economic freedom' (degree of market vs state) and cross-reference against outcomes. All comparisons in this article use this spectrum approach, not a binary.
Capitalism’s Strongest Arguments: The Case From the Data
The empirical case for capitalism’s superiority in generating economic output is substantial. Countries with greater economic freedom tend to have higher GDP per capita — a consistent finding across Fraser Institute and Heritage Foundation indices over multiple decades. The Fraser Institute’s Economic Freedom of the World report found that nations in the top quartile of economic freedom had an average per-capita GDP of $32,744 (in 2005 international dollars) compared to $3,858 for those in the bottom quartile. The average income of the poorest 10% in the most-free quartile ($8,474) was higher than the average income of the poorest 10% in the least-free quartile ($910).Innovation is the strongest card in capitalism’s empirical hand. Market economies generate innovation through the profit motive, intellectual property rights, and competitive pressure. The United States, the world’s largest and most open major economy, leads the world in patent filings, technology investment, pharmaceutical research, and venture capital deployment. The private sector-driven innovation ecosystems of Silicon Valley, Route 128, and other market-driven clusters have no direct equivalent in state-planned economies. Every major technology platform that dominates global communication emerged from market economies.
The productivity data supports the output argument. The US Bureau of Labor Statistics data showing US productivity at 139.3 hours per $1,000 of GDP versus Cuba’s approximately 65 hours per $1,000 reflects the core efficiency argument: market price signals allocate labour toward its highest-valued uses in ways that central planning consistently struggles to replicate. Not political advice.
The capitalism data case: (1) Economic freedom correlates with higher GDP per capita across all major indices (Fraser; Heritage). (2) Bottom 10% income in most-free countries higher than average income in least-free countries (Fraser Institute). (3) US productivity significantly higher than command economies. (4) All major global technology innovations emerged from market economies. (5) OECD nations (predominantly market economies) average $55,000 GDP per capita (IMF 2023). (6) Chile: shift toward more inclusive market policies boosted GDP 5% over a decade while reducing extreme poverty 40%. Sources: Fraser Institute Economic Freedom of the World; IMF 2023; BLS; OECD.
Socialism’s Strongest Arguments: The Case From the Data
Socialism’s empirical case is strongest where capitalism’s weakest: inequality, public goods provision, and the metrics of wellbeing that GDP does not capture. The US Gini coefficient is 0.39 — significantly above the OECD average of 0.31 (OECD data, World Economic Forum). Despite having the world’s highest GDP per capita among large nations, the United States has 24% of its adults unable to cover a $1,000 emergency (Bankrate, cited in session data). The GDP number exists simultaneously with extensive poverty, high healthcare costs, and inequality that Nordic countries — with comparable or slightly lower GDP per capita — do not experience at the same scale.The public goods argument is where socialist principles produce the most durable empirical wins. Universal healthcare, universal education, childcare, and social insurance against job loss or illness are consistently better funded and more broadly available in societies that have adopted socialist principles for public goods provision. The Nordic countries, Finland’s education system (repeatedly ranked world-leading), universal healthcare systems across Europe, and universal childcare in Scandinavia represent practical applications of collective provision that produce measurable outcomes: longer healthy life expectancy, higher literacy, lower infant mortality, greater social mobility.
Cuba’s HDI score — ranking 126th globally despite a GDP per capita of approximately $10,000 — driven by universal literacy and one of the lowest infant mortality rates in the Western hemisphere, represents the strongest case for the claim that social outcomes can decouple from pure market output. This is contested data, but it is the data. Not political advice.
The socialism data case: (1) Nordic social democracies score higher on the World Happiness Report than the US: Finland 1st, Denmark 2nd vs US 15th (World Happiness Report 2025). (2) Lower Gini inequality: Denmark/Sweden 0.25; Norway/Finland 0.27 vs US 0.39 (OECD). (3) Cuba: low GDP but achieves universal literacy and low infant mortality (HDI rank 126 — challenging GDP-centric orthodoxy). (4) Denmark unemployment: 2.5% (February 2024) with comprehensive welfare state. (5) Finland: world's best education system (PISA rankings) — publicly funded. (6) Nordic countries lead on 2024 Sustainable Development Goals. Sources: OECD; World Happiness Report 2025; Per Capita UK; Cambridge 2024; UN HDI.
The Inequality Paradox: GDP vs Gini
The central empirical tension in the capitalism vs socialism debate is the GDP/Gini paradox: the most market-oriented large economies generate the most total output, but also the most inequality. The US is the richest large country in the world by GDP per capita but has a Gini coefficient of 0.39 — above the OECD average of 0.31 and significantly above the Nordic countries at 0.25–0.28. The Nordic countries, which run large welfare states funded by high taxes on market-generated income, achieve substantially greater equality (lower Gini) than the US while maintaining similar or slightly lower total output.The question the Gini/GDP data poses is: what are you optimising for? If the goal is maximising total national output, market capitalism has a clear lead. If the goal is distributing the fruits of that output more equally while maintaining high total output, the Nordic social democratic model appears to do this successfully. If the goal is maximising equality at the cost of output (as in some command socialist economies), neither objective is achieved optimally.
The World Inequality Lab’s 2024 report introduced ‘opportunity gaps’ as a metric — measuring access to education, healthcare, and credit — and found that some high-GDP countries perform poorly on opportunity even while producing high total output. The US scores lower on social mobility metrics (the ability to move from a lower income bracket to a higher one) than most Nordic countries, despite having more total wealth to climb through. Not political advice.
The GDP/Gini paradox: the US has the highest GDP per capita of any large nation (~$80,000+) AND a Gini coefficient of 0.39 — the highest income inequality of any OECD country. Nordic countries have GDP per capita of $60,000-$80,000 (lower than US, but close) AND Gini coefficients of 0.25-0.28 — the most equal in the OECD. This means the GDP difference between the US and Nordic countries is modest (Norway is actually 3% ABOVE the US in GDP per capita), but the inequality difference is very large. The question is whether the higher inequality of market capitalism is an acceptable trade-off for the same or marginally higher output. Sources: OECD; WEF; Life in Norway.
The Nordic Complication: The World’s Happiest Countries
The Nordic countries — Denmark, Finland, Iceland, Norway, and Sweden — represent the most inconvenient data point for both ideological camps. For capitalism’s strongest advocates, they demonstrate that market economies can sustain large welfare states without collapsing — and may actually produce better outcomes for citizens when they do. For socialism’s strongest advocates, they demonstrate that the path to high social outcomes runs through productive market economies, not state ownership of the means of production.The Nordic countries are not socialist in the Marxist sense. They have private property, stock markets, free trade, and competitive markets. What they have that differs from the US model is: very high unionisation rates (52–81%; American Prospect), wages set by collective bargaining rather than minimum wage laws, very high social spending (Finland government expenditure approximately 57-58% of GDP vs US approximately 37%), comprehensive universal public services, and some of the highest individual tax rates in the world.
The American Prospect notes the historical explanation: ‘Yes, the Nordic nations are capitalist social democracies, but the reason they are capitalist is that their Social Democratic parties created unprecedented levels of worker power, social welfare and income equality as far back as the 1930s, and had the power to maintain those levels to this very day.’ The model is market capitalism + very strong unions + very high social spending — not state ownership. Not political advice.
Nordic countries vs US key metrics (OECD; WEF; World Happiness Report 2025; Cambridge 2024): Gini: Denmark 0.25 / Sweden 0.25 / Finland 0.27 / Norway 0.27 / US 0.39. GDP per capita: Norway 3% ABOVE US; Denmark 14% below; Sweden 14% below; Finland 25% below. World Happiness rank: Finland 1st / Denmark 2nd / Iceland 3rd / Sweden 4th / US 15th. UN HDI: Norway 1st / Denmark 5th / US (not top 5). Corruption: Denmark, Finland, Norway, Sweden among world's six least corrupt. Gender equality: Iceland 1st for 15 years; US 49th. Democracy: Norway most democratic for 14 consecutive years.
The Happiness Data: What the World Happiness Report Shows
The World Happiness Report, published annually since 2012 and based on Gallup World Poll data, measures happiness across six factors: GDP per capita, social support, healthy life expectancy, freedom to make life choices, generosity, and perceptions of corruption. The 2025 report (using a three-year average up to 2024) ranks Finland 1st for the seventh consecutive year, Denmark 2nd, Iceland 3rd, Sweden 4th, Netherlands 5th. The United States ranks 15th (World Economic Forum; The Hudson Independent 2025).The happiness data is where the Nordic model’s empirical case is strongest and most difficult to dismiss. Finland has topped the World Happiness Report for seven consecutive years despite having a GDP per capita approximately 25% below the United States. The factors driving Finland’s happiness score are primarily the non-GDP components: social support (strong welfare state, universal healthcare, childcare), freedom to make life choices (the security that a comprehensive welfare state provides), low perceptions of corruption, and generosity. These are, in aggregate, the outputs of social democratic policy.
The happiness index does not resolve the philosophical debate, but it directly challenges the claim that higher GDP automatically produces better lives. A Finnish citizen with 25% less GDP per capita than their American counterpart reports significantly higher life satisfaction on every survey that captures this question. Per Capita UK’s March 2024 analysis quotes Jon Clifton, CEO of Gallup: the World Happiness Report attempts to ‘bridge the gap between what governments measure and what people actually care about.’ Not political advice.
World Happiness Report 2025 (three-year average up to 2024; The Hudson Independent 2025): Finland 1st (7th consecutive year), Denmark 2nd, Iceland 3rd, Sweden 4th, Netherlands 5th, US 15th. Factors scored: GDP per capita, social support, healthy life expectancy, freedom to make life choices, generosity, perceptions of corruption. Finland's score: 7.741. The top five are all Nordic or Northern European countries with high-welfare, high-tax market economies. The US ranks 15th despite having the highest GDP per capita of any large country.
Innovation, Productivity, and Who Drives Growth
The clearest empirical win for market capitalism is in innovation and productivity growth. Every major technology platform that shapes the 21st-century economy — search engines, social media, smartphones, electric vehicles, cloud computing, AI — was developed in market-driven economies, primarily the United States. The profit motive, venture capital, intellectual property rights, and competitive pressure between firms have produced an innovation velocity that centrally planned economies have not matched.A 2024 McKinsey study of 15 OECD countries found that hybrid models (market economies with significant public investment) allocated 18% more capital to productivity-enhancing sectors (R&D, green technology) versus pure market or state monopoly systems. This is a nuanced finding: neither pure capitalism nor pure state control produces optimal innovation investment. The most innovative countries combine strong market incentives with significant public research funding — the US National Institutes of Health, for example, publicly funds foundational medical research that private pharmaceuticals then commercialise.
The Nordic countries are not innovation laggards: Denmark has led the world in sustainable business practices, Finland’s Nokia was once the world’s leading mobile phone manufacturer, and Sweden produces global companies (Spotify, H&M, IKEA, Volvo, Ericsson) despite its high-tax welfare state. The innovation argument for pure free markets is real but more nuanced than a simple market/state dichotomy suggests. Not political advice.
The Cautionary Tales: Venezuela, Cuba, and Command Economies
The strongest empirical case against socialist economic systems comes from the outcomes of heavily state-directed economies. Venezuela’s GDP contracted 65% between 2014 and 2020 under state-dominated socialist policies — one of the largest peacetime economic collapses in history. Price controls, nationalisation of the oil sector, and suppression of market signals produced hyperinflation, food shortages, and mass emigration. The IMF and multiple economic analyses attribute the collapse to the distortions created by state control of resource allocation and price signals.Cuba’s case is more contested. Its HDI rank of 126th — driven by universal literacy and healthcare outcomes — represents a genuine social achievement under severe constraints. But its GDP per capita of approximately $10,000 reflects decades of economic stagnation and Soviet-era central planning. The combination of the US embargo and internal state planning makes isolating the causal factors difficult, but economists generally assess central planning as the primary constraint on Cuba’s economic development.
The Soviet Union’s economic performance tells a similar story at scale: rapid industrialisation in the early Soviet period, followed by decades of stagnation, innovation deficits, and eventual collapse. Centrally planned allocation of resources consistently produced misallocation over time — the absence of price signals meant the system could not efficiently determine where resources were most needed. Not political advice.
The cautionary tale data: Venezuela: GDP contracted 65% (2014-2020) under state socialist policies — one of the largest peacetime economic collapses (IMF). The Soviet Union: early growth followed by stagnation and collapse; central planning produced chronic misallocation. Cuba: achieves social outcomes (literacy, infant mortality) above its income level but cannot generate the economic growth of market economies. KEY NUANCE: these failures of 'socialist' command economies should not be conflated with the Nordic social democratic model, which is a market economy with a large welfare state — a fundamentally different system with fundamentally different outcomes.
The Comparison Table: Key Metrics Across Systems
The Real World: No Country Is Purely Either
The most important empirical observation in the capitalism vs socialism debate is one that both sides systematically ignore: no successful economy in the world today is purely either. Singapore — often cited as the world’s most free market economy — has state-owned enterprises controlling major parts of the economy, government-directed savings through the CPF, and massive public housing. The United States has Medicare, Medicaid, Social Security, public schools, the Federal Reserve, and extensive regulation. China has private enterprise and stock markets alongside state control of major sectors.The debate, properly framed, is not capitalism or socialism but which mix of market and state produces the best outcomes — and for whom. The McKinsey 2024 finding that hybrid models allocate 18% more capital to R&D and green technology than pure market or pure state systems suggests that the optimal point on the spectrum may lie somewhere between the poles. The OECD’s 2024 Trust in Institutions Index found that nations with ‘balanced systems — where public services are robust but markets remain dynamic’ report 30% higher cross-sector investment.
The Nordic countries, which sit at approximately the midpoint of the economic freedom spectrum in terms of market competition and private ownership but at the high end of social spending, consistently outperform both pure market economies and command economies on the wellbeing indicators most people actually care about. Not political advice.
The Strongest Counterarguments on Both Sides
The strongest counterargument to capitalism’s success is the question of what it leaves behind. When the Fraser Institute reports that the average income of the poorest 10% in the most-free countries ($8,474) exceeds that of the bottom quartile nationally in the least-free countries ($910), this is a meaningful finding — but it compares the richest free-market countries to the poorest centrally planned ones. The more relevant comparison is: within a rich developed economy, how are the least well-off doing? Here, the Nordic model consistently outperforms US-style capitalism on every social outcome metric.The strongest counterargument to socialism’s appeal is the body count of failed experiments. The Soviet Union, Maoist China, the Cultural Revolution, the Great Leap Forward, Cambodia under the Khmer Rouge, and Venezuela all represent cases where attempts at comprehensive state control of economic life produced human suffering at scale. This is not merely a historical argument — it raises genuine questions about whether the concentration of economic and political power in the state creates conditions for abuse that markets, by distributing economic power more widely, partially prevent.
The most intellectually honest position, supported by the available evidence, is that the question is not ‘which system is better’ but ‘which combination of market and state, in which institutional context, produces the best outcomes for the most people’ — and that the answer varies by historical context, institutional quality, culture, and what outcomes you prioritise. Not political advice.
What Determines Which Works: The Institutional Variable
Perhaps the most significant finding from comparative economics is that the quality of institutions — rule of law, property rights, corruption control, democratic accountability, judicial independence — matters more than the position on the capitalism/socialism spectrum in predicting economic outcomes. The Nordic countries score at the absolute top of every institutional quality index: lowest corruption, most democratic, highest rule of law, most equal application of law. These institutional strengths allow them to run high-spending welfare states without the rent-seeking, corruption, and misallocation that has often plagued socialist experiments in countries with weaker institutions.The failure of many developing countries’ experiments with both capitalism and socialism has often been explained primarily by institutional weakness: without rule of law and control of corruption, market capitalism produces oligarchy rather than broad prosperity, and state planning produces kleptocracy rather than redistribution. This is why simply transplanting either system from one country to another does not produce reliable outcomes — the institutional context shapes the outcomes as much as the economic system itself.
Venezuela is a case study: a country that had market capitalism (in the oil era) that failed to distribute its wealth broadly due to institutional weakness, then swung to state socialism, which compounded the institutional problems rather than solving them. The Nordic model works partly because it was built in societies that had already developed high-trust institutions, strong rule of law, and democratic accountability. Not political advice.
Conclusion
The question ‘capitalism vs socialism: which is better?’ is, on the evidence, the wrong question. The evidence points toward a different question: which combination of market mechanisms and collective provision, in which institutional context, produces the best outcomes for the broadest share of the population? The data suggests that pure market capitalism maximises total output but concentrates that output, while pure state socialism reduces inequality but at severe cost to both output and freedom. The most successful economies in the world — by almost every measure that matters to human flourishing — are mixed economies with strong institutions.The Nordic model makes the most compelling empirical case for what the optimal mixture looks like in a high-income democracy: competitive market economies generating high output, combined with very high social spending, strong unions, and comprehensive public services. The result is the world’s highest happiness scores, lowest inequality, lowest corruption, strongest democracy, and comparable or close to comparable GDP per capita to the United States. The trade-off is high taxes and a larger state.
Neither capitalism’s champions nor socialism’s advocates can fully claim the Nordic evidence for their side: the Nordic countries are market economies that refute the claim that large welfare states inevitably collapse, and they are welfare states that refute the claim that market freedom automatically produces equal outcomes. The evidence points toward a debate about the optimal mixture — not a binary choice. Not political advice. The debate about which mix is right is a legitimate political question that voters and policymakers, not economists, ultimately resolve.
Frequently Asked Questions
Which countries are capitalist and which are socialist?No country is purely either. All functioning economies are mixed. The most market-oriented economies include Singapore, Hong Kong, the US, and the UK (per Heritage Foundation and Fraser Institute economic freedom indices). The Nordic countries (Denmark, Finland, Iceland, Norway, Sweden) are social democracies — market economies with very high social spending and strong welfare states. Cuba and North Korea have the most state-controlled (socialist-leaning) economies. China is a hybrid: state control of key sectors with private enterprise in others. Venezuela attempted democratic socialism and experienced a 65% GDP collapse from 2014-2020. The academic consensus is that the relevant question is not which pure system is better, but which mix of market and state produces the best outcomes in a given context.
Why are Nordic countries so happy if they are not purely capitalist?
The Nordic countries (Finland, Denmark, Iceland, Sweden) have ranked in the top four of the World Happiness Report for multiple consecutive years. The 2025 World Happiness Report (using a three-year average up to 2024) ranks Finland 1st (seventh consecutive year), Denmark 2nd, Iceland 3rd, Sweden 4th — all above the US at 15th. The happiness scores reflect not just GDP per capita but social support, healthy life expectancy, freedom to make life choices, low corruption, and generosity — all areas where the Nordic welfare state model scores very highly. Nordic countries are market economies (not state socialist), but they run very large welfare states funded by high taxes on market income. Their institutional quality — lowest corruption, most democratic, strongest rule of law — is a key enabler of this model. Sources: World Happiness Report 2025 (The Hudson Independent 2025; Per Capita UK 2024); World Economic Forum; Cambridge University Press 2024.
What does the Gini coefficient show about capitalism vs socialism?
The Gini coefficient measures income inequality (0 = perfect equality; 1 = complete inequality). OECD data shows: US = 0.39 (most unequal in OECD); OECD average = 0.31; Denmark = approximately 0.25; Sweden = approximately 0.25; Finland = approximately 0.27; Norway = approximately 0.27. The Nordic social democracies have significantly lower income inequality than the US, despite being market economies with private property and free trade. Their lower Gini scores result from very high social spending, strong union-negotiated wages, and comprehensive public services. This data is often cited in the socialism argument — that market capitalism naturally produces high inequality — but the Nordic counterexample shows that market economies can maintain low inequality with appropriate redistribution. The question the Gini data raises is not capitalism vs socialism but the degree of redistribution built into a market economy. Sources: OECD (cited World Economic Forum; Life in Norway; American Prospect).
Is Venezuela proof that socialism fails?
Venezuela's GDP contracted 65% between 2014 and 2020 under state-dominated policies — one of the largest peacetime economic collapses in history. Price controls, nationalisation, and suppression of market signals produced hyperinflation, food shortages, and mass emigration. This is a powerful empirical case against comprehensive state control of economic life. However, several important qualifications apply: (1) Venezuela's institutional quality was already weak before the socialist turn — corruption, weak rule of law, and oil-dependency were pre-existing conditions that state control compounded rather than created; (2) The US economic sanctions imposed real external pressure; (3) The Venezuelan experiment should not be conflated with the Nordic social democratic model, which maintains market competition, private property, and operates in countries with very strong institutions. Most economists treat Venezuela as an example of command economy failure, not as representative of social democracy more broadly. Sources: IMF; Kiwi IRC Hub analysis citing IMF data.
What does the data say about inequality under capitalism?
The data shows a consistent pattern: more market-oriented (capitalist) economies tend to generate more total GDP, but also more income inequality, than social democratic welfare states. Key data points: US Gini coefficient = 0.39 (OECD) — highest income inequality among major OECD economies. US GDP per capita = approximately $80,000+ — highest among large economies. Nordic countries: Gini 0.25-0.27 (most equal OECD), GDP per capita $60,000-$82,000 (Norway 3% above US). The Fraser Institute's economic freedom data shows the bottom 10% in the most free-market economies earn more absolutely than those in least-free economies — but the comparison is between rich and poor countries, not within a single economic tier. Within high-income economies, the Nordic model consistently produces better outcomes for lower-income groups than pure market capitalism, while maintaining comparable total output. Sources: OECD (Gini); IMF (GDP); World Economic Forum; Fraser Institute Economic Freedom of the World.
0 Comments
Be the first to share your thoughts on this article.