

Finance
UK Average Net Worth by Age: How Does Your Wealth Compare?

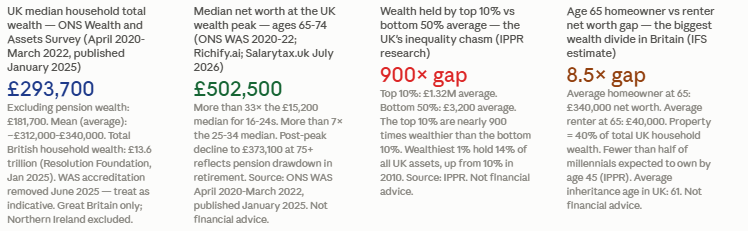
The typical British household has a net worth of £293,700. But that headline hides a story of extraordinary divergence: a 16-to-24-year-old’s household has a median wealth of £15,200; a 65-to-74-year-old’s is £502,500 — more than 33 times higher. The top 10% of households hold £1.32 million on average; the bottom 50% hold just £3,200. Every generation since the post-war baby boomers has accumulated less wealth than the one before it at the same age. And the average age at which someone receives an inheritance in the UK is now 61. This article unpacks what the ONS data actually says, what the numbers mean for each age group, and what you can realistically do about it. Not financial advice.
The ONS — the Office for National Statistics — measures household net worth through the Wealth and Assets Survey (WAS). The most recent published data covers April 2020 to March 2022, published in January 2025. It is the most comprehensive snapshot of British household wealth available. An important caveat: in June 2025, the Office for Statistics Regulation removed the WAS accreditation over falling response rates and quality concerns. The ONS is developing plans to restore the dataset. The figures should be treated as indicative rather than precise, but they remain the best available data for understanding how wealth accumulates by age in Great Britain.
Net worth matters because it determines financial resilience: the ability to survive a job loss, fund retirement, absorb an emergency, or pass something on. Understanding where you stand relative to others in your age group is not about competition — it is about context. The number will tell you whether you are broadly on track, ahead, or behind, and what that means in practical terms. Not financial advice.
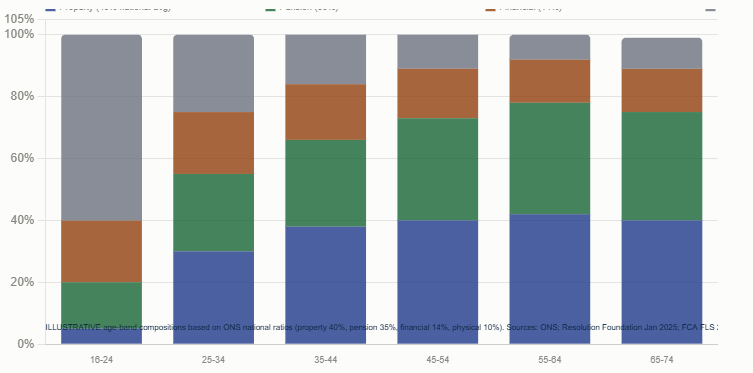
ONS Wealth and Assets Survey (April 2020-March 2022, published January 2025): median household total wealth in Great Britain £293,700. Excluding pension wealth: £181,700. Total British household wealth: £13.6 trillion (Resolution Foundation, January 2025). Net property wealth: 40% of total; private pension wealth: 35%; net financial wealth: 14%; physical wealth: 10%. Important: Office for Statistics Regulation removed WAS accreditation June 2025 -- treat figures as indicative. Northern Ireland excluded from WAS. Source: ONS.gov.uk; Salarytax.uk (retrieved July 2026); Resolution Foundation January 2025.
All net worth figures in this article are sourced from the ONS Wealth and Assets Survey (WAS), covering April 2020 to March 2022, published January 2025. This is the most recent comprehensive UK household wealth dataset available. Important caveat: in June 2025, the Office for Statistics Regulation removed the WAS accreditation over falling response rates and quality concerns. Treat the figures as indicative rather than precise benchmarks. The ONS is developing plans to improve and restore the dataset. These are household-level figures (not individual). The data covers Great Britain; Northern Ireland is excluded. Net worth figures include property, pensions, savings, investments, and physical possessions, minus all liabilities. All figures are in pounds sterling. Not financial advice.
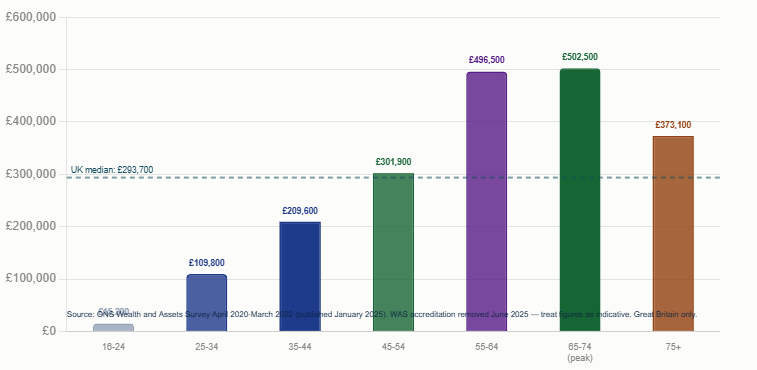
The range is striking. A household headed by someone aged 16 to 24 has a median net worth of £15,200. A household headed by someone aged 65 to 74 has a median net worth of £502,500 — more than 33 times the starting point. The jump between the 25–34 and 55–64 age bands — from £109,800 to £496,500, roughly a fivefold increase — is driven primarily by two compounding forces: the gradual elimination of mortgage debt as net property equity grows, and decades of private and workplace pension contributions compounding into a substantial retirement asset. Salarytax.uk, citing the ONS data, notes this as ‘a clear life-cycle pattern.’
The post-peak decline from £502,500 (ages 65–74) to £373,100 (ages 75+) reflects the drawdown of pension wealth in retirement. As the ONS notes: ‘After state pension age, household wealth often starts to decline as pension wealth is used in retirement.’ Not financial advice.
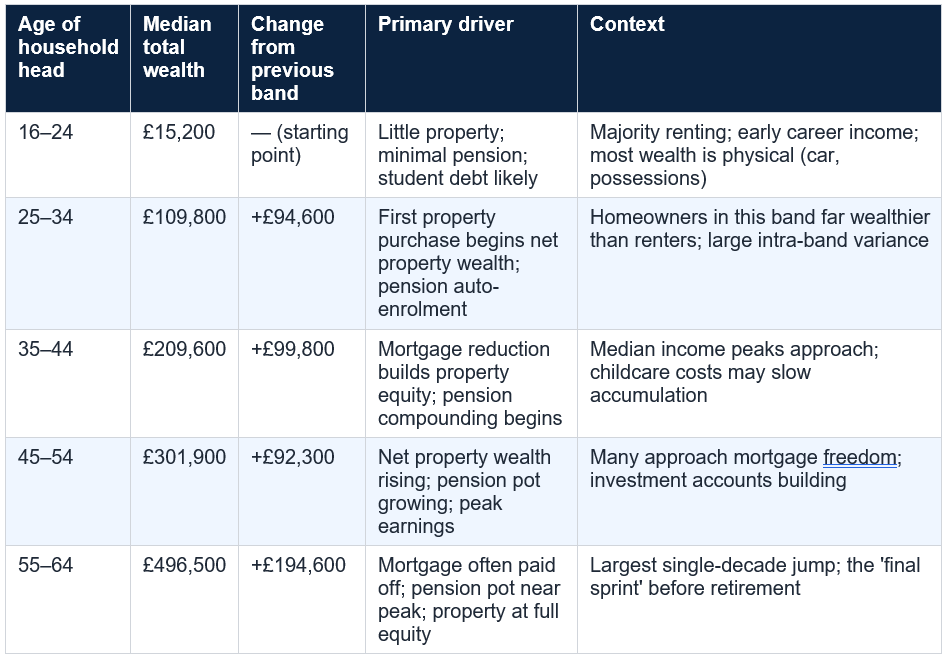

The ONS data shows that 40% of under-35s have no savings at all, and the proportion in this youngest band is higher still. Auto-enrolment in workplace pensions (mandatory for employers since 2012) means that most employed 22-year-olds are now building pension assets from their first job, which represents the most significant structural improvement in this age group’s wealth prospects compared to previous generations. But the starting net worth remains modest, and the gap to homeownership — the primary wealth-building mechanism in the UK — is large.
Ages 16-24 building blocks: (1) Maximise employer pension matching from day one -- turning down matched contributions is declining free money. (2) Open a Lifetime ISA (LISA) if planning to buy a first home: contribute up to £4,000/year and receive a 25% government bonus (£1,000/year) up to age 50. (3) Start a Stocks and Shares ISA -- even small regular contributions compound significantly over time. ISA allowance: £20,000/year (2026/27). (4) Avoid high-interest debt (credit cards, buy-now-pay-later). (5) Build an emergency fund (3-6 months of expenses) before investing. Not financial advice.
This is also the decade where the generational wealth gap is most acutely felt. People born in the 1980s have just a third of the property wealth at age 28 of those born in the 1970s (IPPR). The Resolution Foundation found that financial wealth for someone aged 25–34 increased by just £900 in real terms between the 2018–20 and 2020–22 ONS surveys, compared to £3,400 for someone aged 65–74. The wealth-building machinery in this decade — homeownership, pension contributions, and regular saving — is functioning for some; for others, high rents, student debt, and affordability barriers are preventing entry to the wealth-building system entirely.
Generational View: For 25-34-year-olds: the ONS data for this band includes both homeowners (substantially wealthier) and renters (substantially poorer). The headline £109,800 median is heavily influenced by those who have purchased property. Fewer than half of millennials are expected to own their home by age 45 on current trends (IPPR). Those who have not yet purchased a property may find their net worth considerably below the median -- this is a structural issue, not a personal failure. The Lifetime ISA, Help to Buy (now closed to new applications), and shared ownership schemes are the primary policy tools available to bridge this gap. Not financial advice.
This is also the most financially pressured decade for many households. Childcare costs — typically £1,000 to £2,000 per month per child for full-time nursery in London — compete directly with pension contributions and savings. Career progression often accelerates income during this period, but lifestyle inflation follows. The households that maintain their pension contributions and resist lifestyle creep during the 35–44 decade are those who will see the most dramatic wealth increases as they approach 55.
The IFS (Institute for Fiscal Studies) estimate that by age 65, the average UK homeowner’s net worth is £340,000 while a renter’s is just £40,000. The foundation of that 8.5x gap is typically laid in this 35–44 decade, as property equity compounds and pension contributions build. Not financial advice.
Ages 35-44 wealth levers: (1) Protect pension contributions during childcare years -- contribution breaks compound into large pension shortfalls. (2) Overpay the mortgage if financially feasible: £100/month extra on a 25-year mortgage can save £10,000+ in interest and reduce term by 3+ years (Which? cited). (3) Review and consolidate old pensions from previous employers -- small pension pots scattered across providers often have high charges. (4) Consider a Stocks and Shares ISA alongside the pension for assets accessible before age 57 (pension minimum access age rising to 57 in 2028). (5) Life insurance and income protection become important for household financial resilience in this decade. Not financial advice.
For homeowners who bought in the 1990s or 2000s at prices a fraction of today’s market values, property equity in this decade can represent the majority of total net worth. Many in this age band are approaching ‘mortgage freedom’ — either having paid off the mortgage entirely or being close to doing so — which substantially accelerates the ability to save and invest. The freed-up monthly mortgage payment, redirected to pension and ISA, can dramatically accelerate wealth in the decade from 45–54.
Auto-enrolment has been operational since 2012, meaning that 45-year-olds in 2026 who have been continuously enrolled since its introduction have had up to 14 years of employer-matched pension contributions working for them — a structural advantage over those who entered the workforce before auto-enrolment. Not financial advice.
This is also the decade where pension access becomes relevant. The minimum pension access age is currently 55 (rising to 57 in 2028 under pension legislation). Some early retirees begin part-time work alongside pension drawdown in their late 50s. The Pensions and Lifetime Savings Association (PLSA) Retirement Living Standards for 2026/27 set targets for single-person retirement income at three levels: Minimum (£14,400/year), Moderate (£31,300/year), and Comfortable (£43,100/year). The pension pot required to meet the Comfortable standard — on the 4% withdrawal framework — is approximately £1 million, significantly above the median net worth in this band.
Pension access age change: the minimum pension access age rises from 55 to 57 in April 2028. If you are planning early retirement between 55 and 57 before that date, the window is closing. The change affects those born after 5 April 1973 who would have been 55 before 2028 but will now not reach 57 until after the cutoff. Check with a financial adviser or the DWP if your plans are affected. Not financial advice.
The composition of wealth at this peak matters. Net property wealth represents 40% of total household wealth nationally, and for the 65–74 band, property equity is typically at its maximum — the mortgage paid off decades ago. Private pension wealth (35% of total nationally) is also at or near its maximum. The household is, in effect, ‘balance sheet wealthy’: most of the wealth is illiquid (property and pension) rather than liquid (cash and investable assets).
The 65-74 wealth peak in context: £502,500 median. Of this, approximately 40% (£200k) is net property wealth; 35% (£175k) is private pension wealth; 14% (£70k) is net financial wealth; 10% (£50k) is physical wealth. Pension access: drawdown from 55 (57 from 2028). State Pension: £12,548/year (full new State Pension 2026/27; FRA 67). The IFS estimate that by age 65, average UK homeowner net worth is £340,000 vs renter net worth of just £40,000 -- the full lifetime homeownership premium. PLSA Comfortable retirement income target: £43,100/year single. Source: ONS; PLSA 2026/27; IFS.
The £373,100 median at 75+ includes the effect of the State Pension, which provides a guaranteed income floor that reduces the need for rapid portfolio drawdown. However, care costs — which can run to £50,000+ per year for residential care — represent a major late-life financial risk that can rapidly erode net worth in this age band. The ‘Great Wealth Transfer’ that financial press has predicted to flow from Boomers to Millennials is, according to IFA Magazine (2026, citing Ethos Atlas June 2025), likely to be ‘more like a trickle than a wave for the vast majority of the UK population,’ partly because Boomers are spending their wealth rather than simply preserving it for inheritance. The average age at which someone receives an inheritance in the UK is 61.
This composition has a profound practical implication. The ONS reports that median household wealth excluding pension wealth was £181,700 — compared to the overall median of £293,700. Strip out both property equity and pension, and the typical household’s liquid financial net worth — the assets accessible in a crisis — is dramatically smaller. The FCA Financial Lives Survey 2024 (published May 2025) found that 90% of UK adults have some cash savings, but the median saver holds just £5,000-£5,999. For 30% of households, there are no cash savings at all.
Physical wealth — cars, furniture, jewellery, art — accounts for 10% of total household wealth nationally. For younger age groups where property and pension wealth are minimal, physical possessions represent a disproportionately large share of net worth. This is an important nuance: a 22-year-old’s net worth of £15,200 may include a car worth £8,000, which is an asset that depreciates rather than appreciates. Not financial advice.
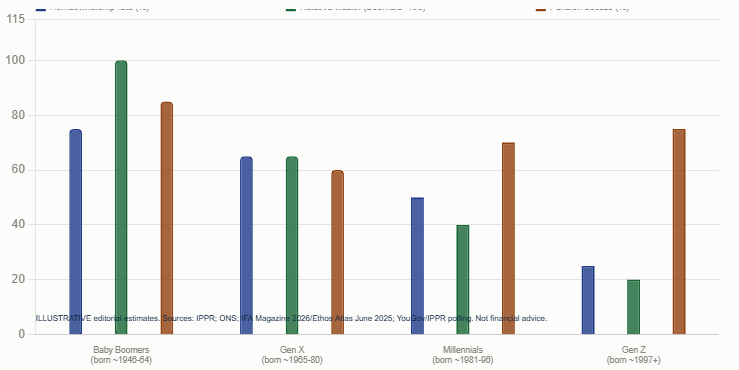
Fewer than half of millennials (born 1982–2002) are expected to own their own home by age 45 on current trends (IPPR). For context: their parents’ generation had majority homeownership by their late 20s. The IPPR YouGov polling found that 74% of respondents expect 18–24-year-olds to have fewer savings and investments than previous generations; 72% believe they will hold less housing wealth; and 80% say they will take on more debt. ‘The old social contract in which each generation could expect more wealth than the last is broken,’ the IPPR concluded.
UK Baby Boomers now hold more than £5 trillion in wealth (Ethos Atlas June 2025, cited IFA Magazine 2026). But the ‘Great Wealth Transfer’ from Boomers to their children is unlikely to benefit most younger people: 70% of the £1.7 trillion in investment wealth held by over-65 households is concentrated in just 1 million (out of 28 million) UK households. The average inheritance recipient is 61 — by which point they have already made most of the major wealth-building decisions of their lives. Not financial advice.
The 40% property share of total UK household wealth means that homeownership status is the most powerful predictor of a household’s total net worth at retirement. A household that bought a £200,000 property in 2005 with a 10% deposit saw the UK average house price more than double by 2022, turning £20,000 of initial equity into £200,000+ of net property wealth — without any additional saving. A renter who paid equivalent rent over the same period has no asset to show for it.
The interaction between property wealth and pension wealth compounds this divide. Homeowners reaching retirement have both a mortgage-free property (40% of wealth) and a pension built through decades of contributions (35% of wealth). Renters arriving at retirement with neither accumulate wealth primarily through financial savings — a much harder route to £293,700 than the combination of property and pension that most homeowners benefit from. Not financial advice.
A more UK-specific framework uses the PLSA Retirement Living Standards. For a single person to achieve a ‘Comfortable’ retirement income of £43,100/year in 2026/27, and using a 4% drawdown rate, a pension pot of approximately £1.08 million would be required (not including State Pension of £12,548/year). With State Pension, the portfolio target falls to approximately £757,000. A ‘Moderate’ retirement income of £31,300/year — less State Pension — would require approximately £469,500 in pension assets. These figures are substantially above the median pension wealth in most age bands.
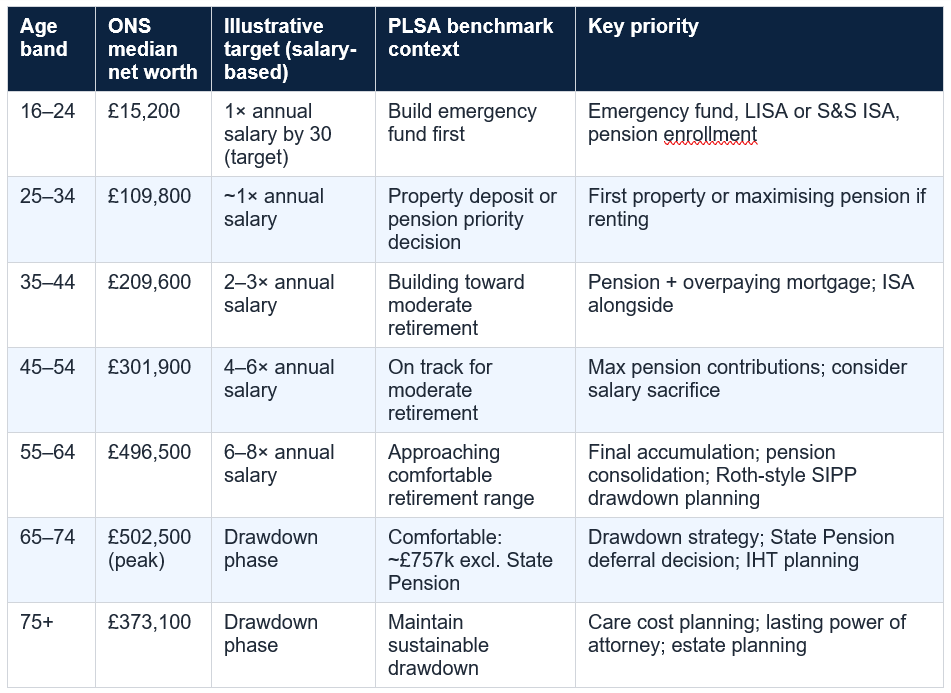
The most important finding in this data is not the numbers themselves. It is the structural insight they reveal: wealth in the UK is built primarily through two vehicles — property and pension — and the earlier and more consistently you engage with both, the more your wealth trajectory diverges from those who engage later or not at all. The generational wealth gap is real and structural, not a reflection of individual failure. The homeowner-renter divide is stark and grows wider with every year of property price appreciation. But within these structural constraints, the actions available to any individual at any age — maximising pension matching, using ISA allowances, managing debt, and building financial net worth alongside property — remain the most reliable levers available. Not financial advice.
Where you stand relative to the ONS median for your age is a starting point for a conversation with yourself — and, when appropriate, with a qualified financial adviser — not a verdict on your financial past. Not financial, investment, or tax advice. Consult an FCA-registered IFA for personalised guidance.
According to the ONS Wealth and Assets Survey (April 2020 to March 2022, published January 2025), median household total wealth by age of household head is: ages 16-24: £15,200; ages 25-34: £109,800; ages 35-44: £209,600; ages 45-54: £301,900; ages 55-64: £496,500; ages 65-74: £502,500 (peak); ages 75+: £373,100. The overall UK median is £293,700. Important caveat: the Office for Statistics Regulation removed the WAS accreditation in June 2025 over quality concerns -- treat figures as indicative rather than precise. These are household-level figures (not individual), covering Great Britain (Northern Ireland excluded), and include property, pensions, savings, investments, and physical possessions minus all liabilities. Source: ONS; Salarytax.uk (retrieved July 2026).
What makes up most people's net worth in the UK?
Net property wealth makes up 40% of total household wealth and private pension wealth a further 35%, meaning 75% of the typical household's net worth is in these two illiquid asset classes (ONS WAS 2020-22). Net financial wealth (savings and investments) accounts for just 14%, and physical wealth (cars, possessions) 10%. The median household wealth excluding pension wealth is £181,700 -- dramatically lower than the £293,700 total. This means that for most UK households, the pension is their second-largest asset after the property. The FCA Financial Lives Survey 2024 (published May 2025) found the median UK cash saver holds just £5,000-£5,999.
Is there a big gap between rich and poor in UK wealth?
Yes -- it is one of the starkest in wealth statistics. The IPPR found that the top 10% of UK households hold an average of £1.32 million in net property, pension and financial wealth, while the bottom 50% of households have an average of just £3,200. The top 10% are nearly 900 times wealthier than the bottom 10%. The wealthiest 1% hold 14% of all UK assets, up from 10% in 2010. Total UK household wealth reached £13.6 trillion at the time of the ONS survey (Resolution Foundation, January 2025), concentrated primarily in the hands of older homeowners in London and the South East. The median-vs-mean distinction is significant: the mean (average) household net worth is approximately £312,000-£340,000 (pulled up by the wealthy), while the median is £293,700 -- reflecting significant skew.
How does the UK's wealth compare to other countries by age?
The UK's median household net worth of approximately £290,000-£294,000 (ONS 2020-22, various conversions) positions it between the US and Germany in international comparisons. Comparisons vary by source and conversion rates. One comparison (Networth Zone, September 2026) cited: UK median £290,000; US median approximately $170,000 (lower due to less property-centric wealth); Germany median approximately €120,000 (~£105,000). UK net worth is heavily property-driven (40% of total wealth in property vs approximately 30% in the US where financial assets are more significant); this makes UK wealth more concentrated in older homeowners who benefited from the post-1990s property boom. The UK's auto-enrolment pension system (since 2012) has strengthened the pension component of net worth for younger workers compared to previous generations.
What is the net worth gap between homeowners and renters in the UK?
The IFS (Institute for Fiscal Studies) estimates that by age 65, the average UK homeowner's net worth is £340,000 while a renter's is just £40,000 -- an 8.5x gap. This divide is the most significant wealth differentiator in Britain. Property accounts for 40% of total UK household wealth, and homeowners benefit from: (1) mortgage repayments converting debt to equity; (2) property price appreciation adding to that equity; (3) a mortgage-free asset at retirement that can fund care costs or be passed on. Renters receive none of these benefits from equivalent housing expenditure. On current trends, fewer than half of millennials are expected to own their own home by age 45 (IPPR). The generational wealth gap is primarily a homeownership gap. Source: IFS; IPPR; ONS.
Table of Contents
- What ‘Net Worth’ Actually Means — and Why It Matters
- The ONS Data: UK Median Net Worth by Age Group
- Ages 16–24: The Starting Line (Median: £15,200)
- Ages 25–34: The Accumulation Decade (Median: £109,800)
- Ages 35–44: Mortgages, Pensions and the Mid-Life Build (Median: £209,600)
- Ages 45–54: Peak Earnings, Property Equity and the Home Straight (Median: £301,900)
- Ages 55–64: The Final Accumulation Sprint (Median: £496,500)
- Ages 65–74: The Wealth Peak — and What It’s Made Of (Median: £502,500)
- Ages 75+: Drawing Down in Retirement (Median: £373,100)
- The Wealth Composition: Property, Pension, Cash and Physical Assets
- The Generational Wealth Gap: Why Each Cohort Has Less Than the Last
- The Homeowner vs Renter Divide: The Biggest Wealth Gap in Britain
- What Should Your Net Worth Be? Benchmarks and Targets by Age
- How to Build Net Worth Faster: Strategies That Work at Any Age
- Conclusion: The Number Is a Snapshot, Not a Sentence
- Frequently Asked Questions
Net worth by age — the UK wealth life-cycle
Wealth composition — what the numbers are made of
The generational divide — who has what and why
What ‘Net Worth’ Actually Means — and Why It Matters
Net worth is the single most comprehensive measure of personal financial health. It is not income (what flows in each month), not savings (what sits in a bank account), and not salary (the number on a payslip). Net worth is the total of everything you own — your property, pensions, savings, investments, and physical possessions such as cars — minus everything you owe: mortgages, credit card debt, student loans, car finance, and any other liability. The result is a number that tells you where you actually stand.The ONS — the Office for National Statistics — measures household net worth through the Wealth and Assets Survey (WAS). The most recent published data covers April 2020 to March 2022, published in January 2025. It is the most comprehensive snapshot of British household wealth available. An important caveat: in June 2025, the Office for Statistics Regulation removed the WAS accreditation over falling response rates and quality concerns. The ONS is developing plans to restore the dataset. The figures should be treated as indicative rather than precise, but they remain the best available data for understanding how wealth accumulates by age in Great Britain.
Net worth matters because it determines financial resilience: the ability to survive a job loss, fund retirement, absorb an emergency, or pass something on. Understanding where you stand relative to others in your age group is not about competition — it is about context. The number will tell you whether you are broadly on track, ahead, or behind, and what that means in practical terms. Not financial advice.
ONS Wealth and Assets Survey (April 2020-March 2022, published January 2025): median household total wealth in Great Britain £293,700. Excluding pension wealth: £181,700. Total British household wealth: £13.6 trillion (Resolution Foundation, January 2025). Net property wealth: 40% of total; private pension wealth: 35%; net financial wealth: 14%; physical wealth: 10%. Important: Office for Statistics Regulation removed WAS accreditation June 2025 -- treat figures as indicative. Northern Ireland excluded from WAS. Source: ONS.gov.uk; Salarytax.uk (retrieved July 2026); Resolution Foundation January 2025.
All net worth figures in this article are sourced from the ONS Wealth and Assets Survey (WAS), covering April 2020 to March 2022, published January 2025. This is the most recent comprehensive UK household wealth dataset available. Important caveat: in June 2025, the Office for Statistics Regulation removed the WAS accreditation over falling response rates and quality concerns. Treat the figures as indicative rather than precise benchmarks. The ONS is developing plans to improve and restore the dataset. These are household-level figures (not individual). The data covers Great Britain; Northern Ireland is excluded. Net worth figures include property, pensions, savings, investments, and physical possessions, minus all liabilities. All figures are in pounds sterling. Not financial advice.
The ONS Data: UK Median Net Worth by Age Group
Household wealth in Great Britain follows a clear life-cycle pattern: it accumulates through working years as property equity builds and pension contributions compound, peaks around retirement age, and then begins to decline as pension assets are drawn down. The ONS data for April 2020 to March 2022 documents this pattern with specificity across seven age bands.The range is striking. A household headed by someone aged 16 to 24 has a median net worth of £15,200. A household headed by someone aged 65 to 74 has a median net worth of £502,500 — more than 33 times the starting point. The jump between the 25–34 and 55–64 age bands — from £109,800 to £496,500, roughly a fivefold increase — is driven primarily by two compounding forces: the gradual elimination of mortgage debt as net property equity grows, and decades of private and workplace pension contributions compounding into a substantial retirement asset. Salarytax.uk, citing the ONS data, notes this as ‘a clear life-cycle pattern.’
The post-peak decline from £502,500 (ages 65–74) to £373,100 (ages 75+) reflects the drawdown of pension wealth in retirement. As the ONS notes: ‘After state pension age, household wealth often starts to decline as pension wealth is used in retirement.’ Not financial advice.
Ages 16–24: The Starting Line (Median: £15,200)
A median net worth of £15,200 for 16–24-year-old households reflects the financial reality of early adulthood: most are renting (not building property equity), most are in early-career or part-time employment (low pension contributions), and many carry student loan debt or other early-adult liabilities. The wealth that does exist in this band is primarily physical — a car, possessions — rather than appreciating financial assets.The ONS data shows that 40% of under-35s have no savings at all, and the proportion in this youngest band is higher still. Auto-enrolment in workplace pensions (mandatory for employers since 2012) means that most employed 22-year-olds are now building pension assets from their first job, which represents the most significant structural improvement in this age group’s wealth prospects compared to previous generations. But the starting net worth remains modest, and the gap to homeownership — the primary wealth-building mechanism in the UK — is large.
Ages 16-24 building blocks: (1) Maximise employer pension matching from day one -- turning down matched contributions is declining free money. (2) Open a Lifetime ISA (LISA) if planning to buy a first home: contribute up to £4,000/year and receive a 25% government bonus (£1,000/year) up to age 50. (3) Start a Stocks and Shares ISA -- even small regular contributions compound significantly over time. ISA allowance: £20,000/year (2026/27). (4) Avoid high-interest debt (credit cards, buy-now-pay-later). (5) Build an emergency fund (3-6 months of expenses) before investing. Not financial advice.
Ages 25–34: The Accumulation Decade (Median: £109,800)
The jump from £15,200 (16–24) to £109,800 (25–34) is the most proportionally dramatic in the entire age-band table — a more than sevenfold increase driven almost entirely by two events: first-time property purchase and the compounding of early pension contributions. However, the median figure of £109,800 conceals the most significant within-band inequality of any age group: a 25–34-year-old homeowner and a 25–34-year-old renter are on entirely different wealth trajectories, diverging further with every year of property price appreciation.This is also the decade where the generational wealth gap is most acutely felt. People born in the 1980s have just a third of the property wealth at age 28 of those born in the 1970s (IPPR). The Resolution Foundation found that financial wealth for someone aged 25–34 increased by just £900 in real terms between the 2018–20 and 2020–22 ONS surveys, compared to £3,400 for someone aged 65–74. The wealth-building machinery in this decade — homeownership, pension contributions, and regular saving — is functioning for some; for others, high rents, student debt, and affordability barriers are preventing entry to the wealth-building system entirely.
Generational View: For 25-34-year-olds: the ONS data for this band includes both homeowners (substantially wealthier) and renters (substantially poorer). The headline £109,800 median is heavily influenced by those who have purchased property. Fewer than half of millennials are expected to own their home by age 45 on current trends (IPPR). Those who have not yet purchased a property may find their net worth considerably below the median -- this is a structural issue, not a personal failure. The Lifetime ISA, Help to Buy (now closed to new applications), and shared ownership schemes are the primary policy tools available to bridge this gap. Not financial advice.
Ages 35–44: Mortgages, Pensions, and the Mid-Life Build (Median: £209,600)
By 35–44, the wealth-building machinery is in full operation for those who entered it. Median net worth rises to £209,600 — a £99,800 increase on the 25–34 band — driven by three compounding forces: mortgage repayments steadily converting debt into equity; pension contributions from a decade of working continuing to compound; and in many cases, rising property prices adding to paper wealth that wasn’t there when the mortgage was first taken out.This is also the most financially pressured decade for many households. Childcare costs — typically £1,000 to £2,000 per month per child for full-time nursery in London — compete directly with pension contributions and savings. Career progression often accelerates income during this period, but lifestyle inflation follows. The households that maintain their pension contributions and resist lifestyle creep during the 35–44 decade are those who will see the most dramatic wealth increases as they approach 55.
The IFS (Institute for Fiscal Studies) estimate that by age 65, the average UK homeowner’s net worth is £340,000 while a renter’s is just £40,000. The foundation of that 8.5x gap is typically laid in this 35–44 decade, as property equity compounds and pension contributions build. Not financial advice.
Ages 35-44 wealth levers: (1) Protect pension contributions during childcare years -- contribution breaks compound into large pension shortfalls. (2) Overpay the mortgage if financially feasible: £100/month extra on a 25-year mortgage can save £10,000+ in interest and reduce term by 3+ years (Which? cited). (3) Review and consolidate old pensions from previous employers -- small pension pots scattered across providers often have high charges. (4) Consider a Stocks and Shares ISA alongside the pension for assets accessible before age 57 (pension minimum access age rising to 57 in 2028). (5) Life insurance and income protection become important for household financial resilience in this decade. Not financial advice.
Ages 45–54: Peak Earnings, Property Equity and the Home Straight (Median: £301,900)
Median household net worth reaches £301,900 at ages 45–54 — passing the £293,700 overall UK median for the first time. For many households, this is the decade where the wealth-building engine reaches full speed: income typically approaches its peak (ONS ASHE 2025 data shows full-time median pay peaking between ages 40–49 at £44,244), mortgages are well into their repayment and net property equity is large, and pensions have been compounding for two to three decades.For homeowners who bought in the 1990s or 2000s at prices a fraction of today’s market values, property equity in this decade can represent the majority of total net worth. Many in this age band are approaching ‘mortgage freedom’ — either having paid off the mortgage entirely or being close to doing so — which substantially accelerates the ability to save and invest. The freed-up monthly mortgage payment, redirected to pension and ISA, can dramatically accelerate wealth in the decade from 45–54.
Auto-enrolment has been operational since 2012, meaning that 45-year-olds in 2026 who have been continuously enrolled since its introduction have had up to 14 years of employer-matched pension contributions working for them — a structural advantage over those who entered the workforce before auto-enrolment. Not financial advice.
Ages 55–64: The Final Accumulation Sprint (Median: £496,500)
The 55–64 age band shows the largest absolute wealth increase of any decade: median net worth rises from £301,900 to £496,500, a jump of £194,600. This represents the compound payoff of decades of property and pension accumulation. For the majority of homeowners in this band, the mortgage is either fully paid off or within reach of being so, meaning net property wealth is at or near its maximum. Pension pots are at peak accumulation, with many workers making maximum or near-maximum contributions in the final years before retirement.This is also the decade where pension access becomes relevant. The minimum pension access age is currently 55 (rising to 57 in 2028 under pension legislation). Some early retirees begin part-time work alongside pension drawdown in their late 50s. The Pensions and Lifetime Savings Association (PLSA) Retirement Living Standards for 2026/27 set targets for single-person retirement income at three levels: Minimum (£14,400/year), Moderate (£31,300/year), and Comfortable (£43,100/year). The pension pot required to meet the Comfortable standard — on the 4% withdrawal framework — is approximately £1 million, significantly above the median net worth in this band.
Pension access age change: the minimum pension access age rises from 55 to 57 in April 2028. If you are planning early retirement between 55 and 57 before that date, the window is closing. The change affects those born after 5 April 1973 who would have been 55 before 2028 but will now not reach 57 until after the cutoff. Check with a financial adviser or the DWP if your plans are affected. Not financial advice.
Ages 65–74: The Wealth Peak — and What It’s Made Of (Median: £502,500)
The 65–74 age band represents the peak of UK household wealth at a median of £502,500 — the highest of any age band in the ONS data. The modest increase from the 55–64 band (+£6,000) reflects the transition from final accumulation to the beginning of drawdown: pension contributions stop at retirement, but pension assets may still be compounding; property wealth typically remains intact through the early retirement years; and many in this band are drawing the State Pension (currently £12,548/year for the full new State Pension in 2026/27), which reduces the need for aggressive portfolio drawdown.The composition of wealth at this peak matters. Net property wealth represents 40% of total household wealth nationally, and for the 65–74 band, property equity is typically at its maximum — the mortgage paid off decades ago. Private pension wealth (35% of total nationally) is also at or near its maximum. The household is, in effect, ‘balance sheet wealthy’: most of the wealth is illiquid (property and pension) rather than liquid (cash and investable assets).
The 65-74 wealth peak in context: £502,500 median. Of this, approximately 40% (£200k) is net property wealth; 35% (£175k) is private pension wealth; 14% (£70k) is net financial wealth; 10% (£50k) is physical wealth. Pension access: drawdown from 55 (57 from 2028). State Pension: £12,548/year (full new State Pension 2026/27; FRA 67). The IFS estimate that by age 65, average UK homeowner net worth is £340,000 vs renter net worth of just £40,000 -- the full lifetime homeownership premium. PLSA Comfortable retirement income target: £43,100/year single. Source: ONS; PLSA 2026/27; IFS.
Ages 75+: Drawing Down in Retirement (Median: £373,100)
The decline from £502,500 (65–74) to £373,100 (75+) — a fall of £129,400 — represents the systematic drawdown of pension wealth in later retirement. As the ONS notes, ‘after state pension age, household wealth often starts to decline as pension wealth is used in retirement.’ Property wealth typically remains intact until care home costs or significant care needs arise, which explains why property remains a major component of net worth even in the 75+ band.The £373,100 median at 75+ includes the effect of the State Pension, which provides a guaranteed income floor that reduces the need for rapid portfolio drawdown. However, care costs — which can run to £50,000+ per year for residential care — represent a major late-life financial risk that can rapidly erode net worth in this age band. The ‘Great Wealth Transfer’ that financial press has predicted to flow from Boomers to Millennials is, according to IFA Magazine (2026, citing Ethos Atlas June 2025), likely to be ‘more like a trickle than a wave for the vast majority of the UK population,’ partly because Boomers are spending their wealth rather than simply preserving it for inheritance. The average age at which someone receives an inheritance in the UK is 61.
The Wealth Composition: Property, Pension, Cash and Physical Assets
Understanding what makes up UK household net worth reveals how precarious the headline number is for many households. The ONS data shows that net property wealth accounts for 40% of total household wealth in Great Britain, and private pension wealth accounts for a further 35%. Combined, these two asset classes represent 75% of median household net worth — and both are illiquid: you cannot access your property equity without selling or remortgaging, and you cannot access your pension until at least age 55 (57 from 2028).This composition has a profound practical implication. The ONS reports that median household wealth excluding pension wealth was £181,700 — compared to the overall median of £293,700. Strip out both property equity and pension, and the typical household’s liquid financial net worth — the assets accessible in a crisis — is dramatically smaller. The FCA Financial Lives Survey 2024 (published May 2025) found that 90% of UK adults have some cash savings, but the median saver holds just £5,000-£5,999. For 30% of households, there are no cash savings at all.
Physical wealth — cars, furniture, jewellery, art — accounts for 10% of total household wealth nationally. For younger age groups where property and pension wealth are minimal, physical possessions represent a disproportionately large share of net worth. This is an important nuance: a 22-year-old’s net worth of £15,200 may include a car worth £8,000, which is an asset that depreciates rather than appreciates. Not financial advice.
The Generational Wealth Gap: Why Each Cohort Has Less Than the Last
The IPPR’s research finding — that every generation since the post-war baby boomers has accumulated less wealth than the generation before them had at the same age — is one of the most consequential economic facts about modern Britain. The primary mechanism is property: people born in the 1980s have just a third of the property wealth at age 28 of those born in the 1970s. The underlying cause is the extraordinary appreciation of UK house prices since the 1990s, which created massive wealth for those who bought early and progressively higher barriers to entry for those who came after.Fewer than half of millennials (born 1982–2002) are expected to own their own home by age 45 on current trends (IPPR). For context: their parents’ generation had majority homeownership by their late 20s. The IPPR YouGov polling found that 74% of respondents expect 18–24-year-olds to have fewer savings and investments than previous generations; 72% believe they will hold less housing wealth; and 80% say they will take on more debt. ‘The old social contract in which each generation could expect more wealth than the last is broken,’ the IPPR concluded.
UK Baby Boomers now hold more than £5 trillion in wealth (Ethos Atlas June 2025, cited IFA Magazine 2026). But the ‘Great Wealth Transfer’ from Boomers to their children is unlikely to benefit most younger people: 70% of the £1.7 trillion in investment wealth held by over-65 households is concentrated in just 1 million (out of 28 million) UK households. The average inheritance recipient is 61 — by which point they have already made most of the major wealth-building decisions of their lives. Not financial advice.
The Homeowner vs Renter Divide: The Biggest Wealth Gap in Britain
No single factor divides UK household wealth more sharply than homeownership. The IFS estimates that by age 65, the average UK homeowner’s net worth is £340,000 while a renter’s is just £40,000 — an 8.5x gap that is the product of decades of mortgage repayment converting debt to equity, while rent payments provide no equivalent accumulation.The 40% property share of total UK household wealth means that homeownership status is the most powerful predictor of a household’s total net worth at retirement. A household that bought a £200,000 property in 2005 with a 10% deposit saw the UK average house price more than double by 2022, turning £20,000 of initial equity into £200,000+ of net property wealth — without any additional saving. A renter who paid equivalent rent over the same period has no asset to show for it.
The interaction between property wealth and pension wealth compounds this divide. Homeowners reaching retirement have both a mortgage-free property (40% of wealth) and a pension built through decades of contributions (35% of wealth). Renters arriving at retirement with neither accumulate wealth primarily through financial savings — a much harder route to £293,700 than the combination of property and pension that most homeowners benefit from. Not financial advice.
What Should Your Net Worth Be? Benchmarks and Targets by Age
The ONS median figures are descriptive — they tell you where the typical household is, not where it should be. Several widely cited financial planning benchmarks attempt to set normative targets. One common rule of thumb suggests having a net worth of roughly one year of gross salary by age 30, two to three years by 40, four to six years by 50, and eight to ten years by 60 (adapted from Fidelity’s US savings benchmarks). Applied to the ONS median UK salary data (full-time median pay peaking £44,244 for ages 40–49 per ONS ASHE 2025), these translate to approximate targets.A more UK-specific framework uses the PLSA Retirement Living Standards. For a single person to achieve a ‘Comfortable’ retirement income of £43,100/year in 2026/27, and using a 4% drawdown rate, a pension pot of approximately £1.08 million would be required (not including State Pension of £12,548/year). With State Pension, the portfolio target falls to approximately £757,000. A ‘Moderate’ retirement income of £31,300/year — less State Pension — would require approximately £469,500 in pension assets. These figures are substantially above the median pension wealth in most age bands.
How to Build Net Worth Faster: Strategies That Work at Any Age
The composition of UK household net worth — dominated by property (40%) and pension (35%) — means the two most impactful wealth-building actions are those that most directly grow these asset classes: getting onto the property ladder (or building property equity if already on it), and maximising pension contributions with employer matching.- Maximise employer pension matching: any employer contribution above the mandatory minimum that you are leaving unclaimed is effectively a pay cut. Auto-enrolment minimum rates (2026): employer 3%, employee 5% (total 8%). Many employers match above this. Salary sacrifice pension contributions are paid before National Insurance, making them even more tax-efficient. Not financial advice.
- Use tax-efficient wrappers: the ISA allowance (£20,000/year in 2026/27) and the Lifetime ISA (£4,000/year with 25% government bonus for under-40s for first home or retirement) are powerful tools for building financial net worth outside the property-and-pension duopoly. A Stocks and Shares ISA invested in a low-cost global index fund over 20 years has historically outperformed cash savings substantially. Not financial advice; past performance is not a guarantee.
- Overpay the mortgage strategically: every pound of mortgage overpayment increases net property wealth at a rate equal to the mortgage interest rate (currently around 4-6% for many variable and fixed rate mortgages in 2026). At current rates, overpaying typically outperforms cash savings accounts on a guaranteed after-tax return basis. Check your mortgage terms for overpayment limits. Not financial advice.
- Consolidate pension pots: the average UK worker has 11 jobs over a lifetime and leaves pension pots at each one. Old employer pensions typically have higher charges than modern workplace pensions or self-invested personal pensions (SIPPs). Consolidating into a low-cost SIPP or current employer scheme can meaningfully improve net pension wealth. Check for any guaranteed benefits (defined benefit) before transferring. Not financial advice.
- Manage high-interest debt: credit card debt at 20-30% APR destroys net worth at a rate that no investment can reliably outpace. Paying off high-interest consumer debt before investing (except for maximising pension match) produces the highest guaranteed return available. Not financial advice.
- Track your net worth annually: simply measuring net worth yearly — adding up assets, subtracting liabilities — creates accountability and reveals whether you are building or eroding wealth. Most people who track their net worth improve it faster than those who don’t. Not financial advice.
Conclusion
The ONS data paints a clear picture of how wealth accumulates across a British lifetime: from £15,200 at 16–24 to a peak of £502,500 at 65–74, driven primarily by homeownership and pension contributions, and heavily concentrated in the top wealth deciles. But the median figure for your age band is a snapshot of where the typical household is, not a sentence passed on where you must be.The most important finding in this data is not the numbers themselves. It is the structural insight they reveal: wealth in the UK is built primarily through two vehicles — property and pension — and the earlier and more consistently you engage with both, the more your wealth trajectory diverges from those who engage later or not at all. The generational wealth gap is real and structural, not a reflection of individual failure. The homeowner-renter divide is stark and grows wider with every year of property price appreciation. But within these structural constraints, the actions available to any individual at any age — maximising pension matching, using ISA allowances, managing debt, and building financial net worth alongside property — remain the most reliable levers available. Not financial advice.
Where you stand relative to the ONS median for your age is a starting point for a conversation with yourself — and, when appropriate, with a qualified financial adviser — not a verdict on your financial past. Not financial, investment, or tax advice. Consult an FCA-registered IFA for personalised guidance.
Frequently Asked Questions
What is the average net worth in the UK by age?According to the ONS Wealth and Assets Survey (April 2020 to March 2022, published January 2025), median household total wealth by age of household head is: ages 16-24: £15,200; ages 25-34: £109,800; ages 35-44: £209,600; ages 45-54: £301,900; ages 55-64: £496,500; ages 65-74: £502,500 (peak); ages 75+: £373,100. The overall UK median is £293,700. Important caveat: the Office for Statistics Regulation removed the WAS accreditation in June 2025 over quality concerns -- treat figures as indicative rather than precise. These are household-level figures (not individual), covering Great Britain (Northern Ireland excluded), and include property, pensions, savings, investments, and physical possessions minus all liabilities. Source: ONS; Salarytax.uk (retrieved July 2026).
What makes up most people's net worth in the UK?
Net property wealth makes up 40% of total household wealth and private pension wealth a further 35%, meaning 75% of the typical household's net worth is in these two illiquid asset classes (ONS WAS 2020-22). Net financial wealth (savings and investments) accounts for just 14%, and physical wealth (cars, possessions) 10%. The median household wealth excluding pension wealth is £181,700 -- dramatically lower than the £293,700 total. This means that for most UK households, the pension is their second-largest asset after the property. The FCA Financial Lives Survey 2024 (published May 2025) found the median UK cash saver holds just £5,000-£5,999.
Is there a big gap between rich and poor in UK wealth?
Yes -- it is one of the starkest in wealth statistics. The IPPR found that the top 10% of UK households hold an average of £1.32 million in net property, pension and financial wealth, while the bottom 50% of households have an average of just £3,200. The top 10% are nearly 900 times wealthier than the bottom 10%. The wealthiest 1% hold 14% of all UK assets, up from 10% in 2010. Total UK household wealth reached £13.6 trillion at the time of the ONS survey (Resolution Foundation, January 2025), concentrated primarily in the hands of older homeowners in London and the South East. The median-vs-mean distinction is significant: the mean (average) household net worth is approximately £312,000-£340,000 (pulled up by the wealthy), while the median is £293,700 -- reflecting significant skew.
How does the UK's wealth compare to other countries by age?
The UK's median household net worth of approximately £290,000-£294,000 (ONS 2020-22, various conversions) positions it between the US and Germany in international comparisons. Comparisons vary by source and conversion rates. One comparison (Networth Zone, September 2026) cited: UK median £290,000; US median approximately $170,000 (lower due to less property-centric wealth); Germany median approximately €120,000 (~£105,000). UK net worth is heavily property-driven (40% of total wealth in property vs approximately 30% in the US where financial assets are more significant); this makes UK wealth more concentrated in older homeowners who benefited from the post-1990s property boom. The UK's auto-enrolment pension system (since 2012) has strengthened the pension component of net worth for younger workers compared to previous generations.
What is the net worth gap between homeowners and renters in the UK?
The IFS (Institute for Fiscal Studies) estimates that by age 65, the average UK homeowner's net worth is £340,000 while a renter's is just £40,000 -- an 8.5x gap. This divide is the most significant wealth differentiator in Britain. Property accounts for 40% of total UK household wealth, and homeowners benefit from: (1) mortgage repayments converting debt to equity; (2) property price appreciation adding to that equity; (3) a mortgage-free asset at retirement that can fund care costs or be passed on. Renters receive none of these benefits from equivalent housing expenditure. On current trends, fewer than half of millennials are expected to own their own home by age 45 (IPPR). The generational wealth gap is primarily a homeownership gap. Source: IFS; IPPR; ONS.
0 Comments
Be the first to share your thoughts on this article.