
Financial Literacy
Cost of Living Then vs Now: Why 2026 Feels Harder
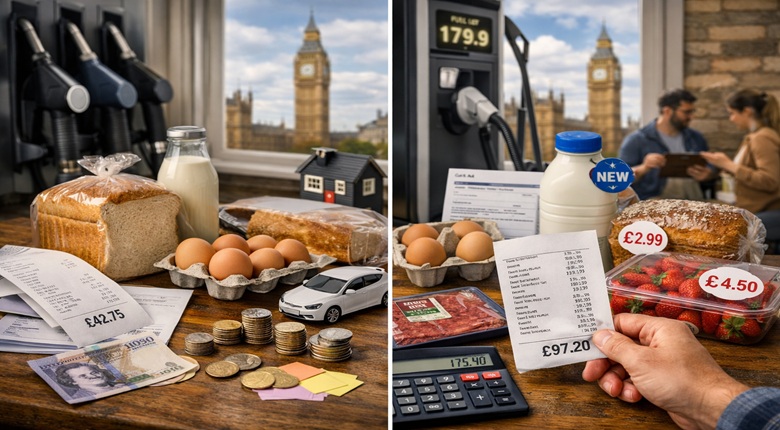
UK consumer prices are 25% higher than they were in 2020. US cumulative inflation since the pandemic is also roughly 25%. Wages have broadly kept up in nominal terms — but that misses the bigger picture: the price level has permanently reset higher, and millions of households are still catching up. This guide breaks down exactly what costs have risen, why, and what you can do about it.
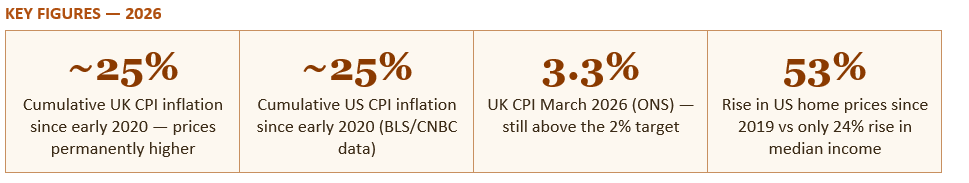
In the UK, consumer prices as measured by the Consumer Prices Index (CPI) peaked at 11.1% annual inflation in October 2022 — a 41-year high. Even after two years of falling inflation, the cumulative effect means that UK consumer prices are approximately 25% higher than they were in early 2020. The CPI rate in March 2026 was 3.3%, up from 3.0% in February — still above the Bank of England's 2% target, and with the Bank forecasting CPI between 3% and 3.5% through the second and third quarters of 2026 due to higher energy prices linked to the Iran conflict. Services inflation, which the Bank watches closely, stood at 4.5% in March 2026.
In the United States, the picture is strikingly similar. Cumulative CPI inflation since early 2020 is also approximately 25%, according to Bureau of Labor Statistics data referenced by CNBC. The US inflation rate peaked at 9.1% in June 2022 before falling to around 3.3% in early 2026. Critically, the Federal Reserve's own chair Jerome Powell acknowledged in December 2025 that households are still grappling with 'embedded higher costs due to higher inflation in 2022 and 2023', and that 'some years of real compensation significantly higher than inflation' will be needed before people start to feel good about affordability. That distinction matters: slower inflation does not mean prices are falling. It means they are rising more slowly on top of an already elevated base.
Even though inflation has moderated, prices continue to rise, keeping it a persistent source of frustration. Median wage data masks various outcomes — when broken out by quartile, the lowest-income earners are seeing little to no inflation-adjusted growth. For many workers, it feels like stagnation because it is.
— STEPHEN KATES, FINANCIAL ANALYST, BANKRATE (CNBC MAKE IT, JANUARY 2026)
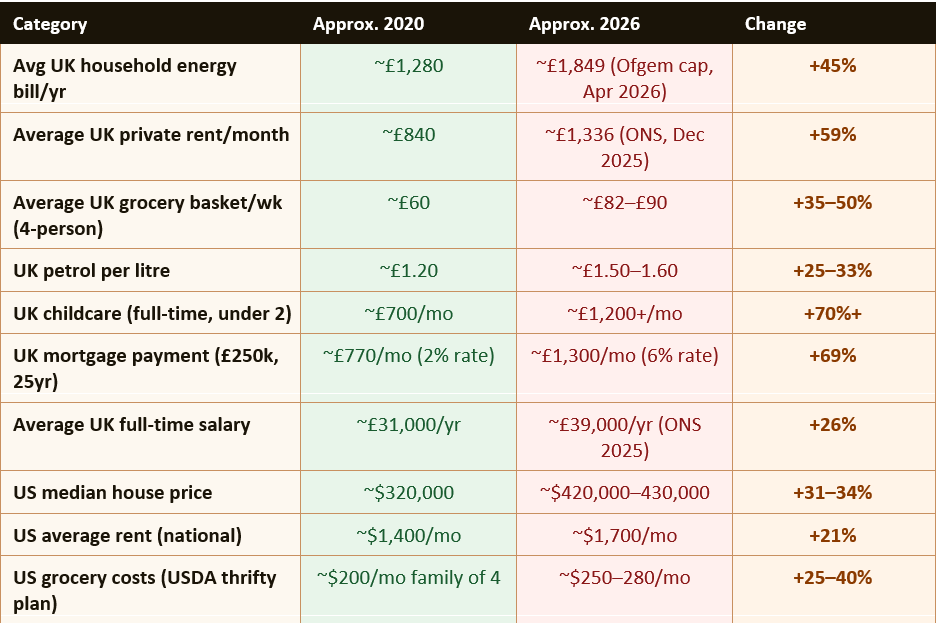
Russia's invasion of Ukraine in February 2022 ended the era of cheap gas from Russia flowing to European markets. UK energy prices — regulated by the Ofgem price cap — hit £4,279 per year at their October 2022 peak before government intervention through the Energy Price Guarantee and subsequent support packages brought bills back below £3,000. By April 2026, the Ofgem price cap stood at approximately £1,849 per year — significantly lower than the 2022 peak but still roughly 45% above 2020 levels, and now heading higher again as the Iran war has pushed oil and gas prices upward. The Bank of England's March 2026 revised forecast explicitly cited higher energy prices linked to the Middle East conflict as a driver of expected UK inflation between 3% and 3.5% through the summer of 2026.
In the United States, energy price inflation has been less severe at the household level — partly because the US sources a larger proportion of its energy domestically — but consumers have still experienced significant increases in electricity and natural gas bills, with NAHB noting that utility costs are expected to surge further due to the data centre construction boom driving up electricity demand.
The energy crisis has also had significant distributional effects. Lower-income households spend a higher proportion of their income on energy — in the UK, households in the bottom income decile spend approximately three times the share of income on energy compared with those in the top decile. This means that even as headline inflation measures moderate, the effective inflation experienced by the lowest-income households remains materially higher than the CPI figure suggests.
The Office for National Statistics data shows that the weekly grocery bill for a family of four in the UK has increased by approximately 35% to 50% compared with 2020, depending on food choices and shopping habits. Budget supermarkets like Aldi and Lidl have grown their market share significantly as households have traded down from branded goods and premium supermarkets, but the savings from switching are finite — own-brand prices at budget retailers have also risen substantially.
In the US, the USDA's Thrifty Food Plan — the most frugal official estimate of what a family of four needs to spend to eat healthily — rose from approximately $200 per month in 2020 to $250 to $280 by 2025 and 2026. The impact on higher-cost food categories has been even more pronounced: egg prices in the US reached record highs in early 2025 and 2026, driven by avian flu outbreaks in addition to general inflationary pressures.
The psychological and social impact of food price inflation is distinct from other costs because the grocery shop happens weekly, making price increases viscerally apparent in a way that an annual energy bill or a monthly mortgage statement does not. Research consistently shows that food costs are the most commonly cited driver of financial anxiety among lower and middle-income households — not because they are necessarily the largest item in the budget, but because their increase is most frequently visible.
In the UK, average private rents across Great Britain rose approximately 30% between 2022 and 2026, according to ONS data, with some areas seeing even steeper increases. ONS data for December 2025 puts average UK private rents at around £1,336 per month, compared with approximately £840 in 2020 — a 59% increase over six years. London rents are substantially higher, with average monthly rents in the capital now well above £2,000 in many areas. Housing charity Shelter estimates that approximately 3.4 million people in England are in private rental housing that they cannot afford.
For mortgage holders, the picture depends strongly on when they secured their rate. Those who fixed at 2% in 2021 have insulated themselves from rate increases — but face a significant shock when they come to remortgage, as rates in 2026 remain around 6%. A £250,000 mortgage at 6% over 25 years costs approximately £1,300 per month — compared with approximately £770 per month at a 2% rate. For borrowers remortgaging from a five-year fix taken out in 2021, this represents an increase of over £500 per month in housing costs with no change in the underlying property.
In the US, home prices rose 53% between 2019 and 2025 (NAHB), while median household incomes rose only 24%. Average US rents increased approximately 21% over the same period nationally, though in coastal metropolitan areas and Sun Belt cities such as Austin, Phoenix, and Miami the increases were substantially higher — in some markets exceeding 40% — before softening in 2024 and 2025.
UK petrol prices averaged approximately £1.20 per litre in 2020. By May 2026, despite having fallen from their 2022 peak of above £1.90 per litre, prices remain around £1.50 to £1.60 per litre — approximately 25% to 33% higher than 2020 levels. The cost of buying a new or used car has also risen substantially: used car prices in the UK increased by over 30% between 2020 and 2024, driven initially by semiconductor shortages restricting new car production and subsequently by persistent supply constraints.
Rail fares in England increased by 4.6% in March 2025, following above-inflation increases in previous years. Since 2020, the cumulative increase in regulated rail fares has significantly exceeded general CPI inflation. Bus fares have risen in many areas as subsidies have been cut. For commuters who depend on public transport to reach work, transport costs have risen from a notable expense to a genuinely material portion of their take-home pay.
In the US, gasoline prices have fluctuated significantly but remain above 2020 levels in most markets. The rise in electric vehicle adoption has provided relief for some households, but the upfront purchase cost and the associated insurance premium increases (EVs generally cost more to insure) mean the transition is not immediately financially beneficial for all.
UK childcare costs have risen by approximately 70% or more since 2020 in many areas, according to the Coram Family and Childcare survey. A full-time nursery place for a child under two in England now costs an average of £1,200 or more per month in many areas — well above what it would have cost in 2020. The government's expansion of free childcare hours from September 2025 (covering children from 9 months for eligible working parents) has provided meaningful relief, but only for families who qualify and only for the funded hours.
UK education costs — particularly for secondary school-age children who participate in paid extra-curricular activities, school trips, or supplementary tutoring — have risen substantially. ONS data for March 2026 shows education sector CPI at 7.6%, the fastest-rising CPI category, driven in part by private school fees and course costs. In the UK, private schools are now subject to VAT on fees, increasing costs for households using independent education.
In the US, healthcare costs have continued their long-term trend of rising faster than general inflation, with employer-provided health insurance premiums rising approximately 6 to 7% per year in 2024 and 2025. Out-of-pocket expenses including deductibles and co-payments have also increased, meaning that even insured households are paying more for healthcare than they were five years ago. For uninsured or underinsured Americans, healthcare costs represent a significant and growing financial risk.
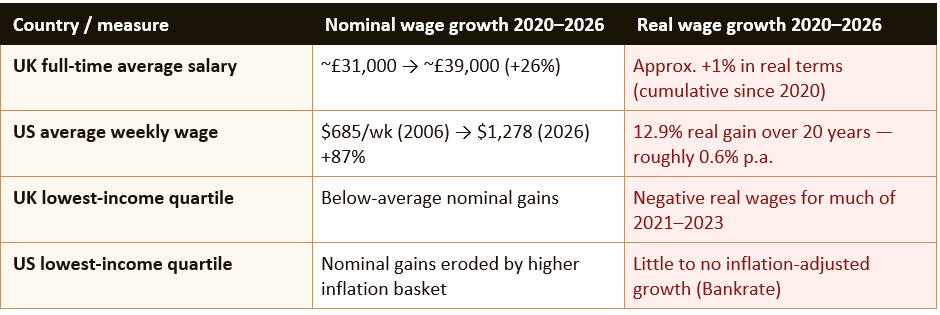
In the UK, average weekly earnings grew 3.6% in the three months to February 2026, against a CPI rate of 3.0% in the same month — meaning real wages were rising modestly. However, this positive recent trend needs to be placed in the context of the full post-pandemic period. Between October 2021 and June 2023, wage growth consistently failed to keep up with inflation, meaning that real wages fell significantly over that period. Workers have been recovering lost ground since mid-2023, but the cumulative effect of roughly two years of negative real wage growth has not been fully reversed for most households.
In the US, the picture is very similar. CNBC data from USAFacts shows that from March 2025 to March 2026, nominal wages grew 3.5% while inflation was 3.3% — a real wage gain of 0.26 percentage points, or approximately $6 extra per week in real terms. Since March 2006, the nominal average weekly wage rose from $685 to $1,278 — an 86.5% increase. But once adjusted for inflation, the real gain was only $146, or 12.9%, over 20 years. The nominal gains look impressive; the real purchasing power gains are modest.
The distributional picture is particularly concerning. When wages are broken out by income group, the lowest-income earners have seen little to no inflation-adjusted growth over the full period. A November 2025 YouGov poll found that 53% of Americans said their household income was just keeping up with expenses, while 32% said they were falling behind. A December 2025 Bankrate survey found that 62% of employed Americans said their income had not kept up with household expenses.
Lower-income households face a structurally higher rate of effective inflation than the headline CPI figure suggests. This is because lower-income budgets are disproportionately allocated to essentials — food, energy, and housing — which have seen the steepest price increases. Higher-income households spend a larger share of their income on services, discretionary goods, and investments, categories where price increases have been more moderate. ONS produces Household Cost Indices (HCI) that attempt to capture this distributional effect: they consistently show that the effective inflation experienced by lower-income households has been several percentage points higher than for higher-income ones throughout the crisis period.
Renters have experienced more severe cost of living pressures than homeowners, particularly those who locked in low mortgage rates before 2022. Private renters in the UK face no equivalent protection to the mortgage rate lock-in effect — landlords have typically passed on their own cost increases (higher mortgage rates, insurance, maintenance) in the form of higher rents, while renters have no ability to lock in prices for more than 12 months at a time in most cases.
Young people — particularly those entering the labour market or renting their first home since 2020 — have faced the full impact of the cost of living crisis without the accumulated savings, established career earnings, or property equity that older households have used to absorb it. Sixty to sixty-one per cent of Americans aged 18 to 34 have $1,000 or less in savings, according to data cited by Utah Business in 2026. This group has the least financial resilience to absorb shocks and the most to gain from policy interventions that meaningfully improve affordability.
Both central banks have been cutting rates cautiously since mid-2024. The Bank of England's base rate was at 4.5% in early 2026, with markets expecting further cuts through the year, though the Iran conflict's upward pressure on energy prices and the resulting higher CPI forecast of 3% to 3.5% may slow the pace of easing. The Federal Reserve had lowered its federal funds rate to approximately 4.25% to 4.5% by early 2026, with NAHB projecting a terminal rate of 3.25% by end-2026 if inflation continues to ease.
The primary mechanism by which higher rates have affected household finances is through mortgage costs — the dramatic increase in monthly payments for those remortgaging from pandemic-era fixed rates is the direct result of central bank tightening. The slower economic growth that higher rates have produced has also contributed to the labour market softening that has reduced wage growth in 2025 and 2026 compared with the rapid gains of 2023.
The Federal Reserve's Jerome Powell was right to say that years of real wage growth above inflation will be needed before households feel good about affordability. We are at the beginning of that recovery, not the end of it. Inflation is falling, real wages are marginally positive, and some relief is in sight from lower mortgage rates over the next two years. But the accumulated cost of the crisis — depleted savings, debt taken on to bridge the gap, delayed life milestones — will take longer to reverse. The most important thing any household can do is to treat their finances as a system that needs active management rather than a background concern, and to make sure they are claiming every allowance, reviewing every bill, and building every available buffer against the costs that are still rising.
Cumulative CPI inflation since early 2020 is approximately 25% in both the UK and US. UK CPI peaked at 11.1% in October 2022 — a 41-year high — before falling back. The UK CPI rate was 3.3% in March 2026, still above the 2% target. In the US, CPI peaked at 9.1% in June 2022 and has since eased to approximately 3.3%. In practical terms, a basket of goods that cost £100 in early 2020 costs approximately £125 in 2026. Prices are not falling — they are rising more slowly on top of a permanently elevated base.
ONS — Inflation and Price Indices (CPI, CPIH, RPI — monthly updates) https://www.ons.gov.uk/economy/inflationandpriceindices
Statista — UK Inflation Rate CPI January 2015 to March 2026 https://www.statista.com/statistics/306648/inflation-rate-consumer-price-index-cpi-united-kingdom-uk/
Statista — UK Wage Growth vs Inflation 2015–2026 (ONS data) https://www.statista.com/statistics/1272447/uk-wage-growth-vs-inflation/
CNBC Make It — How Wages Compare With Inflation Since 2020 (January 2026) https://www.cnbc.com/2026/01/13/how-wages-compare-with-inflation-since-2020.html
USAFacts — Are Wages Keeping Up With Inflation? (March 2026 data) https://usafacts.org/answers/are-wages-keeping-up-with-inflation/country/united-states/
Bank of England — Inflation Calculator https://www.bankofengland.co.uk/monetary-policy/inflation/inflation-calculator
Ofgem — Energy Price Cap (updated quarterly) https://www.ofgem.gov.uk/check-if-energy-price-cap-affects-you
Resolution Foundation — Living Standards (cost of living research) https://www.resolutionfoundation.org/topic/living-standards/
StepChange Debt Charity — Free UK Debt Advice https://www.stepchange.org
TABLE OF CONTENTS
- The Big Picture: What the Inflation Data Actually Shows
- The Then vs Now Price Comparison
- Energy: The Bill That Changed Everything
- Food: The Weekly Shop That Keeps Growing
- Housing and Rent: The Biggest Squeeze
- Transport and Fuel
- Childcare, Education and Healthcare
- Wages vs Prices: Did Your Pay Keep Up?
- Who Has Been Hit Hardest?
- What the Bank of England and Federal Reserve Are Doing
- How This Impacts You — and What You Can Do
- Conclusion
- Frequently Asked Questions
- References
The Big Picture: What the Inflation Data Actually Shows
The cost of living crisis of the 2020s is not just a memory — it is still present in 2026, embedded in the price level that households face every time they buy groceries, pay rent, or open an energy bill. Understanding the scale of what has happened is the starting point for understanding why so many households still feel financially stretched even as the annual inflation rate has fallen from its 2022 peak.In the UK, consumer prices as measured by the Consumer Prices Index (CPI) peaked at 11.1% annual inflation in October 2022 — a 41-year high. Even after two years of falling inflation, the cumulative effect means that UK consumer prices are approximately 25% higher than they were in early 2020. The CPI rate in March 2026 was 3.3%, up from 3.0% in February — still above the Bank of England's 2% target, and with the Bank forecasting CPI between 3% and 3.5% through the second and third quarters of 2026 due to higher energy prices linked to the Iran conflict. Services inflation, which the Bank watches closely, stood at 4.5% in March 2026.
In the United States, the picture is strikingly similar. Cumulative CPI inflation since early 2020 is also approximately 25%, according to Bureau of Labor Statistics data referenced by CNBC. The US inflation rate peaked at 9.1% in June 2022 before falling to around 3.3% in early 2026. Critically, the Federal Reserve's own chair Jerome Powell acknowledged in December 2025 that households are still grappling with 'embedded higher costs due to higher inflation in 2022 and 2023', and that 'some years of real compensation significantly higher than inflation' will be needed before people start to feel good about affordability. That distinction matters: slower inflation does not mean prices are falling. It means they are rising more slowly on top of an already elevated base.
Even though inflation has moderated, prices continue to rise, keeping it a persistent source of frustration. Median wage data masks various outcomes — when broken out by quartile, the lowest-income earners are seeing little to no inflation-adjusted growth. For many workers, it feels like stagnation because it is.
— STEPHEN KATES, FINANCIAL ANALYST, BANKRATE (CNBC MAKE IT, JANUARY 2026)
The Then vs Now Price Comparison
The table below compares approximate prices for key household expenditure categories between 2020 and 2026. Figures are approximate and reflect typical UK values unless indicated, with US comparisons noted separately. They are drawn from ONS, Ofgem, ONS rent data, Bank of England, and other published sources.Energy: The Bill That Changed Everything
Energy costs are the single item that has done the most damage to household budgets since 2020, and in many respects they tell the whole story of how the cost of living crisis unfolded. Before the pandemic, UK households had become accustomed to relatively stable energy prices. The average annual gas and electricity bill hovered around £1,000 to £1,300 for most of the 2010s.Russia's invasion of Ukraine in February 2022 ended the era of cheap gas from Russia flowing to European markets. UK energy prices — regulated by the Ofgem price cap — hit £4,279 per year at their October 2022 peak before government intervention through the Energy Price Guarantee and subsequent support packages brought bills back below £3,000. By April 2026, the Ofgem price cap stood at approximately £1,849 per year — significantly lower than the 2022 peak but still roughly 45% above 2020 levels, and now heading higher again as the Iran war has pushed oil and gas prices upward. The Bank of England's March 2026 revised forecast explicitly cited higher energy prices linked to the Middle East conflict as a driver of expected UK inflation between 3% and 3.5% through the summer of 2026.
In the United States, energy price inflation has been less severe at the household level — partly because the US sources a larger proportion of its energy domestically — but consumers have still experienced significant increases in electricity and natural gas bills, with NAHB noting that utility costs are expected to surge further due to the data centre construction boom driving up electricity demand.
The energy crisis has also had significant distributional effects. Lower-income households spend a higher proportion of their income on energy — in the UK, households in the bottom income decile spend approximately three times the share of income on energy compared with those in the top decile. This means that even as headline inflation measures moderate, the effective inflation experienced by the lowest-income households remains materially higher than the CPI figure suggests.
Food: The Weekly Shop That Keeps Growing
UK food price inflation reached approximately 19% in early 2023 — the highest rate since the 1970s — and while annual food CPI has moderated considerably since then, the cumulative effect on grocery bills is permanent. Food price inflation in March 2026 was 3.7% year-on-year, up from 3.3% in February — meaning the cost of food is still rising, just more slowly than at the crisis peak.The Office for National Statistics data shows that the weekly grocery bill for a family of four in the UK has increased by approximately 35% to 50% compared with 2020, depending on food choices and shopping habits. Budget supermarkets like Aldi and Lidl have grown their market share significantly as households have traded down from branded goods and premium supermarkets, but the savings from switching are finite — own-brand prices at budget retailers have also risen substantially.
In the US, the USDA's Thrifty Food Plan — the most frugal official estimate of what a family of four needs to spend to eat healthily — rose from approximately $200 per month in 2020 to $250 to $280 by 2025 and 2026. The impact on higher-cost food categories has been even more pronounced: egg prices in the US reached record highs in early 2025 and 2026, driven by avian flu outbreaks in addition to general inflationary pressures.
The psychological and social impact of food price inflation is distinct from other costs because the grocery shop happens weekly, making price increases viscerally apparent in a way that an annual energy bill or a monthly mortgage statement does not. Research consistently shows that food costs are the most commonly cited driver of financial anxiety among lower and middle-income households — not because they are necessarily the largest item in the budget, but because their increase is most frequently visible.
Housing and Rent: The Biggest Squeeze
Housing costs — whether paid as rent or as a mortgage — represent the largest single item in most households' budgets, and they have risen at rates that have significantly outpaced both the general inflation rate and wage growth in both the UK and US.In the UK, average private rents across Great Britain rose approximately 30% between 2022 and 2026, according to ONS data, with some areas seeing even steeper increases. ONS data for December 2025 puts average UK private rents at around £1,336 per month, compared with approximately £840 in 2020 — a 59% increase over six years. London rents are substantially higher, with average monthly rents in the capital now well above £2,000 in many areas. Housing charity Shelter estimates that approximately 3.4 million people in England are in private rental housing that they cannot afford.
For mortgage holders, the picture depends strongly on when they secured their rate. Those who fixed at 2% in 2021 have insulated themselves from rate increases — but face a significant shock when they come to remortgage, as rates in 2026 remain around 6%. A £250,000 mortgage at 6% over 25 years costs approximately £1,300 per month — compared with approximately £770 per month at a 2% rate. For borrowers remortgaging from a five-year fix taken out in 2021, this represents an increase of over £500 per month in housing costs with no change in the underlying property.
In the US, home prices rose 53% between 2019 and 2025 (NAHB), while median household incomes rose only 24%. Average US rents increased approximately 21% over the same period nationally, though in coastal metropolitan areas and Sun Belt cities such as Austin, Phoenix, and Miami the increases were substantially higher — in some markets exceeding 40% — before softening in 2024 and 2025.
Transport and Fuel
Transport costs have risen significantly since 2020 for most households, driven by a combination of fuel price increases, vehicle purchase inflation, and rising public transport fares.UK petrol prices averaged approximately £1.20 per litre in 2020. By May 2026, despite having fallen from their 2022 peak of above £1.90 per litre, prices remain around £1.50 to £1.60 per litre — approximately 25% to 33% higher than 2020 levels. The cost of buying a new or used car has also risen substantially: used car prices in the UK increased by over 30% between 2020 and 2024, driven initially by semiconductor shortages restricting new car production and subsequently by persistent supply constraints.
Rail fares in England increased by 4.6% in March 2025, following above-inflation increases in previous years. Since 2020, the cumulative increase in regulated rail fares has significantly exceeded general CPI inflation. Bus fares have risen in many areas as subsidies have been cut. For commuters who depend on public transport to reach work, transport costs have risen from a notable expense to a genuinely material portion of their take-home pay.
In the US, gasoline prices have fluctuated significantly but remain above 2020 levels in most markets. The rise in electric vehicle adoption has provided relief for some households, but the upfront purchase cost and the associated insurance premium increases (EVs generally cost more to insure) mean the transition is not immediately financially beneficial for all.
Childcare, Education and Healthcare
Three categories of household expenditure that have risen fastest in real terms are childcare, education, and healthcare — precisely the categories most associated with investment in family wellbeing and future outcomes.UK childcare costs have risen by approximately 70% or more since 2020 in many areas, according to the Coram Family and Childcare survey. A full-time nursery place for a child under two in England now costs an average of £1,200 or more per month in many areas — well above what it would have cost in 2020. The government's expansion of free childcare hours from September 2025 (covering children from 9 months for eligible working parents) has provided meaningful relief, but only for families who qualify and only for the funded hours.
UK education costs — particularly for secondary school-age children who participate in paid extra-curricular activities, school trips, or supplementary tutoring — have risen substantially. ONS data for March 2026 shows education sector CPI at 7.6%, the fastest-rising CPI category, driven in part by private school fees and course costs. In the UK, private schools are now subject to VAT on fees, increasing costs for households using independent education.
In the US, healthcare costs have continued their long-term trend of rising faster than general inflation, with employer-provided health insurance premiums rising approximately 6 to 7% per year in 2024 and 2025. Out-of-pocket expenses including deductibles and co-payments have also increased, meaning that even insured households are paying more for healthcare than they were five years ago. For uninsured or underinsured Americans, healthcare costs represent a significant and growing financial risk.
Wages vs Prices: Did Your Pay Keep Up?
The question that matters most to working households is whether wages have kept up with the permanent increase in the price level. The answer, at the aggregate level, is broadly yes in recent months — but no over the full period since 2020, and the aggregate disguises very unequal outcomes across income groups.In the UK, average weekly earnings grew 3.6% in the three months to February 2026, against a CPI rate of 3.0% in the same month — meaning real wages were rising modestly. However, this positive recent trend needs to be placed in the context of the full post-pandemic period. Between October 2021 and June 2023, wage growth consistently failed to keep up with inflation, meaning that real wages fell significantly over that period. Workers have been recovering lost ground since mid-2023, but the cumulative effect of roughly two years of negative real wage growth has not been fully reversed for most households.
In the US, the picture is very similar. CNBC data from USAFacts shows that from March 2025 to March 2026, nominal wages grew 3.5% while inflation was 3.3% — a real wage gain of 0.26 percentage points, or approximately $6 extra per week in real terms. Since March 2006, the nominal average weekly wage rose from $685 to $1,278 — an 86.5% increase. But once adjusted for inflation, the real gain was only $146, or 12.9%, over 20 years. The nominal gains look impressive; the real purchasing power gains are modest.
The distributional picture is particularly concerning. When wages are broken out by income group, the lowest-income earners have seen little to no inflation-adjusted growth over the full period. A November 2025 YouGov poll found that 53% of Americans said their household income was just keeping up with expenses, while 32% said they were falling behind. A December 2025 Bankrate survey found that 62% of employed Americans said their income had not kept up with household expenses.
Who Has Been Hit Hardest?
The cost of living crisis has not affected all households equally. Research from the Resolution Foundation, the Joseph Rowntree Foundation, the Institute for Fiscal Studies, and equivalent US organisations consistently shows that the burden has fallen most heavily on specific groups.Lower-income households face a structurally higher rate of effective inflation than the headline CPI figure suggests. This is because lower-income budgets are disproportionately allocated to essentials — food, energy, and housing — which have seen the steepest price increases. Higher-income households spend a larger share of their income on services, discretionary goods, and investments, categories where price increases have been more moderate. ONS produces Household Cost Indices (HCI) that attempt to capture this distributional effect: they consistently show that the effective inflation experienced by lower-income households has been several percentage points higher than for higher-income ones throughout the crisis period.
Renters have experienced more severe cost of living pressures than homeowners, particularly those who locked in low mortgage rates before 2022. Private renters in the UK face no equivalent protection to the mortgage rate lock-in effect — landlords have typically passed on their own cost increases (higher mortgage rates, insurance, maintenance) in the form of higher rents, while renters have no ability to lock in prices for more than 12 months at a time in most cases.
Young people — particularly those entering the labour market or renting their first home since 2020 — have faced the full impact of the cost of living crisis without the accumulated savings, established career earnings, or property equity that older households have used to absorb it. Sixty to sixty-one per cent of Americans aged 18 to 34 have $1,000 or less in savings, according to data cited by Utah Business in 2026. This group has the least financial resilience to absorb shocks and the most to gain from policy interventions that meaningfully improve affordability.
What the Bank of England and Federal Reserve Are Doing
Both the Bank of England and the US Federal Reserve raised interest rates aggressively between 2022 and 2023 in response to the inflation surge — the Bank of England raised its base rate from 0.1% to 5.25% between December 2021 and August 2023, and the Federal Reserve raised rates from near zero to above 5% over a similar period.Both central banks have been cutting rates cautiously since mid-2024. The Bank of England's base rate was at 4.5% in early 2026, with markets expecting further cuts through the year, though the Iran conflict's upward pressure on energy prices and the resulting higher CPI forecast of 3% to 3.5% may slow the pace of easing. The Federal Reserve had lowered its federal funds rate to approximately 4.25% to 4.5% by early 2026, with NAHB projecting a terminal rate of 3.25% by end-2026 if inflation continues to ease.
The primary mechanism by which higher rates have affected household finances is through mortgage costs — the dramatic increase in monthly payments for those remortgaging from pandemic-era fixed rates is the direct result of central bank tightening. The slower economic growth that higher rates have produced has also contributed to the labour market softening that has reduced wage growth in 2025 and 2026 compared with the rapid gains of 2023.
How This Impacts You — and What You Can Do
Understanding the macroeconomic picture is useful, but the most important question for any household is what you can do to protect and improve your own financial position in a higher-cost environment. The following steps are evidence-based, practical, and applicable regardless of income level.Practical steps to manage the ongoing cost of living impact
- Review all bills and subscriptions annually: Energy tariffs, insurance, broadband, mobile phone contracts, and streaming subscriptions all benefit from an annual competitive market review. Switching energy supplier or tariff can save hundreds of pounds per year; switching broadband or mobile can save £100+ per year. Set a calendar reminder for each renewal date.
- Use your ISA allowance (UK) or tax-advantaged accounts (US): With savings rates modestly positive in real terms and inflation still above 2%, putting money to work in an ISA (£20,000 annual allowance), Stocks and Shares ISA, or a US 401(k) or IRA protects future purchasing power better than holding cash in a current account.
- Check your benefit entitlement: Many households affected by the cost of living crisis are not claiming all the support they are entitled to. UK households should use entitledto.co.uk or the Turn2Us calculator. US households should check benefits.gov. Unclaimed entitlements — particularly for childcare, council tax reduction, and Universal Credit — can be worth thousands of pounds per year.
- Negotiate your salary: In a labour market where wages have broadly kept up with inflation only in the aggregate, individual outcomes vary dramatically. If your real purchasing power has fallen since 2020, a well-evidenced salary negotiation citing inflation data and market rates for your role and sector is both justified and increasingly common. Use Glassdoor, LinkedIn Salary, and ONS earnings data to benchmark your market rate.
- Reduce your exposure to variable costs: Where possible, lock in prices for energy (fixed-rate tariffs when available and competitive), food (meal planning and reducing waste), and discretionary spending. Households that plan their spending have consistently been shown to waste less and make more deliberate trade-offs between categories.
- Build or replenish your emergency fund: The cost of living crisis has depleted savings for many households. With interest rates at 4.5% (UK) or 4.25–4.5% (US) and high-yield savings accounts or Premium Bonds offering competitive returns, now is a good time to rebuild a three-to-six-month emergency fund if yours has been eroded.
- Seek free debt advice if needed: If rising costs have pushed you into unmanageable debt, organisations including StepChange (UK — stepchange.org) and the NFCC (US — nfcc.org) provide free, confidential debt advice. Acting early dramatically improves the options available.
CONCLUSION
The reason everything feels harder in 2026 is not a matter of perception — it is a matter of arithmetic. UK and US consumer prices are approximately 25% higher than they were in 2020. Energy bills are 45% above 2020 levels in the UK. Average UK private rents are 59% higher. Mortgage payments on a standard loan at current rates are 69% higher than at 2021 rates. These are not small adjustments at the margin — they represent a permanent reset in the cost of living that has not been fully offset by wage growth for the majority of working households.The Federal Reserve's Jerome Powell was right to say that years of real wage growth above inflation will be needed before households feel good about affordability. We are at the beginning of that recovery, not the end of it. Inflation is falling, real wages are marginally positive, and some relief is in sight from lower mortgage rates over the next two years. But the accumulated cost of the crisis — depleted savings, debt taken on to bridge the gap, delayed life milestones — will take longer to reverse. The most important thing any household can do is to treat their finances as a system that needs active management rather than a background concern, and to make sure they are claiming every allowance, reviewing every bill, and building every available buffer against the costs that are still rising.
Frequently Asked Questions
How much have prices risen since 2020 in the UK and US?Cumulative CPI inflation since early 2020 is approximately 25% in both the UK and US. UK CPI peaked at 11.1% in October 2022 — a 41-year high — before falling back. The UK CPI rate was 3.3% in March 2026, still above the 2% target. In the US, CPI peaked at 9.1% in June 2022 and has since eased to approximately 3.3%. In practical terms, a basket of goods that cost £100 in early 2020 costs approximately £125 in 2026. Prices are not falling — they are rising more slowly on top of a permanently elevated base.
Have wages kept up with inflation since 2020?
At the aggregate level, barely — and not for lower-income households. In the UK, average weekly earnings grew 3.6% in early 2026 against CPI of 3.0%, giving a small positive real return. But cumulative real wages since 2020 show little net improvement, after two years of significant negative real wage growth during the 2021 to 2023 inflation surge. In the US, USAFacts data shows nominal wages grew 3.5% in the year to March 2026, against inflation of 3.3%. Over the full pandemic period since 2020, inflation-adjusted wages are broadly flat overall. For the lowest-income quartile, real wages have seen little to no growth.Why is food so much more expensive than it used to be?
UK food price inflation reached approximately 19% at its peak in early 2023 — the highest since the 1970s. Food prices have continued to rise in 2026, with food CPI at 3.7% in March 2026. The causes include: supply chain disruption during and after the pandemic, the Ukraine war's impact on global grain and sunflower oil prices, higher energy costs raising food production and transport expenses, labour shortages in agriculture and food processing, and general demand-pull inflation from the post-pandemic economic recovery. These factors combined to create a sustained increase in the cost of food that has not been reversed by the subsequent moderation in annual inflation rates.Why is the cost of living crisis hitting renters harder than homeowners?
Homeowners who secured fixed-rate mortgages between 2020 and 2022 locked in rates of 1% to 3% and have been partially insulated from the wider cost increases. Their mortgage payments have remained stable even as rents have risen 30% to 60% in many areas. Private renters face no equivalent protection — their rents typically increase annually to market rates, and most UK tenancies are 12-month contracts with no long-term price certainty. Additionally, landlords who have seen their own mortgage costs rise sharply have passed those increases on in the form of higher rents. ONS data shows private rents rose roughly 30% between 2022 and late 2025.What can I do practically to cope with the cost of living in 2026?
The most immediately impactful actions are: reviewing all bills and switching to better deals annually (energy, insurance, broadband, mobile); checking your full benefit entitlement at entitledto.co.uk (UK) or benefits.gov (US); maximising tax-advantaged savings (ISA, Lifetime ISA, 401(k)); negotiating your salary with reference to inflation data and market benchmarks; building or replenishing an emergency fund using high-yield savings accounts or Premium Bonds while rates remain elevated; and seeking free debt advice from StepChange (UK) or the NFCC (US) if debt has become unmanageable. Small, consistent actions on multiple fronts compound over time.Will the cost of living crisis end in 2026?
Not fully — and not quickly. The annual inflation rate is falling toward the 2% target in both countries, and real wages are marginally positive again in 2026. But the cost of living crisis is not just about the inflation rate — it is about the permanent 25% increase in the price level that has already happened. For households that built up debt, depleted savings, or delayed major financial milestones during 2021 to 2023, full recovery will take several more years of real wage growth above inflation. Federal Reserve Chair Powell said in December 2025 that 'some years of real compensation significantly higher than inflation' will be needed. We are at the beginning of that process, not the end.References
House of Commons Library — Inflation in the UK: Economic Indicators (updated May 2026) https://commonslibrary.parliament.uk/research-briefings/sn02792/ONS — Inflation and Price Indices (CPI, CPIH, RPI — monthly updates) https://www.ons.gov.uk/economy/inflationandpriceindices
Statista — UK Inflation Rate CPI January 2015 to March 2026 https://www.statista.com/statistics/306648/inflation-rate-consumer-price-index-cpi-united-kingdom-uk/
Statista — UK Wage Growth vs Inflation 2015–2026 (ONS data) https://www.statista.com/statistics/1272447/uk-wage-growth-vs-inflation/
CNBC Make It — How Wages Compare With Inflation Since 2020 (January 2026) https://www.cnbc.com/2026/01/13/how-wages-compare-with-inflation-since-2020.html
USAFacts — Are Wages Keeping Up With Inflation? (March 2026 data) https://usafacts.org/answers/are-wages-keeping-up-with-inflation/country/united-states/
Bank of England — Inflation Calculator https://www.bankofengland.co.uk/monetary-policy/inflation/inflation-calculator
Ofgem — Energy Price Cap (updated quarterly) https://www.ofgem.gov.uk/check-if-energy-price-cap-affects-you
Resolution Foundation — Living Standards (cost of living research) https://www.resolutionfoundation.org/topic/living-standards/
StepChange Debt Charity — Free UK Debt Advice https://www.stepchange.org

0 Comments Comments