

Investing
ETF Dividends: How to Earn $1K to $10K Per Month

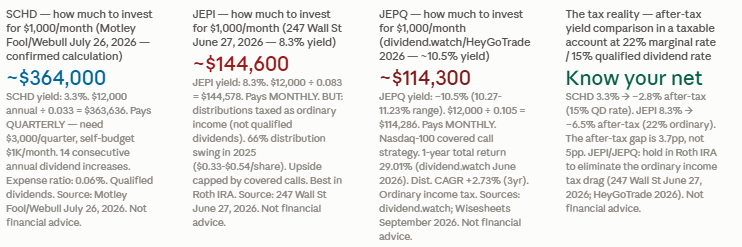
SCHD yields 3.3%. At that yield, you need approximately $364,000 invested to generate $1,000 per month in dividend income — confirmed by a Motley Fool analysis published July 26, 2026. VYM, with its broader 400+ stock basket, requires more capital for the same income at its current yield. JEPI, JPMorgan’s covered call ETF, yields approximately 8.3% and pays monthly, bringing the $1,000/month requirement down to approximately $145,000 — but its distributions are taxed as ordinary income, swing 66% in a year, and cap your upside in bull markets. JEPQ offers 10.5% yield monthly, requiring just $114,000 for $1,000/month, but adds Nasdaq tech concentration risk. This article calculates the exact investment required for every target income level across six of the most widely held dividend ETFs in 2026 — and explains why the number is only the beginning of the decision. Not financial advice.
Three important qualifications apply before the calculation becomes real-world planning. First, yields fluctuate: a 3.3% yield today could be 2.9% or 3.8% in two years. The investment amount required changes accordingly. Second, ETFs that pay quarterly (SCHD, VYM, DGRO, VIG) require you to self-budget the quarterly lump sum across three months to achieve smooth monthly income. Third, yield and total return are different: a 10.5% yield ETF that loses 4% of its capital value per year is not the equivalent of a 3.3% yield ETF that grows at 7% per year. Not financial advice.
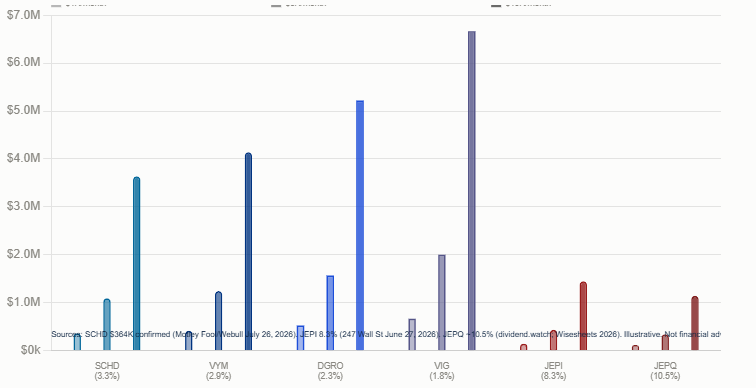
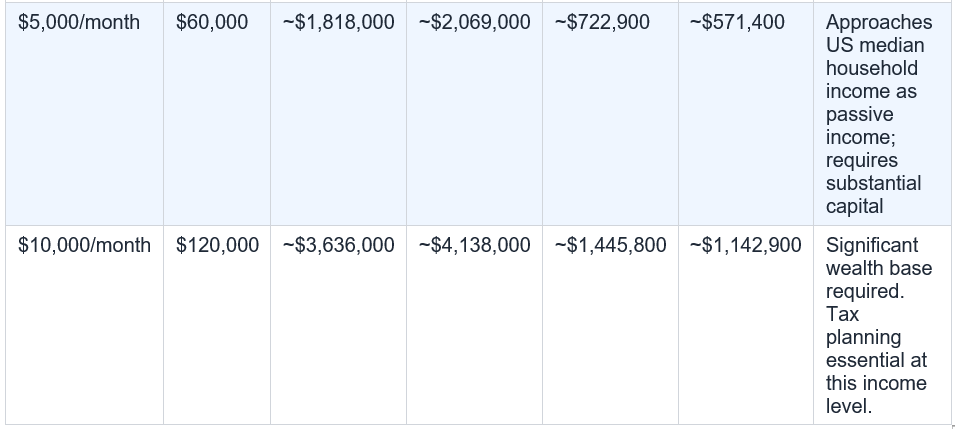
The dividend income formula: Annual income target ÷ Yield (%) = Required investment. Examples: $1,000/month = $12,000/year. At 3.3% (SCHD): $12,000 ÷ 0.033 = ~$364,000. At 8.3% (JEPI): $12,000 ÷ 0.083 = ~$144,600. At 10.5% (JEPQ): $12,000 ÷ 0.105 = ~$114,300. $3,000/month at 3.3%: ~$1,090,909 (~$1.09M). $10,000/month at 8.3%: ~$1,445,783 (~$1.45M). $10,000/month at 10.5%: ~$1,142,857 (~$1.14M). All calculations are ILLUSTRATIVE using published yields. Yields are not fixed. Not financial advice.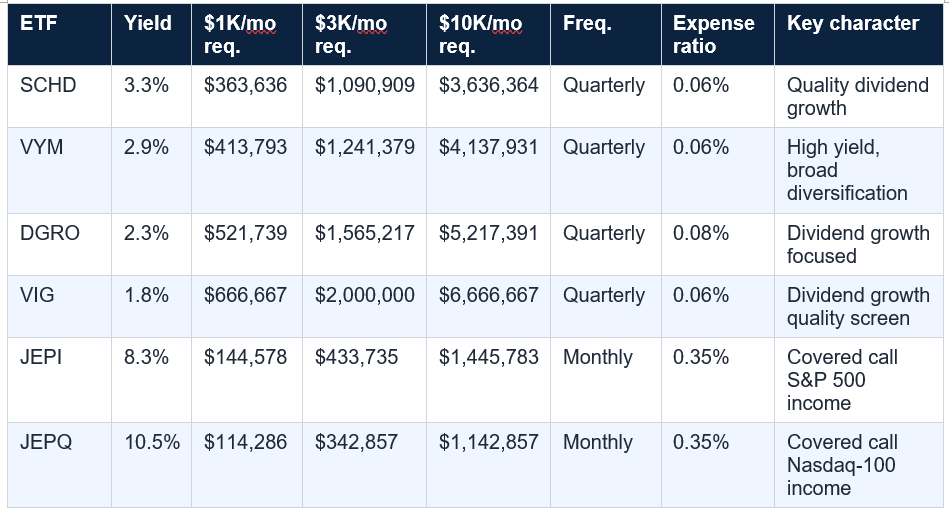
The $364,000 investment requirement for $1,000 per month is the figure most income investors grapple with. It is not a small number, but it is not an impossible one either: it is approximately 12–15 years of consistent contributions at $2,000/month invested, compounding at SCHD’s historical total return. The important nuance: SCHD pays quarterly, not monthly. The $1,000 monthly target is actually $3,000 per quarterly distribution, which the investor self-budgets across three months (Motley Fool/Webull July 26, 2026). Quarterly payments in 2026 have run in the $0.25–$0.28 per share range, predictable enough to budget around (247 Wall St July 6, 2026).
SCHD’s distributions qualify as qualified dividends for US taxpayers in a taxable account, taxed at the lower long-term capital gains rate (0%, 15%, or 20%) rather than ordinary income rates. This gives SCHD a meaningful tax advantage over JEPI and JEPQ for investors holding in taxable brokerage accounts. Not financial advice.
SCHD key data (2026): Current yield: 3.3% (Motley Fool/Webull July 26, 2026). Investment for $1K/month: ~$364,000 (Motley Fool/Webull July 26, 2026 — confirmed). Investment for $500/month: ~$187,000 (Motley Fool May 26, 2026). Distribution: quarterly. Expense ratio: 0.06%. Consecutive annual dividend increases: 14 (since 2011). Q2 2026 distributions: $0.25-$0.28/share range. Tax treatment: qualified dividends. Source: Motley Fool/Webull July 26, 2026; 247 Wall St July 6, 2026; Motley Fool May 26, 2026. Not financial advice.
The Motley Fool’s May 26, 2026 analysis on VYM is direct: at 2.3% yield, generating $500 per month requires ‘nearly $261,000’ invested. Scaling to $1,000 per month at 2.3%: approximately $522,000. At 2.9%, the requirement falls to approximately $414,000. VYM’s last four quarterly dividend payouts were $0.8417 (September 2025), $0.8617 (June 2025), $0.85 (March 2025), and $0.9642 (December 2024) (Motley Fool October 2025) — showing consistent quarterly payments but some variability. Like SCHD, VYM distributes quarterly and qualifies for qualified dividend tax treatment.
VYM’s breadth makes it the default choice for investors who want high current income with minimal concentration risk. No single stock comprises more than about 4% of the fund. As the Motley Fool framed it in May 2026, the 2.3% yield ‘makes it challenging to generate a lot of income’ compared to SCHD or the covered call ETFs — but VYM’s combination of broad diversification, low fees, and qualified dividend status gives it a specific place in many income portfolios. Not financial advice.
For someone targeting $1,000 per month starting today, DGRO and VIG are the hardest path: at DGRO’s 2.3% yield, approximately $522,000 is required; at VIG’s 1.8%, approximately $667,000. But for someone in the accumulation phase who will not need the income for 10–15 years, the compounding of a faster-growing dividend can eventually produce a larger income stream than a higher-yield, lower-growth ETF. The DividendInvestors substack comparison (April 2025) notes VIG as having the ‘cleanest dividend growth quality screen’ but ‘not ideal for retirees needing high current income.’
Both DGRO and VIG pay quarterly. Both have very low expense ratios (DGRO 0.08%; VIG 0.06%). Both generate qualified dividends. Both are better portfolio complements to higher-yield ETFs than standalone income generators. A common pairing cited in the HeyGoTrade 2026 guide: SCHD plus VIG, or VYM plus DGRO, to balance income today with growth tomorrow. Not financial advice.
But the 247 Wall St June 27, 2026 analysis captures the critical caution: ‘JEPI’s monthly payments fluctuated 66% in 2025, ranging from $0.33 to $0.54’ per share. The variation is driven by the VIX (volatility index) — when markets are calm, option premiums are lower and JEPI pays less; when volatility spikes, premiums are higher and JEPI pays more. An income investor budgeting for $1,000 per month needs to plan for months where JEPI delivers significantly less than the projected average.
Two additional structural limits for JEPI. First: distributions are taxed as ordinary income, not qualified dividends. For a single filer in the 22% bracket, JEPI’s 8.3% yield shrinks to approximately 6.5% after federal tax in a taxable account, versus SCHD’s 3.3% shrinking to approximately 2.6% at a 15% qualified dividend rate. The tax advantage of SCHD’s qualified dividends narrows the after-tax yield gap. Second: the covered call strategy caps upside — 247 Wall St June 2026 noted JEPI’s gains were capped at approximately 8% over the trailing year while the S&P 500 returned 11%. Not financial advice.
JEPI risk summary: (1) Distributions taxed as ORDINARY INCOME — not qualified dividends. In a taxable account at 22% bracket: 8.3% yield becomes ~6.5% after-tax. Best held in Roth IRA or 401(k) (247 Wall St June 27, 2026; HeyGoTrade 2026). (2) 66% distribution swing in 2025 ($0.33 to $0.54/share) — monthly income is NOT stable (247 Wall St June 27, 2026). VIX-driven variability means lower income in low-volatility bull markets. (3) Capped upside: selling calls limits participation in rallies. JEPI capped at ~8% trailing year; S&P 500 returned 11% (247 Wall St June 27, 2026). (4) Dividend CAGR (3y): -8.76% — the distributions have been DECLINING, not growing (dividend.watch June 2026). Not financial advice.
The performance comparison with JEPI is striking: JEPQ’s 1-year total return is 29.01% vs JEPI’s 7.78%; its 3-year return is 20.93% vs JEPI’s 8.84% (dividend.watch June 2026). This reflects the Nasdaq-100’s tech-led bull market performance outweighing the cost of the covered call cap. JEPQ’s dividend CAGR over three years is +2.73% — distributions are growing, unlike JEPI’s declining -8.76% CAGR. For income investors with growth ambitions, JEPQ has performed better than its older sibling in recent years.
The 247 Wall St June 26, 2026 analysis captures the trade-off: ‘Investing $1,000 every month for 20 years means $240,000 in contributions. JEPQ’s recent monthly payouts have ranged from $0.47 to $0.59. Since May 2022, JEPQ has returned about 84%.’ But it also concludes: ‘If your only goal is total wealth at the end of 20 years, the covered-call wrapper is a tax on growth you pay in exchange for cash flow you can spend now.’ JEPQ makes sense as a 5–15% sleeve for someone who needs current income and accepts capped Nasdaq upside (247 Wall St June 26, 2026). Not financial advice.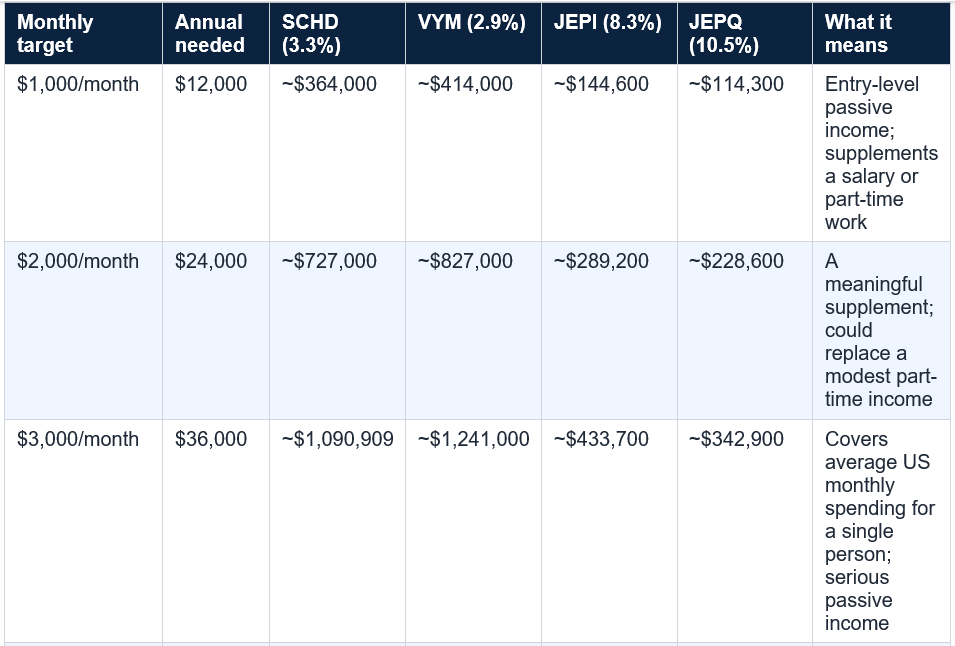
For a retiree or someone relying on dividend income to cover living expenses, quarterly payments require either a separate cash management strategy — parking three months of income in a money market or high-yield savings account and drawing from it monthly — or a tolerance for lumpy income. JEPI and JEPQ’s monthly distributions are more cash-flow friendly for this purpose, though their higher expense ratios and ordinary income tax treatment partially offset that convenience advantage.
A practical solution used by many income investors: hold SCHD or VYM as the core for tax efficiency and distribution growth, and add a small allocation to JEPI for monthly cash flow smoothing. This keeps the majority of income in tax-efficient qualified dividends while providing a monthly payment to cover ongoing expenses. Not financial advice.
The HeyGoTrade 2026 JEPI vs JEPQ comparison guide arrives at the same conclusion: ‘JEPI and JEPQ work best inside an IRA or 401(k), where the ordinary-income classification does not matter.’ For a high earner in the 32% marginal bracket, JEPI’s 8.3% yield becomes approximately 5.6% after-tax in a taxable account. SCHD’s 3.3% yield, taxed at 15% qualified dividend rate, becomes approximately 2.8% after-tax. The gap narrows from 5 percentage points gross to approximately 2.8 percentage points after-tax.
The investment account type decision therefore interacts directly with the ETF choice. Maximise Roth IRA space for JEPI/JEPQ (where high ordinary income generates no tax); hold SCHD/VYM in taxable accounts (where qualified dividends receive preferential treatment). This tax-location strategy is one of the most powerful personal finance levers available for dividend income investors. Not financial advice. Consult a CPA for tax-specific guidance.
For long-term wealth builders, this cap is a real cost. 247 Wall St June 26, 2026 concluded in the JEPQ 20-year analysis: ‘If your only goal is total wealth at the end of 20 years, the covered-call wrapper is a tax on growth you pay in exchange for cash flow you can spend now.’ Over 20 years, the compounding gap between JEPQ and unconstrained Nasdaq exposure (like QQQ) is significant: JEPQ trailed QQQ 24% to 32% in a recent single year, and ‘the gap widens over time as covered calls repeatedly cap the best recovery months.’
The appropriate conclusion: JEPI and JEPQ are income tools, not wealth-building tools. They solve a specific problem — generating monthly cash flow now, with known income, in exchange for capped appreciation. For retirees or near-retirees who need current income more than future growth, the trade-off is rational. For investors with a 20-year horizon who do not need the income today, accepting capped upside for yield they reinvest does not maximise terminal wealth. Not financial advice.
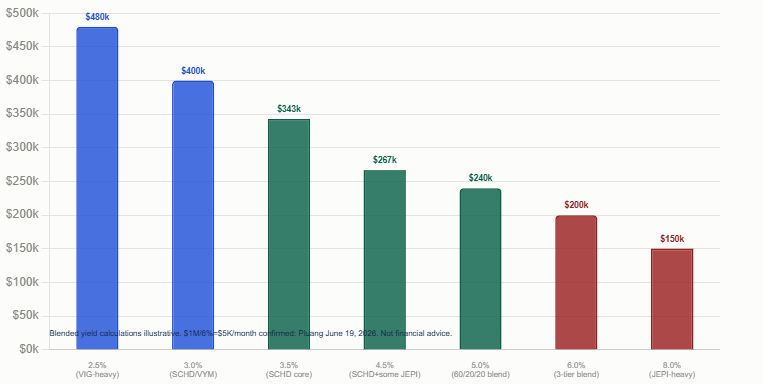
Pluang’s June 2026 analysis describes a three-tier blended approach targeting a 6% blended yield: conservative dividend growth ETFs (SCHD tier), moderate covered-call and REIT funds (middle tier), and aggressive high-yield funds (JEPI/JEPQ tier). The finding: ‘A $1 million investment portfolio targeting a 6% blended yield can produce about $5,000 monthly income.’ At 6% blended yield: $5,000 × 12 = $60,000 annual ÷ 0.06 = $1,000,000. The maths confirms the formula.
The practical blended approach for an investor targeting $1,000 per month who wants both current income and growth: 60% SCHD or VYM (core qualified dividend income), 20% DGRO or VIG (dividend growth), 20% JEPI (monthly income and high yield, held in a Roth IRA for tax efficiency). This produces a blended yield of approximately 4.5–5.0%, requiring approximately $240,000–$267,000 in total investment. Not financial advice.
The dividend reinvestment mechanism (DRIP) is critical to this trajectory. Reinvesting distributions buys more shares, which generate more distributions, which buy more shares. Early in the accumulation phase, the contribution dominates. Later, the compounding of reinvested distributions becomes the growth driver. The Motley Fool/Webull July 26, 2026 SCHD article notes: ‘Reinvesting the fund’s distributions can also help improve how much income the fund is able to generate in the future.’
The time horizon required depends on the monthly contribution and the target income level. At $1,000 per month contributed to SCHD at a hypothetical 10% total annual return (including reinvested dividends), the $364,000 required for $1,000/month of income would be reached in approximately 14–15 years. At $2,000/month contributed: approximately 10–11 years. These are illustrative projections, not guarantees. Not financial advice.
Building toward $1K/month in ETF dividend income: (1) Start with SCHD or VYM — low cost (0.06%), quality screening, qualified dividends. (2) Reinvest all distributions via DRIP during accumulation — compounding is what makes the timeline work. (3) Allocate JEPI/JEPQ to a Roth IRA or 401(k) to avoid ordinary income tax drag. (4) Consider the 60/20/20 blend: 60% SCHD/VYM, 20% DGRO/VIG, 20% JEPI in Roth. (5) Do not anchor to the yield alone — check total return, distribution growth, and expense ratio. (6) Budget quarterly ETF distributions across three months; use a money market account as a monthly smoothing buffer. Not financial advice. Consult a qualified CFP.
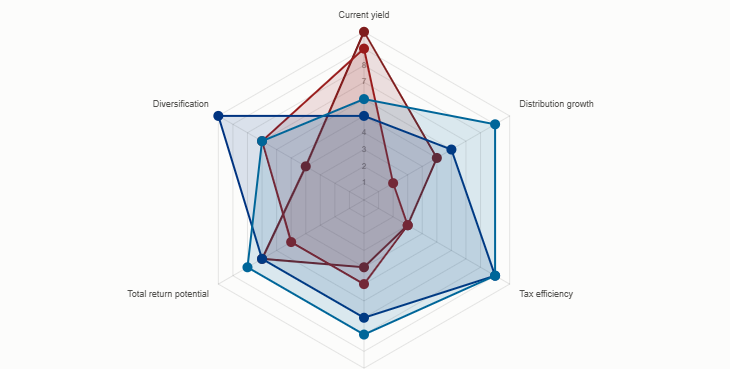
The honest conclusion is that no single ETF is the perfect dividend income vehicle. SCHD wins on quality, tax efficiency, and long-term distribution growth. VYM wins on diversification and breadth. JEPI wins on monthly payment convenience and yield for Roth IRA holders. JEPQ wins on current yield and total return, within the covered call structure’s limits. The blended approach — SCHD as the core, DGRO or VIG for growth, JEPI or JEPQ in a tax-advantaged account for income smoothing — produces the most resilient income portfolio for most investors.
The calculation is the entry point, not the destination. Deciding how much to invest for $1,000, $3,000, or $10,000 per month requires also deciding: what tax accounts do I use? what yield variability can I tolerate? how long is my time horizon? am I building wealth or drawing income? The ETF universe provides specific, data-backed tools for each of these answers. The investment required is calculable. The right tool is a matter of personal finance circumstances. Not financial advice. Consult a qualified CFP and CPA for personalised guidance.
According to a Motley Fool analysis published July 26, 2026 (cited on Webull), generating $1,000 per month from SCHD requires approximately $364,000 invested at SCHD's current 3.3% yield. The calculation: $1,000/month × 12 months = $12,000 annual income needed. $12,000 ÷ 0.033 (3.3% yield) = $363,636, rounded to approximately $364,000. Important qualifier: SCHD pays quarterly, not monthly. To achieve $1,000/month, you actually need $3,000 in quarterly distributions, which you then self-budget across three months (Motley Fool/Webull July 26, 2026). Yield fluctuates; the $364,000 figure changes if the yield moves to 3.0% or 3.8%. SCHD has increased its total annual dividend for 14 consecutive years (Motley Fool/Webull). Not financial advice.
What is the difference between JEPI and SCHD for monthly dividend income?
The two ETFs serve the same broad goal — dividend income — but with fundamentally different structures, yields, and trade-offs. SCHD: approximately 3.3% yield; quarterly distributions; qualified dividend tax treatment; 0.06% expense ratio; distributions have grown for 14 consecutive years; upside is not capped; for $1K/month requires ~$364,000 (Motley Fool July 2026). JEPI: approximately 8.3% yield; monthly distributions; ordinary income tax treatment (NOT qualified dividends); 0.35% expense ratio; distributions declined at -8.76% CAGR over 3 years (dividend.watch June 2026); upside capped by covered call strategy; for $1K/month requires ~$144,600. Key insight: JEPI's tax disadvantage in taxable accounts narrows the effective after-tax yield gap. JEPI works best in a Roth IRA or 401(k) where ordinary income tax doesn't apply (247 Wall St June 27, 2026; HeyGoTrade 2026). Not financial advice.
What is JEPQ's monthly dividend yield?
JEPQ (JPMorgan Nasdaq Equity Premium Income ETF) has a trailing twelve-month dividend yield of approximately 10.27-11.23%, depending on the source and date. Wisesheets (September 2026) cites 11.23% TTM with a most recent distribution of $0.6825 per share (paid September 3, 2026). Dividend.watch (June 5, 2026) cites 10.27-10.39%. Monthly distributions in 2026 ranged from $0.47 (February 2026) to $0.59 (May 2026) (247 Wall St June 26, 2026). JEPQ pays monthly. Expense ratio: 0.35%. Like JEPI, JEPQ distributions are taxed as ordinary income — best held in a tax-advantaged account. 1-year total return (June 2026): 29.01%; 3-year: 20.93% — stronger than JEPI due to Nasdaq-100's tech-driven performance (dividend.watch June 2026). Not financial advice.
How does dividend reinvestment affect how long it takes to reach an income target?
Dividend reinvestment (DRIP) is the primary mechanism that accelerates the timeline to a target income level. When distributions are reinvested rather than taken as cash, they purchase additional shares. Those additional shares generate additional distributions, which purchase more shares — the compounding loop. The Motley Fool (October 2025) illustrated this with VYM: investing $500 per month at an assumed 11% annual total return (including reinvested dividends) over 30 years grows to approximately $686,000, which at VYM's 3% yield generates ~$20,580/year (~$1,715/month). Without reinvestment, the same $500/month compounded at 11% would produce a different (typically lower) terminal portfolio and lower income. During the accumulation phase, reinvesting all distributions is mathematically optimal if you don't need the income immediately. When income is needed, switch from DRIP to cash distributions. Not financial advice.
What is a blended dividend ETF portfolio and what yield can it achieve?
A blended dividend ETF portfolio combines multiple ETFs with different yield characteristics and distribution frequencies to achieve a target blended yield while reducing concentration risk. 247 Wall St (July 6, 2026) described a four-ETF blend (SCHD, VYM, DGRO, VIG) targeting $24,000 per year ($2,000/month) requiring roughly $600,000-$800,000 invested — implying a blended yield of approximately 3-4%. Pluang (June 2026) described a three-tier approach targeting 6% blended yield: conservative (SCHD type), moderate (covered call/REIT type), aggressive (JEPI/JEPQ type) — '$1 million targeting 6% blended yield produces about $5,000 monthly.' A practical example blended portfolio: 60% SCHD/VYM (qualified dividends, core income), 20% DGRO/VIG (growth), 20% JEPI in Roth IRA (monthly income, ordinary income shielded from tax). Blended yield approximately 4.5-5.0%. Required investment for $1K/month at 4.75% blended yield: approximately $253,000. Not financial advice.
Table of Contents
- The Core Formula: How Dividend Income Calculations Work
- The Master Income Table: All Six ETFs, All Three Targets
- ETF Profile: SCHD — The Quality Core Income Engine
- ETF Profile: VYM — The High Yield Diversifier
- ETF Profile: DGRO and VIG — The Growth-Oriented Pair
- ETF Profile: JEPI — The 8.3% Monthly Income Machine
- ETF Profile: JEPQ — The 10.5% Nasdaq-Covered Call Yield
- The Income Target Breakdown: $1K, $3K, and $10K per Month
- The Quarterly vs Monthly Problem
- The Tax Question: Why Yield Alone Doesn’t Tell the Full Story
- The Covered Call Trade-Off: Income Today vs Growth Tomorrow
- The Blended Portfolio Approach: Combining ETFs for Yield and Growth
- Building Toward the Target: What Dollar-Cost Averaging Achieves
- Conclusion: The Number Is Just the Beginning
- Frequently Asked Questions
Investment required by ETF and income target
The trade-off matrix — yield, growth, tax, risk
Blended portfolio scenarios — how mixing ETFs changes the numbers
The Core Formula: How Dividend Income Calculations Work
The maths of dividend income from ETFs is simple but specific. Annual income needed equals monthly target multiplied by 12. Investment required equals annual income needed divided by the dividend yield expressed as a decimal. For $1,000 per month: $1,000 × 12 = $12,000 annual income needed. At SCHD’s 3.3% yield: $12,000 ÷ 0.033 = $363,636 — approximately $364,000. This is the figure confirmed directly by a Motley Fool analysis published July 26, 2026, cited on Webull, which stated: ‘If we divide that total by the fund’s current 3.3% yield, the required investment comes out to roughly $364,000.’Three important qualifications apply before the calculation becomes real-world planning. First, yields fluctuate: a 3.3% yield today could be 2.9% or 3.8% in two years. The investment amount required changes accordingly. Second, ETFs that pay quarterly (SCHD, VYM, DGRO, VIG) require you to self-budget the quarterly lump sum across three months to achieve smooth monthly income. Third, yield and total return are different: a 10.5% yield ETF that loses 4% of its capital value per year is not the equivalent of a 3.3% yield ETF that grows at 7% per year. Not financial advice.
The dividend income formula: Annual income target ÷ Yield (%) = Required investment. Examples: $1,000/month = $12,000/year. At 3.3% (SCHD): $12,000 ÷ 0.033 = ~$364,000. At 8.3% (JEPI): $12,000 ÷ 0.083 = ~$144,600. At 10.5% (JEPQ): $12,000 ÷ 0.105 = ~$114,300. $3,000/month at 3.3%: ~$1,090,909 (~$1.09M). $10,000/month at 8.3%: ~$1,445,783 (~$1.45M). $10,000/month at 10.5%: ~$1,142,857 (~$1.14M). All calculations are ILLUSTRATIVE using published yields. Yields are not fixed. Not financial advice.
The Master Income Table: All Six ETFs, All Three Targets
SCHD — Schwab US Dividend Equity ETF — The Quality Core
SCHD is the most widely discussed dividend ETF for income investors in 2026, and its popularity is grounded in three specific qualities: yield, quality screening, and cost. The current yield is approximately 3.3% (Motley Fool/Webull July 26, 2026), derived from a portfolio of high-quality dividend-paying stocks that have demonstrated a consistent ability to pay and grow their dividends over time. The fund has increased its total annual dividend paid for 14 consecutive years since its 2011 inception. The expense ratio is just 0.06%, meaning $9,994 of every $10,000 stays working (247 Wall St July 6, 2026).The $364,000 investment requirement for $1,000 per month is the figure most income investors grapple with. It is not a small number, but it is not an impossible one either: it is approximately 12–15 years of consistent contributions at $2,000/month invested, compounding at SCHD’s historical total return. The important nuance: SCHD pays quarterly, not monthly. The $1,000 monthly target is actually $3,000 per quarterly distribution, which the investor self-budgets across three months (Motley Fool/Webull July 26, 2026). Quarterly payments in 2026 have run in the $0.25–$0.28 per share range, predictable enough to budget around (247 Wall St July 6, 2026).
SCHD’s distributions qualify as qualified dividends for US taxpayers in a taxable account, taxed at the lower long-term capital gains rate (0%, 15%, or 20%) rather than ordinary income rates. This gives SCHD a meaningful tax advantage over JEPI and JEPQ for investors holding in taxable brokerage accounts. Not financial advice.
SCHD key data (2026): Current yield: 3.3% (Motley Fool/Webull July 26, 2026). Investment for $1K/month: ~$364,000 (Motley Fool/Webull July 26, 2026 — confirmed). Investment for $500/month: ~$187,000 (Motley Fool May 26, 2026). Distribution: quarterly. Expense ratio: 0.06%. Consecutive annual dividend increases: 14 (since 2011). Q2 2026 distributions: $0.25-$0.28/share range. Tax treatment: qualified dividends. Source: Motley Fool/Webull July 26, 2026; 247 Wall St July 6, 2026; Motley Fool May 26, 2026. Not financial advice.
VYM — Vanguard High Dividend Yield ETF — The Broad Yield Basket
VYM takes the widest approach to dividend income of any ETF on this list: it tracks the FTSE High Dividend Yield Index by selecting the top 50% of forward-looking yields from a broad US large-cap universe, resulting in 400–600+ stocks (Motley Fool May 26, 2026; 247 Wall St July 6, 2026). At approximately 2.3–2.9% yield (sources differ; Motley Fool May 2026 cites 2.3%; broader data including DividendInvestors April 2025 suggests 2.9%), VYM offers less current yield than SCHD but more diversification. Its breadth means no single dividend cut significantly damages the portfolio’s overall income.The Motley Fool’s May 26, 2026 analysis on VYM is direct: at 2.3% yield, generating $500 per month requires ‘nearly $261,000’ invested. Scaling to $1,000 per month at 2.3%: approximately $522,000. At 2.9%, the requirement falls to approximately $414,000. VYM’s last four quarterly dividend payouts were $0.8417 (September 2025), $0.8617 (June 2025), $0.85 (March 2025), and $0.9642 (December 2024) (Motley Fool October 2025) — showing consistent quarterly payments but some variability. Like SCHD, VYM distributes quarterly and qualifies for qualified dividend tax treatment.
VYM’s breadth makes it the default choice for investors who want high current income with minimal concentration risk. No single stock comprises more than about 4% of the fund. As the Motley Fool framed it in May 2026, the 2.3% yield ‘makes it challenging to generate a lot of income’ compared to SCHD or the covered call ETFs — but VYM’s combination of broad diversification, low fees, and qualified dividend status gives it a specific place in many income portfolios. Not financial advice.
DGRO / VIG — iShares DGRO and Vanguard VIG — The Growth-Oriented Pair
DGRO (iShares Core Dividend Growth ETF) and VIG (Vanguard Dividend Appreciation ETF) occupy the same philosophical space: they prioritise dividend growth over current yield, accepting a lower starting yield (DGRO approximately 2.3%; VIG approximately 1.8%) in exchange for faster dividend increases over time. These are the ‘plant now, harvest later’ ETFs in the dividend income universe. As the HeyGoTrade 2026 comparison guide summarises: ‘If you care more about dividend growth than starting yield, DGRO and VIG fit better.’For someone targeting $1,000 per month starting today, DGRO and VIG are the hardest path: at DGRO’s 2.3% yield, approximately $522,000 is required; at VIG’s 1.8%, approximately $667,000. But for someone in the accumulation phase who will not need the income for 10–15 years, the compounding of a faster-growing dividend can eventually produce a larger income stream than a higher-yield, lower-growth ETF. The DividendInvestors substack comparison (April 2025) notes VIG as having the ‘cleanest dividend growth quality screen’ but ‘not ideal for retirees needing high current income.’
Both DGRO and VIG pay quarterly. Both have very low expense ratios (DGRO 0.08%; VIG 0.06%). Both generate qualified dividends. Both are better portfolio complements to higher-yield ETFs than standalone income generators. A common pairing cited in the HeyGoTrade 2026 guide: SCHD plus VIG, or VYM plus DGRO, to balance income today with growth tomorrow. Not financial advice.
JEPI — JPMorgan Equity Premium Income ETF — The 8.3% Monthly Paycheck
JEPI has accumulated approximately $44 billion in assets (dividend.watch June 2026) by solving a specific problem: generating high monthly income from a portfolio of large-cap S&P 500 stocks combined with a covered call overlay via equity-linked notes (ELNs). The current yield is approximately 8.3% (247 Wall St June 27, 2026). Unlike SCHD and VYM, JEPI pays every month — it has never missed a monthly payment since its May 2020 inception (AOL/247 Wall St January 2026). The $1,000/month investment requirement at 8.3% is approximately $144,600 — dramatically lower than SCHD or VYM.But the 247 Wall St June 27, 2026 analysis captures the critical caution: ‘JEPI’s monthly payments fluctuated 66% in 2025, ranging from $0.33 to $0.54’ per share. The variation is driven by the VIX (volatility index) — when markets are calm, option premiums are lower and JEPI pays less; when volatility spikes, premiums are higher and JEPI pays more. An income investor budgeting for $1,000 per month needs to plan for months where JEPI delivers significantly less than the projected average.
Two additional structural limits for JEPI. First: distributions are taxed as ordinary income, not qualified dividends. For a single filer in the 22% bracket, JEPI’s 8.3% yield shrinks to approximately 6.5% after federal tax in a taxable account, versus SCHD’s 3.3% shrinking to approximately 2.6% at a 15% qualified dividend rate. The tax advantage of SCHD’s qualified dividends narrows the after-tax yield gap. Second: the covered call strategy caps upside — 247 Wall St June 2026 noted JEPI’s gains were capped at approximately 8% over the trailing year while the S&P 500 returned 11%. Not financial advice.
JEPI risk summary: (1) Distributions taxed as ORDINARY INCOME — not qualified dividends. In a taxable account at 22% bracket: 8.3% yield becomes ~6.5% after-tax. Best held in Roth IRA or 401(k) (247 Wall St June 27, 2026; HeyGoTrade 2026). (2) 66% distribution swing in 2025 ($0.33 to $0.54/share) — monthly income is NOT stable (247 Wall St June 27, 2026). VIX-driven variability means lower income in low-volatility bull markets. (3) Capped upside: selling calls limits participation in rallies. JEPI capped at ~8% trailing year; S&P 500 returned 11% (247 Wall St June 27, 2026). (4) Dividend CAGR (3y): -8.76% — the distributions have been DECLINING, not growing (dividend.watch June 2026). Not financial advice.
JEPQ — JPMorgan Nasdaq Equity Premium Income ETF — The 10.5% Monthly Yield
JEPQ is JEPI’s Nasdaq-100 counterpart: same covered call structure via ELNs, same monthly distribution schedule, same 0.35% expense ratio — but applied to technology-heavy Nasdaq-100 stocks rather than S&P 500 large caps. The result: higher yield (approximately 10.5%, with sources ranging from 10.27% to 11.23%) because Nasdaq-100 stocks carry higher implied volatility, generating more option premium income. Monthly distributions in 2026 ranged from $0.47 (February 2026) to $0.59 (May 2026), with $0.6825 paid in September 2026 (Wisesheets September 2026).The performance comparison with JEPI is striking: JEPQ’s 1-year total return is 29.01% vs JEPI’s 7.78%; its 3-year return is 20.93% vs JEPI’s 8.84% (dividend.watch June 2026). This reflects the Nasdaq-100’s tech-led bull market performance outweighing the cost of the covered call cap. JEPQ’s dividend CAGR over three years is +2.73% — distributions are growing, unlike JEPI’s declining -8.76% CAGR. For income investors with growth ambitions, JEPQ has performed better than its older sibling in recent years.
The 247 Wall St June 26, 2026 analysis captures the trade-off: ‘Investing $1,000 every month for 20 years means $240,000 in contributions. JEPQ’s recent monthly payouts have ranged from $0.47 to $0.59. Since May 2022, JEPQ has returned about 84%.’ But it also concludes: ‘If your only goal is total wealth at the end of 20 years, the covered-call wrapper is a tax on growth you pay in exchange for cash flow you can spend now.’ JEPQ makes sense as a 5–15% sleeve for someone who needs current income and accepts capped Nasdaq upside (247 Wall St June 26, 2026). Not financial advice.
The Income Target Breakdown: $1K, $3K, and $10K per Month
The Quarterly vs Monthly Problem
The single most practically important distinction for income planning is payment frequency. SCHD, VYM, DGRO, and VIG all pay quarterly — four times per year. JEPI and JEPQ pay monthly — twelve times per year. The Motley Fool/Webull July 26, 2026 SCHD analysis is explicit: ‘This fund pays distributions quarterly, so what you’d actually need to look for is $3,000 in quarterly dividends that you can then budget out to $1,000 monthly.’For a retiree or someone relying on dividend income to cover living expenses, quarterly payments require either a separate cash management strategy — parking three months of income in a money market or high-yield savings account and drawing from it monthly — or a tolerance for lumpy income. JEPI and JEPQ’s monthly distributions are more cash-flow friendly for this purpose, though their higher expense ratios and ordinary income tax treatment partially offset that convenience advantage.
A practical solution used by many income investors: hold SCHD or VYM as the core for tax efficiency and distribution growth, and add a small allocation to JEPI for monthly cash flow smoothing. This keeps the majority of income in tax-efficient qualified dividends while providing a monthly payment to cover ongoing expenses. Not financial advice.
The Tax Question: Why Yield Alone Doesn’t Tell the Full Story
The after-tax yield is the real yield that determines income in a taxable account. For SCHD and VYM, distributions qualify as qualified dividends — taxed at 0%, 15%, or 20% depending on total income. For JEPI and JEPQ, distributions are classified as ordinary income, taxed at the investor’s marginal rate (10–37%). The 247 Wall St June 27, 2026 JEPI analysis is explicit: ‘JEPI distributions are taxed as ordinary income, so holding it in a Roth IRA eliminates the tax drag eating into that 8.3% yield.’The HeyGoTrade 2026 JEPI vs JEPQ comparison guide arrives at the same conclusion: ‘JEPI and JEPQ work best inside an IRA or 401(k), where the ordinary-income classification does not matter.’ For a high earner in the 32% marginal bracket, JEPI’s 8.3% yield becomes approximately 5.6% after-tax in a taxable account. SCHD’s 3.3% yield, taxed at 15% qualified dividend rate, becomes approximately 2.8% after-tax. The gap narrows from 5 percentage points gross to approximately 2.8 percentage points after-tax.
The investment account type decision therefore interacts directly with the ETF choice. Maximise Roth IRA space for JEPI/JEPQ (where high ordinary income generates no tax); hold SCHD/VYM in taxable accounts (where qualified dividends receive preferential treatment). This tax-location strategy is one of the most powerful personal finance levers available for dividend income investors. Not financial advice. Consult a CPA for tax-specific guidance.
The Covered Call Trade-Off: Income Today vs Growth Tomorrow
The covered call ETFs (JEPI, JEPQ) generate their high yields by selling call options against their stock holdings. When you sell a call option, you receive a premium immediately but agree to sell your shares at a fixed price if the market rises above that price. The result: in sideways or falling markets, the option premium is pure income. In rising markets, the option is exercised and you miss the upside above the strike price. This is why 247 Wall St June 27, 2026 described JEPI as having ‘gains capped at roughly 8%’ while the S&P 500 returned 11%.For long-term wealth builders, this cap is a real cost. 247 Wall St June 26, 2026 concluded in the JEPQ 20-year analysis: ‘If your only goal is total wealth at the end of 20 years, the covered-call wrapper is a tax on growth you pay in exchange for cash flow you can spend now.’ Over 20 years, the compounding gap between JEPQ and unconstrained Nasdaq exposure (like QQQ) is significant: JEPQ trailed QQQ 24% to 32% in a recent single year, and ‘the gap widens over time as covered calls repeatedly cap the best recovery months.’
The appropriate conclusion: JEPI and JEPQ are income tools, not wealth-building tools. They solve a specific problem — generating monthly cash flow now, with known income, in exchange for capped appreciation. For retirees or near-retirees who need current income more than future growth, the trade-off is rational. For investors with a 20-year horizon who do not need the income today, accepting capped upside for yield they reinvest does not maximise terminal wealth. Not financial advice.
The Blended Portfolio Approach: Combining ETFs for Yield and Growth
The 247 Wall St July 6, 2026 article on the four-ETF strategy for $2,000 per month (‘reaching $2,000 monthly requires roughly $600,000 to $800,000 invested’) uses a blended SCHD, VYM, DGRO, VIG portfolio. The logic: spreading across four ETFs ensures no single dividend cut wrecks the monthly budget. The blended yield across SCHD (3.3%) + VYM (2.9%) + DGRO (2.3%) + VIG (1.8%) is approximately 2.6–3.0% — lower than SCHD alone, but with more diversification of dividend source risk.Pluang’s June 2026 analysis describes a three-tier blended approach targeting a 6% blended yield: conservative dividend growth ETFs (SCHD tier), moderate covered-call and REIT funds (middle tier), and aggressive high-yield funds (JEPI/JEPQ tier). The finding: ‘A $1 million investment portfolio targeting a 6% blended yield can produce about $5,000 monthly income.’ At 6% blended yield: $5,000 × 12 = $60,000 annual ÷ 0.06 = $1,000,000. The maths confirms the formula.
The practical blended approach for an investor targeting $1,000 per month who wants both current income and growth: 60% SCHD or VYM (core qualified dividend income), 20% DGRO or VIG (dividend growth), 20% JEPI (monthly income and high yield, held in a Roth IRA for tax efficiency). This produces a blended yield of approximately 4.5–5.0%, requiring approximately $240,000–$267,000 in total investment. Not financial advice.
Building Toward the Target: What Dollar-Cost Averaging Achieves
For most investors, the six-figure investment requirement is not a lump sum available today — it is a target reached through consistent monthly contributions and reinvestment over years. The Motley Fool October 2025 analysis of VYM illustrates the trajectory: investing $500 per month into VYM, with dividends reinvested, at approximately 11% average annual return over 30 years grows to approximately $686,000. At VYM’s 3% average yield, that produces $20,580 annually — approximately $1,715 per month.The dividend reinvestment mechanism (DRIP) is critical to this trajectory. Reinvesting distributions buys more shares, which generate more distributions, which buy more shares. Early in the accumulation phase, the contribution dominates. Later, the compounding of reinvested distributions becomes the growth driver. The Motley Fool/Webull July 26, 2026 SCHD article notes: ‘Reinvesting the fund’s distributions can also help improve how much income the fund is able to generate in the future.’
The time horizon required depends on the monthly contribution and the target income level. At $1,000 per month contributed to SCHD at a hypothetical 10% total annual return (including reinvested dividends), the $364,000 required for $1,000/month of income would be reached in approximately 14–15 years. At $2,000/month contributed: approximately 10–11 years. These are illustrative projections, not guarantees. Not financial advice.
Building toward $1K/month in ETF dividend income: (1) Start with SCHD or VYM — low cost (0.06%), quality screening, qualified dividends. (2) Reinvest all distributions via DRIP during accumulation — compounding is what makes the timeline work. (3) Allocate JEPI/JEPQ to a Roth IRA or 401(k) to avoid ordinary income tax drag. (4) Consider the 60/20/20 blend: 60% SCHD/VYM, 20% DGRO/VIG, 20% JEPI in Roth. (5) Do not anchor to the yield alone — check total return, distribution growth, and expense ratio. (6) Budget quarterly ETF distributions across three months; use a money market account as a monthly smoothing buffer. Not financial advice. Consult a qualified CFP.
Conclusion
The numbers are specific. At SCHD’s 3.3% yield, $364,000 generates $1,000 per month (confirmed Motley Fool July 2026). At JEPQ’s 10.5%, just $114,300 does the same job — but with monthly distributions that vary by 30–40%, ordinary income tax treatment, and capped upside from the Nasdaq-100 covered call overlay. At $10,000 per month: SCHD requires approximately $3.6 million; JEPQ requires approximately $1.14 million. The higher the yield, the lower the capital requirement — but the higher the trade-offs in variability, tax, and growth foregone.The honest conclusion is that no single ETF is the perfect dividend income vehicle. SCHD wins on quality, tax efficiency, and long-term distribution growth. VYM wins on diversification and breadth. JEPI wins on monthly payment convenience and yield for Roth IRA holders. JEPQ wins on current yield and total return, within the covered call structure’s limits. The blended approach — SCHD as the core, DGRO or VIG for growth, JEPI or JEPQ in a tax-advantaged account for income smoothing — produces the most resilient income portfolio for most investors.
The calculation is the entry point, not the destination. Deciding how much to invest for $1,000, $3,000, or $10,000 per month requires also deciding: what tax accounts do I use? what yield variability can I tolerate? how long is my time horizon? am I building wealth or drawing income? The ETF universe provides specific, data-backed tools for each of these answers. The investment required is calculable. The right tool is a matter of personal finance circumstances. Not financial advice. Consult a qualified CFP and CPA for personalised guidance.
Frequently Asked Questions
How much do I need to invest in SCHD to earn $1,000 per month?According to a Motley Fool analysis published July 26, 2026 (cited on Webull), generating $1,000 per month from SCHD requires approximately $364,000 invested at SCHD's current 3.3% yield. The calculation: $1,000/month × 12 months = $12,000 annual income needed. $12,000 ÷ 0.033 (3.3% yield) = $363,636, rounded to approximately $364,000. Important qualifier: SCHD pays quarterly, not monthly. To achieve $1,000/month, you actually need $3,000 in quarterly distributions, which you then self-budget across three months (Motley Fool/Webull July 26, 2026). Yield fluctuates; the $364,000 figure changes if the yield moves to 3.0% or 3.8%. SCHD has increased its total annual dividend for 14 consecutive years (Motley Fool/Webull). Not financial advice.
What is the difference between JEPI and SCHD for monthly dividend income?
The two ETFs serve the same broad goal — dividend income — but with fundamentally different structures, yields, and trade-offs. SCHD: approximately 3.3% yield; quarterly distributions; qualified dividend tax treatment; 0.06% expense ratio; distributions have grown for 14 consecutive years; upside is not capped; for $1K/month requires ~$364,000 (Motley Fool July 2026). JEPI: approximately 8.3% yield; monthly distributions; ordinary income tax treatment (NOT qualified dividends); 0.35% expense ratio; distributions declined at -8.76% CAGR over 3 years (dividend.watch June 2026); upside capped by covered call strategy; for $1K/month requires ~$144,600. Key insight: JEPI's tax disadvantage in taxable accounts narrows the effective after-tax yield gap. JEPI works best in a Roth IRA or 401(k) where ordinary income tax doesn't apply (247 Wall St June 27, 2026; HeyGoTrade 2026). Not financial advice.
What is JEPQ's monthly dividend yield?
JEPQ (JPMorgan Nasdaq Equity Premium Income ETF) has a trailing twelve-month dividend yield of approximately 10.27-11.23%, depending on the source and date. Wisesheets (September 2026) cites 11.23% TTM with a most recent distribution of $0.6825 per share (paid September 3, 2026). Dividend.watch (June 5, 2026) cites 10.27-10.39%. Monthly distributions in 2026 ranged from $0.47 (February 2026) to $0.59 (May 2026) (247 Wall St June 26, 2026). JEPQ pays monthly. Expense ratio: 0.35%. Like JEPI, JEPQ distributions are taxed as ordinary income — best held in a tax-advantaged account. 1-year total return (June 2026): 29.01%; 3-year: 20.93% — stronger than JEPI due to Nasdaq-100's tech-driven performance (dividend.watch June 2026). Not financial advice.
How does dividend reinvestment affect how long it takes to reach an income target?
Dividend reinvestment (DRIP) is the primary mechanism that accelerates the timeline to a target income level. When distributions are reinvested rather than taken as cash, they purchase additional shares. Those additional shares generate additional distributions, which purchase more shares — the compounding loop. The Motley Fool (October 2025) illustrated this with VYM: investing $500 per month at an assumed 11% annual total return (including reinvested dividends) over 30 years grows to approximately $686,000, which at VYM's 3% yield generates ~$20,580/year (~$1,715/month). Without reinvestment, the same $500/month compounded at 11% would produce a different (typically lower) terminal portfolio and lower income. During the accumulation phase, reinvesting all distributions is mathematically optimal if you don't need the income immediately. When income is needed, switch from DRIP to cash distributions. Not financial advice.
What is a blended dividend ETF portfolio and what yield can it achieve?
A blended dividend ETF portfolio combines multiple ETFs with different yield characteristics and distribution frequencies to achieve a target blended yield while reducing concentration risk. 247 Wall St (July 6, 2026) described a four-ETF blend (SCHD, VYM, DGRO, VIG) targeting $24,000 per year ($2,000/month) requiring roughly $600,000-$800,000 invested — implying a blended yield of approximately 3-4%. Pluang (June 2026) described a three-tier approach targeting 6% blended yield: conservative (SCHD type), moderate (covered call/REIT type), aggressive (JEPI/JEPQ type) — '$1 million targeting 6% blended yield produces about $5,000 monthly.' A practical example blended portfolio: 60% SCHD/VYM (qualified dividends, core income), 20% DGRO/VIG (growth), 20% JEPI in Roth IRA (monthly income, ordinary income shielded from tax). Blended yield approximately 4.5-5.0%. Required investment for $1K/month at 4.75% blended yield: approximately $253,000. Not financial advice.
0 Comments
Be the first to share your thoughts on this article.