

Retirement
How Rich Are UK Retirees? Wealth & Income

Key Statistics: Average total wealth for over-65s: £730,900 (mean); median pension wealth: £110,200; median savings: £25,700 (ClearScore/ONS 2026). DWP: median pensioner income £455/week (£23,700/year) after tax and housing costs; couples £650/week; singles £332/week. State pension 2026/27: £12,547.60/year (full new state pension). PLSA Minimum: £13,900/year single; Moderate: £32,700; Comfortable: £45,400. Pot needed for Moderate: £469,000; Comfortable: £764,000 (using 4% rule). 43% of working-age adults under-saving (DWP, 2025). 21% of those aged 55–64 have no private pension. Median property wealth for over-65s: £240,000. Auto-enrolment: 89% of eligible employees saving (21.7 million). DWP projects private pension income for those retiring in 2050 could be 8% lower in real terms than for those retiring in 2025.
Ask most people how rich UK retirees are, and they will likely say either very rich or struggling. Both answers are correct, depending entirely on which retirees you are talking about. The wealth distribution among people aged 65 and over in the UK is one of the most unequal of any demographic group, containing a relatively small proportion of genuinely wealthy retirees sitting alongside a large majority whose financial position is far more precarious than the headline averages suggest.
The average total wealth for a household where the head is aged 65 or over is £730,900, according to ONS Wealth and Assets Survey data compiled by ClearScore in December 2025. This is a large number, and it is accurate as a mean. It is also deeply misleading as a description of the typical retiree’s financial situation. The median pension wealth in the same age group is £110,200. The median financial savings is £25,700. The mean is pulled dramatically upward by a relatively small number of very wealthy retired households with large pension pots, significant property portfolios, and substantial investment assets. This article uses the data that describes the typical UK retiree, not the average one.
This guide draws on the most current available data from the Department for Work and Pensions (DWP), the Office for National Statistics (ONS), Pensions UK (formerly the PLSA), PocketWise, Investors Centre, and salarytax.uk, all updated through August 2026.
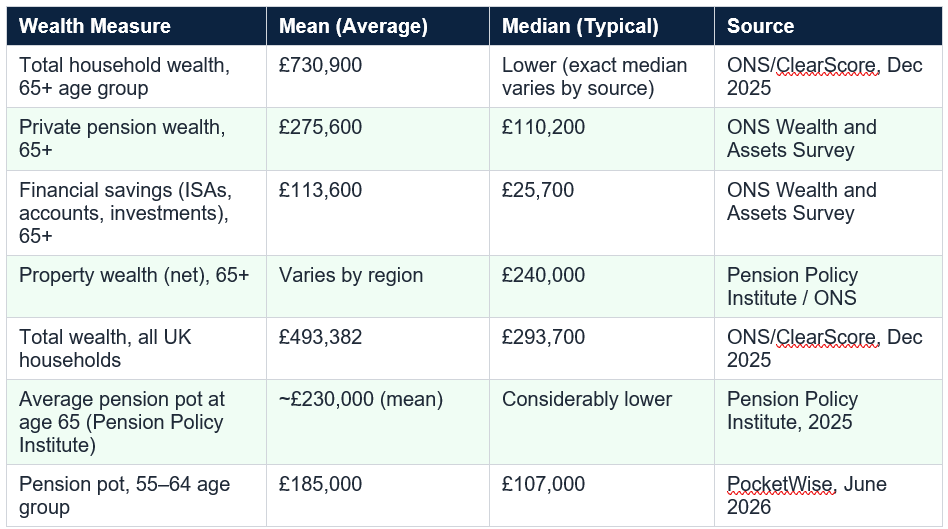
The difference between the mean and median figures is the single most important fact to understand about UK retirement wealth. The £730,900 average for over-65s includes the Cheshire hedge fund manager with a £5 million pension pot and the retired teacher in Sheffield with a £80,000 defined contribution pot. Both are in the same statistical group. The median strips out the distorting effect of extreme values and tells you what someone in the middle of the distribution actually has.
In the 55 to 64 age group, the mean pension pot is £185,000 but the median is only £107,000 — a gap of £78,000. PocketWise describes this as reflecting a highly unequal distribution: a substantial proportion of people in that bracket have pots of £20,000 to £50,000 or less, while a smaller group have saved £400,000 or more. Twenty-one percent of this age group have no private pension at all.
The implication for understanding UK retirement wealth: when a financial services company or news headline cites an average pension pot or average retirement wealth figure, verify whether it is the mean or the median. The mean flatters the picture considerably. The median describes where most people actually are.
PocketWise, June 2026: Wealth typically peaks around ages 55–70, then gradually decreases as pensions are drawn down and housing equity is accessed through downsizing or equity release. The jump from £50,000 at age 25–34 to £350,000 at age 45–54 reflects roughly 15–20 years of mortgage repayments, pension accumulation, and property price growth compounding quietly in the background.
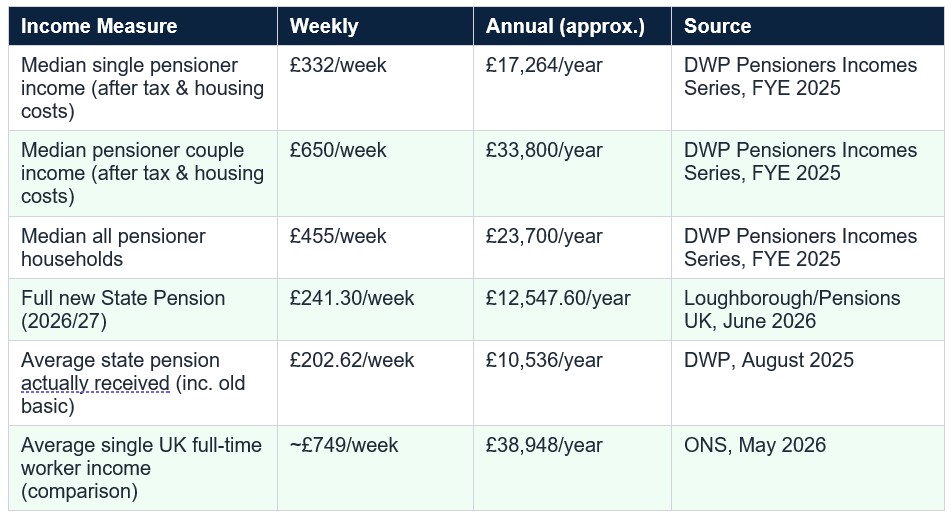
The DWP uses the median rather than the mean for pensioner income because a small number of very wealthy pensioners pull the mean upwards and misrepresent the typical retiree. The median is the honest number: half of pensioner households have more than £455 per week and half have less.
The single versus couple comparison is stark. Single pensioners have a median income of £332 per week (£17,264 per year) — roughly half that of pensioner couples at £650 per week. This reflects both the absence of a second income source and the higher per-person cost of running a single-person household. Single female pensioners typically have lower incomes than single male pensioners, reflecting historically lower lifetime earnings and more frequent career breaks for caring responsibilities.
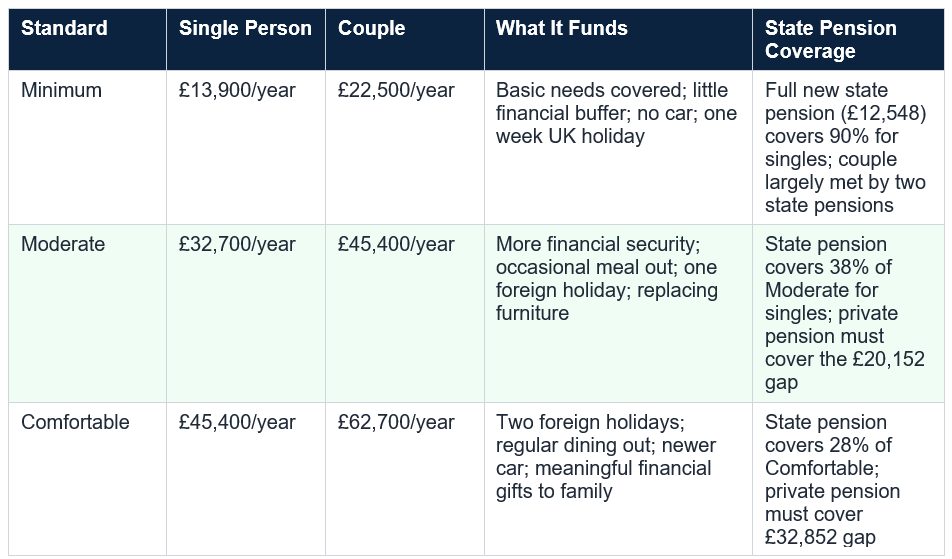
Pensions UK (PLSA), June 2026: The latest update to the Retirement Living Standards underlines a clear reality for many people: today’s saving levels will not be sufficient. There is a real gap between people’s lifestyle expectations and reality in retirement — even at a modest level.
The salarytax.uk analysis confirms this precisely: the typical single pensioner household is experiencing income that falls somewhere between Minimum and Moderate on the PLSA scale. The typical pensioner couple is around the Moderate level. Very few retirees reach the Comfortable standard from private pensions and state pension combined, without significant property downsizing or other wealth drawdown.
The DWP’s own modelling, published in the Analysis of Future Pension Incomes 2025, found that 43 percent of working-age individuals — approximately 14.6 million people — are currently undersaving against their Target Replacement Rate. This gap will widen the already significant difference between Minimum-to-Moderate typical retirees and the Comfortable minority.
To put these numbers in context against the PLSA targets:
Property wealth is, however, fundamentally illiquid. It is not available to spend without either selling the property or accessing equity through equity release or letting a room. The Pension Policy Institute notes that assuming a maximum equity release value of 40 percent, £240,000 of property wealth equates to a potential release of £96,000 — a meaningful sum but not one that transforms the retirement income picture.
Equity release has grown as a product category in the UK, allowing retirees to access property wealth without selling. However, it reduces the inheritance available to children and grandchildren, and the compound interest on equity release products can significantly erode the remaining equity over time. It is not a straightforward supplement to retirement income.
PocketWise notes that UK wealth peaks around ages 55 to 70, then gradually decreases as pensions are drawn down and housing equity is accessed through downsizing or equity release. This trajectory means that the apparent wealth of current retirees — impressive in aggregate — is partly the last expression of 40 years of property price appreciation that may not be available in the same form to future retirees.
The triple lock guarantee — the commitment to increase the state pension each year by the highest of earnings growth, price inflation (CPI), or 2.5 percent — has meant the state pension has risen meaningfully faster than many private sector wages in recent years. For the 2025/26 increase, the 4.1 percent rise was driven by the earnings growth element of the triple lock.
The state pension is the one component of retirement income that every qualifying retiree receives, regardless of their private savings or property wealth. It provides the floor against which all other retirement income is measured. For retirees with minimal private pensions and no property wealth, the state pension is often their primary or sole income source, placing them at or just above the Minimum standard of £13,900 per year.
The groups most likely to reach retirement with inadequate savings include:
The reason is structural: many current retirees benefited from defined benefit (DB) pension schemes — final salary arrangements that guaranteed a proportion of pre-retirement salary as a pension income regardless of investment performance. These schemes have been largely closed to new members across the private sector. Workers who entered the workforce from the 1990s and 2000s have predominantly been enrolled in defined contribution (DC) schemes, where the retirement income depends entirely on the size of the pot accumulated and investment returns.
Investors Centre’s August 2026 analysis confirms that auto-enrolment minimum contributions (currently 8 percent of qualifying earnings combined employer and employee) are likely to produce retirement incomes falling between the Minimum and Moderate PLSA income levels for most average earners. Reaching Moderate or Comfortable on auto-enrolment minimums alone is not realistic for most workers.
The honest picture for the typical UK retiree is: a median single pensioner income of £17,264 per year after tax and housing costs; pension wealth of around £110,200 (median); financial savings of £25,700 (median); and property wealth that varies enormously by region and ownership status. This combination places the typical single retiree between the Minimum (£13,900) and Moderate (£32,700) PLSA standards. The typical pensioner couple, at £33,800 per year, is at approximately Moderate.
The Comfortable standard (£45,400 single; £62,700 couple) — which most people would regard as a genuinely good retirement — requires a private pension pot of approximately £764,000 at retirement in addition to the full state pension. The typical retiree has roughly 30 percent of the pension pot needed to reach this level. Comfortable is the exception. And the future, with declining defined benefit coverage and auto-enrolment minimums that target Minimum to Moderate, may produce outcomes that are notably worse.
According to ONS Wealth and Assets Survey data compiled by ClearScore, households where the head is aged 65 or over have an average (mean) total wealth of £730,900, of which £113,600 is financial savings (ISAs, accounts, investments) and £275,600 is private pension wealth. However, the median pension wealth is £110,200 and the median savings is £25,700 — much lower figures that better represent the typical retiree, not the average distorted by very wealthy households.
What is the average UK pension pot at age 65?
The Pension Policy Institute's 2025 data puts the mean pension pot at age 65 at approximately £230,000. Medians are considerably lower. The mean is distorted by a smaller number of large pension pots. The PocketWise June 2026 analysis of the 55–64 age group (the last accumulation decade) shows a mean of £185,000 and a median of £107,000, with 21% of this age group having no private pension at all.
What is the average UK pensioner’s income in 2026?
The DWP Pensioners Incomes Series for the financial year ending 2025 reports a median pensioner income of £455 per week (approximately £23,700 per year) after direct taxes and housing costs. Pensioner couples have a median of £650 per week (£33,800/year) and single pensioners £332 per week (£17,264/year). These are median figures; the mean would be higher due to the distorting effect of very high incomes among the wealthiest pensioner households.
What is the UK state pension in 2026/27?
The full new State Pension for 2026/27 is £12,547.60 per year (£241.30 per week), increased from £11,973 in 2025/26 under the triple lock. The average amount actually received (including those on the older basic state pension, which is lower) is approximately £10,536 per year (£202.62 per week) per DWP August 2025 data.
What are the PLSA retirement living standards for 2026?
Pensions UK (formerly PLSA), using research by Loughborough University’s Centre for Research in Social Policy, defines three standards for 2026/27. For a single person: Minimum £13,900/year; Moderate £32,700/year; Comfortable £45,400/year. For couples: Minimum £22,500/year; Moderate £45,400/year; Comfortable £62,700/year. These figures include the state pension. The private pension pot needed to fund the gap to Moderate (above the state pension) using a 4% withdrawal rate is approximately £469,000; to Comfortable approximately £764,000.
How many UK pensioners are financially struggling?
The picture varies by how ‘struggling’ is defined. The DWP’s 2025 analysis found 43% of working-age adults are currently undersaving against their Target Replacement Rate. Among current retirees, the median single pensioner income (£17,264/year) exceeds the Minimum standard (£13,900) but is well below Moderate (£32,700). The 21% of 55–64 year-olds with no private pension are likely to retire on the state pension alone, placing single retirees at approximately £12,548/year — just below the Minimum standard.
Will future UK retirees be worse off than today’s?
Potentially, yes. The DWP’s Analysis of Future Pension Incomes 2025 projects that total incomes for individuals retiring in 2050 will be only 1% higher in real terms than for those retiring in 2025, and private pension income could be 8% lower. This is because many current retirees benefited from defined benefit (DB) final salary schemes, which have largely been closed to new entrants. Future retirees will rely more heavily on defined contribution (DC) schemes, where income depends on pot size and investment returns, and where auto-enrolment minimum contributions may not be sufficient for Moderate or Comfortable retirement.
How much property wealth do UK retirees have?
The median property wealth for households where the head is aged 65 or over is approximately £240,000, according to Pension Policy Institute data. UK aggregate housing wealth almost matches pension wealth: £5.09 trillion versus £6.098 trillion. Property is, however, largely illiquid unless sold or accessed through equity release. Assuming a maximum equity release value of 40%, £240,000 of property wealth equates to a potential release of £96,000 — meaningful, but not transformative for long-term retirement income.
Table of Contents
- The UK Retirement Wealth Paradox
- The Headline Numbers: What UK Retirees Actually Own
- The Mean vs. Median Problem — Why Average Figures Mislead
- The Four Components of UK Retiree Wealth
- What UK Retirees Actually Live On: Income Data
- The PLSA Retirement Living Standards: Three Benchmarks
- What Each Standard Means in Practice
- How Many UK Retirees Meet Each Standard?
- The Pension Pot Reality: Are Most Retirees on Track?
- The Property Dimension: Housing Wealth in Retirement
- The State Pension: The Universal Floor
- Who Gets Left Behind: The Retirement Wealth Gap
- What the Future Holds: Declining Private Pensions
- Conclusion: Comfortable Is the Exception, Not the Rule
- Frequently Asked Questions
The UK Retirement Wealth Paradox
Ask most people how rich UK retirees are, and they will likely say either very rich or struggling. Both answers are correct, depending entirely on which retirees you are talking about. The wealth distribution among people aged 65 and over in the UK is one of the most unequal of any demographic group, containing a relatively small proportion of genuinely wealthy retirees sitting alongside a large majority whose financial position is far more precarious than the headline averages suggest.The average total wealth for a household where the head is aged 65 or over is £730,900, according to ONS Wealth and Assets Survey data compiled by ClearScore in December 2025. This is a large number, and it is accurate as a mean. It is also deeply misleading as a description of the typical retiree’s financial situation. The median pension wealth in the same age group is £110,200. The median financial savings is £25,700. The mean is pulled dramatically upward by a relatively small number of very wealthy retired households with large pension pots, significant property portfolios, and substantial investment assets. This article uses the data that describes the typical UK retiree, not the average one.
This guide draws on the most current available data from the Department for Work and Pensions (DWP), the Office for National Statistics (ONS), Pensions UK (formerly the PLSA), PocketWise, Investors Centre, and salarytax.uk, all updated through August 2026.
The Headline Numbers: What UK Retirees Actually Own
The difference between the mean and median figures is the single most important fact to understand about UK retirement wealth. The £730,900 average for over-65s includes the Cheshire hedge fund manager with a £5 million pension pot and the retired teacher in Sheffield with a £80,000 defined contribution pot. Both are in the same statistical group. The median strips out the distorting effect of extreme values and tells you what someone in the middle of the distribution actually has.
The Mean vs. Median Problem — Why Average Figures Mislead
PocketWise’s June 2026 wealth percentile analysis explains the distortion with precision: the figures at the top end are largely driven by retirees who have had 40 years of property appreciation and pension compounding, not primarily by high earners in their 30s and 40s. A relatively small group of retirees with exceptional wealth creates averages that most people will never approach.In the 55 to 64 age group, the mean pension pot is £185,000 but the median is only £107,000 — a gap of £78,000. PocketWise describes this as reflecting a highly unequal distribution: a substantial proportion of people in that bracket have pots of £20,000 to £50,000 or less, while a smaller group have saved £400,000 or more. Twenty-one percent of this age group have no private pension at all.
The implication for understanding UK retirement wealth: when a financial services company or news headline cites an average pension pot or average retirement wealth figure, verify whether it is the mean or the median. The mean flatters the picture considerably. The median describes where most people actually are.
PocketWise, June 2026: Wealth typically peaks around ages 55–70, then gradually decreases as pensions are drawn down and housing equity is accessed through downsizing or equity release. The jump from £50,000 at age 25–34 to £350,000 at age 45–54 reflects roughly 15–20 years of mortgage repayments, pension accumulation, and property price growth compounding quietly in the background.
The Four Components of UK Retiree Wealth
UK retirement wealth has four distinct components. Understanding each one is necessary to understand the full picture:Private Pension Wealth
The value of pension pots accumulated during working life — defined benefit (DB) schemes, defined contribution (DC) schemes, personal pensions, and SIPPs. This is the largest financial asset for most retirees who have worked in organised employment. The median for over-65s is £110,200, but this includes those already drawing down, which depresses the in-retirement figure compared to the at-retirement figure.Property Wealth
The net value of property owned, primarily the main residence. For many UK retirees, particularly those who bought property before the major price rises of the 2000s, this is the largest single component of total wealth. The median property wealth for over-65s is approximately £240,000. This wealth is largely illiquid unless the retiree downsizes, uses equity release, or rents a room. Aggregate UK housing wealth almost matches aggregate pension wealth: Pension Policy Institute data shows UK housing wealth at £5.09 trillion versus pension wealth of £6.098 trillion.Financial Savings
Cash in savings and current accounts, ISAs, bonds, shares, and other liquid financial assets outside of pensions. The median for over-65s is £25,700 — a relatively modest figure that reinforces how important pension income is as the main source of spending power in retirement.Physical Wealth
Household contents, vehicles, and other physical possessions. This component is typically the smallest and least significant for retirement income planning.What UK Retirees Actually Live On: Income Data
Wealth and income are different things. A retiree with £300,000 in total wealth may have a very modest income if most of that wealth is tied up in property. The definitive source for UK pensioner income is the DWP’s Pensioners Incomes Series, the most recent edition of which covers the financial year ending 2025.The DWP uses the median rather than the mean for pensioner income because a small number of very wealthy pensioners pull the mean upwards and misrepresent the typical retiree. The median is the honest number: half of pensioner households have more than £455 per week and half have less.
The single versus couple comparison is stark. Single pensioners have a median income of £332 per week (£17,264 per year) — roughly half that of pensioner couples at £650 per week. This reflects both the absence of a second income source and the higher per-person cost of running a single-person household. Single female pensioners typically have lower incomes than single male pensioners, reflecting historically lower lifetime earnings and more frequent career breaks for caring responsibilities.
The PLSA Retirement Living Standards: Three Benchmarks
The most authoritative framework for assessing retirement income adequacy in the UK is the Pensions UK (formerly PLSA) Retirement Living Standards, calculated by the Centre for Research in Social Policy at Loughborough University. The 2026 update, published in June 2026, defines three annual income targets based on research into what retirees actually need to spend at each lifestyle level.Pensions UK (PLSA), June 2026: The latest update to the Retirement Living Standards underlines a clear reality for many people: today’s saving levels will not be sufficient. There is a real gap between people’s lifestyle expectations and reality in retirement — even at a modest level.
What Each Standard Means in Practice
Minimum (£13,900 single / £22,500 couple)
At the Minimum standard, a single retiree can cover all essential needs — food, utilities, basic household costs, and healthcare — but has very limited flexibility for unexpected expenses or lifestyle choices beyond the basics. No car is typically included in the Minimum budget. Holidays are limited to one week in the UK per year. The 2020 Financial analysis notes that the full state pension of £12,547.60 in 2026/27 covers approximately 90 percent of the Minimum standard for a single person, meaning only £1,352 of additional private pension income is required to reach Minimum for a single retiree who receives the full state pension. For couples, Pensions UK notes that two full state pensions can largely meet the Minimum standard.Moderate (£32,700 single / £45,400 couple)
At the Moderate standard, a single retiree has meaningfully more financial security and flexibility. One foreign holiday per year is included, along with the ability to occasionally eat out, replace household items when needed, and maintain a slightly higher standard of everyday spending. The gap between the full state pension (£12,548) and the Moderate income target (£32,700) is £20,152 per year. To generate this from a pension pot using the 4 percent sustainable withdrawal rate, a retiree needs a private pension of approximately £469,000 at retirement, in addition to the state pension.Comfortable (£45,400 single / £62,700 couple)
The Comfortable standard represents what most people would describe as a genuinely good retirement — two foreign holidays per year, regular dining out, a newer car, the ability to make meaningful financial gifts to family, and no financial anxiety about routine spending. The Comfortable Standard for a single person requires a private pension of approximately £764,000 at retirement, in addition to the full state pension, to be funded sustainably. For high earners who spent their careers on £100,000 or more, 2020 Financial notes that even the Comfortable Standard may not replicate their pre-retirement lifestyle: realistic costs for this group are typically £50,000 to £80,000 net per year for a single person.How Many UK Retirees Meet Each Standard?
The honest answer, based on the DWP’s Pensioners Incomes data and the comparison to PLSA benchmarks, is that most current retirees fall somewhere between Minimum and Moderate. The median single pensioner income of £17,264 per year (after tax and housing costs) is above the Minimum standard of £13,900 but well below the Moderate standard of £32,700. The median pensioner couple income of £33,800 per year is approximately at the Moderate standard.The salarytax.uk analysis confirms this precisely: the typical single pensioner household is experiencing income that falls somewhere between Minimum and Moderate on the PLSA scale. The typical pensioner couple is around the Moderate level. Very few retirees reach the Comfortable standard from private pensions and state pension combined, without significant property downsizing or other wealth drawdown.
The DWP’s own modelling, published in the Analysis of Future Pension Incomes 2025, found that 43 percent of working-age individuals — approximately 14.6 million people — are currently undersaving against their Target Replacement Rate. This gap will widen the already significant difference between Minimum-to-Moderate typical retirees and the Comfortable minority.
The Pension Pot Reality: Are Most Retirees on Track?
The Pension Policy Institute’s 2025 data provides average pension pots by age: £30,000 at age 35, £85,000 at age 45, £178,000 at age 55, and £230,000 at age 65. These are mean figures. Medians are considerably lower at each age bracket.To put these numbers in context against the PLSA targets:
- A £230,000 pension pot at 65, using the 4% sustainable withdrawal rule, generates approximately £9,200 per year in private pension income.
- Adding the full state pension (£12,548) gives a total of £21,748 per year for a single retiree.
- This exceeds the Minimum standard (£13,900) but is £10,952 below the Moderate standard (£32,700).
- It is £23,652 below the Comfortable standard (£45,400).
The Property Dimension: Housing Wealth in Retirement
For many UK retirees, the most significant financial asset is not the pension pot. It is the house. The median property wealth for over-65s is £240,000. For those who purchased property in major cities before the 2000s, this figure can be £500,000 or more in areas like London, the South East, and other high-demand regions.Property wealth is, however, fundamentally illiquid. It is not available to spend without either selling the property or accessing equity through equity release or letting a room. The Pension Policy Institute notes that assuming a maximum equity release value of 40 percent, £240,000 of property wealth equates to a potential release of £96,000 — a meaningful sum but not one that transforms the retirement income picture.
Equity release has grown as a product category in the UK, allowing retirees to access property wealth without selling. However, it reduces the inheritance available to children and grandchildren, and the compound interest on equity release products can significantly erode the remaining equity over time. It is not a straightforward supplement to retirement income.
PocketWise notes that UK wealth peaks around ages 55 to 70, then gradually decreases as pensions are drawn down and housing equity is accessed through downsizing or equity release. This trajectory means that the apparent wealth of current retirees — impressive in aggregate — is partly the last expression of 40 years of property price appreciation that may not be available in the same form to future retirees.
The State Pension: The Universal Floor
The full new State Pension for 2026/27 is £12,547.60 per year (£241.30 per week), an increase from £11,973 in 2025/26 under the triple lock guarantee. The average amount actually received, including those on the older basic state pension, is approximately £10,536 per year (£202.62 per week), according to DWP August 2025 data.The triple lock guarantee — the commitment to increase the state pension each year by the highest of earnings growth, price inflation (CPI), or 2.5 percent — has meant the state pension has risen meaningfully faster than many private sector wages in recent years. For the 2025/26 increase, the 4.1 percent rise was driven by the earnings growth element of the triple lock.
The state pension is the one component of retirement income that every qualifying retiree receives, regardless of their private savings or property wealth. It provides the floor against which all other retirement income is measured. For retirees with minimal private pensions and no property wealth, the state pension is often their primary or sole income source, placing them at or just above the Minimum standard of £13,900 per year.
Who Gets Left Behind: The Retirement Wealth Gap
The UK’s retirement wealth picture has a sharp and widening inequality dimension. PocketWise’s June 2026 analysis identifies that if your total net worth (including pension and housing equity) is £200,000, you are comfortably above the 40th percentile nationally. Equivalently, 60 percent of UK households have total wealth below £200,000.The groups most likely to reach retirement with inadequate savings include:
- women who took career breaks for caring responsibilities: Unbiased notes that single female pensioners typically have lower incomes than single male pensioners, reflecting historically lower lifetime earnings and more frequent career interruptions.
- The self-employed: auto-enrolment into workplace pensions does not apply to the self-employed. Many have no private pension at all and rely entirely on the state pension and any savings they have accumulated independently.
- Low earners and part-time workers: auto-enrolment applies only to workers earning above £10,000 per year. Those below this threshold are not automatically enrolled, though they can opt in.
- Those in regions outside London and the South East: property wealth is heavily concentrated in southern England. Retirees in the North East, Wales, and other lower-property-value regions may have similar pension savings but far less property wealth to supplement income.
- The 21 percent without private pensions aged 55 to 64: this group, documented by PocketWise’s June 2026 analysis, is entirely reliant on the state pension and any savings or assets they hold. For most, this will not support even the Minimum standard without means-tested benefits.
What the Future Holds: Declining Private Pensions
One of the most sobering findings in current retirement research is that future retirees may be worse off in real terms than current ones. The DWP’s Analysis of Future Pension Incomes 2025 projects that incomes for individuals retiring in 2050 will be only 1 percent higher in real terms than for those retiring in 2025, and private pension income could actually be 8 percent lower.The reason is structural: many current retirees benefited from defined benefit (DB) pension schemes — final salary arrangements that guaranteed a proportion of pre-retirement salary as a pension income regardless of investment performance. These schemes have been largely closed to new members across the private sector. Workers who entered the workforce from the 1990s and 2000s have predominantly been enrolled in defined contribution (DC) schemes, where the retirement income depends entirely on the size of the pot accumulated and investment returns.
Investors Centre’s August 2026 analysis confirms that auto-enrolment minimum contributions (currently 8 percent of qualifying earnings combined employer and employee) are likely to produce retirement incomes falling between the Minimum and Moderate PLSA income levels for most average earners. Reaching Moderate or Comfortable on auto-enrolment minimums alone is not realistic for most workers.
Conclusion
The headline answer to how rich UK retirees are is: it depends entirely on which retirees you are looking at, and whether you use mean or median figures. The average total wealth of £730,900 for over-65s describes a group that includes some very wealthy retired households and a far larger number of typical retirees living on much less.The honest picture for the typical UK retiree is: a median single pensioner income of £17,264 per year after tax and housing costs; pension wealth of around £110,200 (median); financial savings of £25,700 (median); and property wealth that varies enormously by region and ownership status. This combination places the typical single retiree between the Minimum (£13,900) and Moderate (£32,700) PLSA standards. The typical pensioner couple, at £33,800 per year, is at approximately Moderate.
The Comfortable standard (£45,400 single; £62,700 couple) — which most people would regard as a genuinely good retirement — requires a private pension pot of approximately £764,000 at retirement in addition to the full state pension. The typical retiree has roughly 30 percent of the pension pot needed to reach this level. Comfortable is the exception. And the future, with declining defined benefit coverage and auto-enrolment minimums that target Minimum to Moderate, may produce outcomes that are notably worse.
Frequently Asked Questions
How much does the average UK retiree have saved?According to ONS Wealth and Assets Survey data compiled by ClearScore, households where the head is aged 65 or over have an average (mean) total wealth of £730,900, of which £113,600 is financial savings (ISAs, accounts, investments) and £275,600 is private pension wealth. However, the median pension wealth is £110,200 and the median savings is £25,700 — much lower figures that better represent the typical retiree, not the average distorted by very wealthy households.
What is the average UK pension pot at age 65?
The Pension Policy Institute's 2025 data puts the mean pension pot at age 65 at approximately £230,000. Medians are considerably lower. The mean is distorted by a smaller number of large pension pots. The PocketWise June 2026 analysis of the 55–64 age group (the last accumulation decade) shows a mean of £185,000 and a median of £107,000, with 21% of this age group having no private pension at all.
What is the average UK pensioner’s income in 2026?
The DWP Pensioners Incomes Series for the financial year ending 2025 reports a median pensioner income of £455 per week (approximately £23,700 per year) after direct taxes and housing costs. Pensioner couples have a median of £650 per week (£33,800/year) and single pensioners £332 per week (£17,264/year). These are median figures; the mean would be higher due to the distorting effect of very high incomes among the wealthiest pensioner households.
What is the UK state pension in 2026/27?
The full new State Pension for 2026/27 is £12,547.60 per year (£241.30 per week), increased from £11,973 in 2025/26 under the triple lock. The average amount actually received (including those on the older basic state pension, which is lower) is approximately £10,536 per year (£202.62 per week) per DWP August 2025 data.
What are the PLSA retirement living standards for 2026?
Pensions UK (formerly PLSA), using research by Loughborough University’s Centre for Research in Social Policy, defines three standards for 2026/27. For a single person: Minimum £13,900/year; Moderate £32,700/year; Comfortable £45,400/year. For couples: Minimum £22,500/year; Moderate £45,400/year; Comfortable £62,700/year. These figures include the state pension. The private pension pot needed to fund the gap to Moderate (above the state pension) using a 4% withdrawal rate is approximately £469,000; to Comfortable approximately £764,000.
How many UK pensioners are financially struggling?
The picture varies by how ‘struggling’ is defined. The DWP’s 2025 analysis found 43% of working-age adults are currently undersaving against their Target Replacement Rate. Among current retirees, the median single pensioner income (£17,264/year) exceeds the Minimum standard (£13,900) but is well below Moderate (£32,700). The 21% of 55–64 year-olds with no private pension are likely to retire on the state pension alone, placing single retirees at approximately £12,548/year — just below the Minimum standard.
Will future UK retirees be worse off than today’s?
Potentially, yes. The DWP’s Analysis of Future Pension Incomes 2025 projects that total incomes for individuals retiring in 2050 will be only 1% higher in real terms than for those retiring in 2025, and private pension income could be 8% lower. This is because many current retirees benefited from defined benefit (DB) final salary schemes, which have largely been closed to new entrants. Future retirees will rely more heavily on defined contribution (DC) schemes, where income depends on pot size and investment returns, and where auto-enrolment minimum contributions may not be sufficient for Moderate or Comfortable retirement.
How much property wealth do UK retirees have?
The median property wealth for households where the head is aged 65 or over is approximately £240,000, according to Pension Policy Institute data. UK aggregate housing wealth almost matches pension wealth: £5.09 trillion versus £6.098 trillion. Property is, however, largely illiquid unless sold or accessed through equity release. Assuming a maximum equity release value of 40%, £240,000 of property wealth equates to a potential release of £96,000 — meaningful, but not transformative for long-term retirement income.
0 Comments
Be the first to share your thoughts on this article.