

Financial Literacy
How to Measure Your Financial Wellness: Complete Guide

The complete 2026 guide to the six metrics, official tools, and practical assessments that tell you exactly where you stand — and what to improve first

Financial wellness measurement is the practice of assessing your financial health across a defined set of indicators, assigning a baseline, and tracking changes over time. It is what separates ‘I think I’m doing okay financially’ from ‘I know my savings rate is 12 percent, my DTI ratio is 28 percent, my emergency fund covers 2.4 months of expenses, and my net worth grew 8 percent last year.’ One of these statements is a feeling. The other is a foundation for improvement.
This guide presents the six key metrics for measuring financial wellness, the official validated tools developed by the Consumer Financial Protection Bureau (CFPB) and the Financial Health Network, and a practical scorecard for assessing your current position. The goal is not a perfect score. The goal is a clear, honest baseline from which the right next step becomes visible.
The Numbers: 31% of US households are financially healthy (Financial Health Pulse 2025). 37% find money management too overwhelming to know where to begin (Intuit January 2026). 68% of workers are very or somewhat financially stressed (PNC 2025). Only 29% feel hopeful about their financial future (down from 60% one year earlier).
The CFPB’s formal definition, which underpins their validated Financial Well-Being Scale, captures this dual nature: financial well-being is the state in which a person can fully meet current and upcoming financial obligations, feels secure in their financial future, and is able to make choices that allow them to enjoy life. The measurement framework that follows addresses both dimensions.
CFPB Financial Well-Being Definition: Financial well-being is a state of being in which a person can fully meet current and upcoming financial obligations, feels secure in their financial future, and is able to make choices that allow them to enjoy life.
CFPB score interpretation:
The OECD/INFE Toolkit for Measuring Financial Literacy, Inclusion and Well-Being 2026 (published January 2026) provides an internationally comparable framework covering financial knowledge, behaviour, attitudes, financial resilience, and financial well-being — useful for understanding how your financial position compares to international benchmarks.
How to calculate: divide your total monthly savings and investment contributions by your total monthly take-home income. Example: $600 saved from $4,000 take-home = a 15 percent savings rate.
Benchmark: Savings rate benchmarks — Below 5%: critically low — limited financial resilience; 5–10%: functional but below recommended minimums; 10–15%: approaching target range; 15–20%: healthy; above 20%: strong financial progress
The standard financial guidance — cited by NerdWallet, the CFPB, and most financial planning authorities — is to save 20 percent of take-home pay (the ‘20’ in the 50/30/20 rule). The US personal savings rate was 3.6 percent as of March 2026 (Federal Reserve FRED), illustrating the gap between the benchmark and the typical American household’s current position. If 20 percent feels distant, starting with 5 percent and increasing by 1 to 2 percentage points with each income rise is the evidence-based incremental approach.
How to Measure It: Calculate your savings rate once per month for three months before evaluating it. One month can be distorted by irregular expenses. Three months gives a reliable baseline. If your savings rate is near zero, the priority is identifying one category of spending that can be reduced to fund an automatic savings transfer of even $25 to $50 per payday. Automation is the mechanism that makes the number rise and stay risen.
How to calculate: total your monthly essential expenses (rent/mortgage, utilities, groceries, minimum debt payments, insurance, childcare if applicable). Divide your liquid savings balance (cash, current account, instant-access savings — exclude investments you cannot access immediately) by this monthly total.
Example: $8,500 in liquid savings / $2,800 monthly essential expenses = 3.04 months of coverage.
Benchmark: Emergency fund benchmarks — Under 1 month: critical vulnerability; 1–2 months: limited buffer; 3 months: minimum recommended; 6 months: recommended for single-income households or variable income; above 6 months: conservative but appropriate for high financial anxiety or job insecurity
Investopedia’s 2025 analysis calculated that six months of emergency expenses for a typical US household totals $35,218. The U.S. News 2026 Financial Wellness Survey found that the median emergency fund balance fell from $10,000 to $5,000 in a single year, and more than 40 percent of respondents have no emergency fund at all. The emergency fund is the metric that most directly determines financial resilience — the FinHealth Score’s ‘Save’ pillar places it as the primary short-term savings indicator.
How to Measure It: Calculate your ratio using your actual monthly essential expenses, not your total spending. The emergency fund covers the expenses you could not pause in a crisis — rent, food, utilities, insurance, minimum debt payments. It does not need to cover dining out, subscriptions, or lifestyle spending. This calculation typically produces a smaller denominator and a more accurate resilience number than total monthly expenditure would.
How to calculate: add all monthly debt payments (mortgage or rent, car loan, student loans, credit card minimum payments, personal loans, any other debt obligation). Divide by your gross monthly income (before tax). Multiply by 100 for the percentage.
Example: $1,200 in monthly debt payments / $5,000 gross monthly income = 24 percent DTI.
The Gild Group’s July 2025 personal finance metrics guide identifies DTI as one of the most actionable metrics because it can be reduced by two routes: increasing income or reducing debt balances (which reduces minimum payments). The FinHealth Score’s ‘Borrow’ pillar uses DTI alongside credit score as the primary debt health indicators. Note that the DTI calculation for personal financial assessment uses gross income; some financial planning frameworks use net income, which typically produces a higher percentage.
How to Measure It: Calculate your DTI on both a gross and net income basis so you have both figures. Lenders use gross; your personal financial reality is better captured by net. If your gross DTI is below 36% but your net DTI is above 50%, you are carrying significant debt relative to your actual take-home income, which affects your real monthly cash flow more acutely than the lender’s metric would suggest.
Credit score ranges (Experian 2026):
The five factors that determine your FICO credit score:
How to calculate: list all assets (checking and savings balances, investment accounts, retirement accounts, estimated value of real estate if owned, market value of vehicles, other significant assets). List all liabilities (mortgage balance outstanding, car loan balance, student loan balance, credit card balances, personal loans, any other debts). Subtract total liabilities from total assets.
Net worth can be negative, particularly for younger adults with student loans and no accumulated assets. A negative net worth is not a failure. It is a starting point. The metric that matters for financial wellness measurement is not the absolute number but the trajectory: is your net worth increasing over time?
Benchmark: Net worth benchmarks — Negative to zero: normal for young adults with student debt; positive trajectory is the goal; growing by at least the rate of inflation annually indicates progress; Federal Reserve Survey of Consumer Finances (2022): median US household net worth approximately $192,700 (this varies enormously by age group)
The Gild Group’s personal finance metrics guide notes that while net worth might fluctuate due to big-ticket purchases or market changes, it should ideally trend upward over time. For most working-age households, net worth is most usefully tracked annually rather than more frequently, because short-term fluctuations in investment accounts can obscure the genuine underlying trajectory.
How to Measure It: Track net worth annually on the same date each year — the same week in January or April. Use a simple spreadsheet: date, total assets, total liabilities, net worth, year-on-year change. The year-on-year change percentage is more informative than the absolute number, and seeing it improve over multiple years is one of the most powerful motivators in personal finance.
The Financial Planning Association’s November 2025 analysis distinguishes between financial health (objective) and financial well-being (subjective) as the two necessary components of financial wellness. A household with technically healthy metrics but constant financial anxiety is not experiencing financial wellness. The subjective dimension is measured by asking:
People with strong financial literacy are 9 percent less likely to feel stressed or anxious, according to global financial wellness research cited by David Lerner Associates — confirming that the objective and subjective dimensions are related, but not identical. Improving the quantitative metrics reduces stress; addressing the subjective dimension through financial education, professional guidance, and deliberate planning builds confidence independently of the numbers.
Benchmark: Financial stress benchmark — Four or more hours per week of financial worry (PNC 2025 workplace benchmark) indicates significant financial stress requiring active intervention; zero to one hour per week indicates strong subjective financial wellness; the CFPB score of 62+ captures this as ‘high financial well-being’
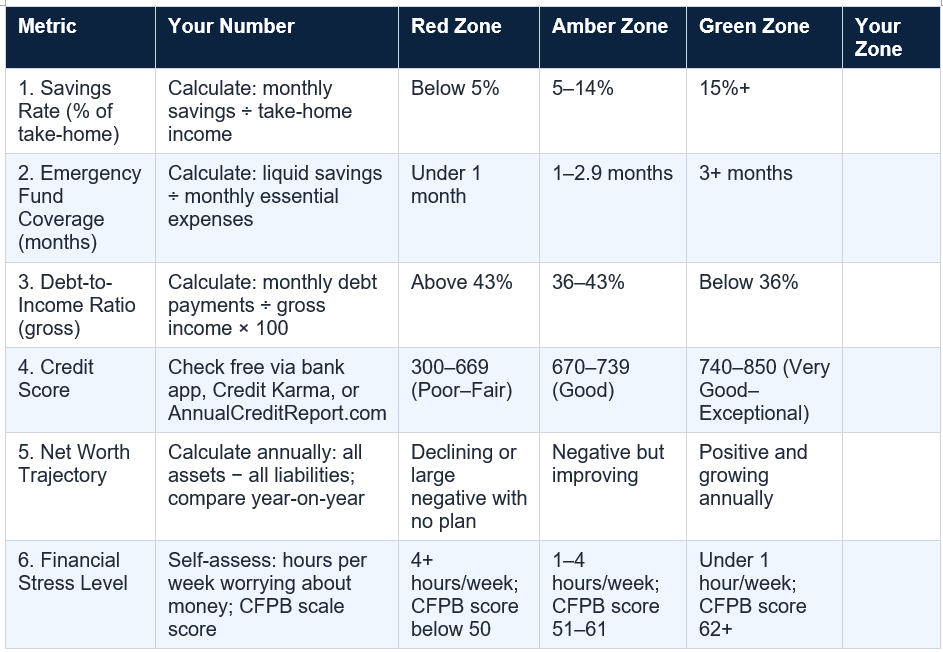
Fill in your numbers for each metric. Count your Red, Amber, and Green zones. If you have two or more Red zones, those are your highest-priority areas. If all metrics are in the Amber or Green zone, focus on the one closest to the Red boundary. The metric that is weakest relative to its benchmark is your financial wellness entry point.
A practical quarterly measurement system:
How to Measure It: Use the free CFPB Financial Well-Being Scale at consumerfinance.gov as your annual subjective benchmark. It takes under five minutes, produces a validated score on the 0–100 scale, and provides a comparable self-assessment across years. Pair it with your annual net worth calculation and savings rate review for a comprehensive annual financial wellness health check.
Financial wellness measurement begins with six metrics: savings rate, emergency fund coverage ratio, debt-to-income ratio, credit score, net worth trajectory, and financial stress level. These six numbers, together with the CFPB’s validated Financial Well-Being Scale and the Financial Health Network’s updated FinHealth Score framework, give any household the tools to answer the question ‘How am I actually doing financially?’ with something more useful than a feeling.
The answer, once you have it, is the starting line. Not the finish. The finish is the direction that the answer reveals. Measurement is useful only when it changes decisions — and the first decision it should change is the decision to measure again, in three months, to find out whether the actions taken produced the movement intended. That discipline, applied consistently, is what converts financial anxiety into financial confidence.
The Consumer Financial Protection Bureau's Financial Well-Being Scale is a free, validated 10-question instrument that measures your financial well-being as a score between 0 and 100. It assesses your sense of financial security (the ability to handle unexpected expenses, not falling behind on finances) and financial freedom of choice (being able to enjoy life without constant money worry). Scores of 62 and above indicate high financial well-being; 51–61 indicates moderate; below 50 indicates low well-being. The tool is available free at consumerfinance.gov. Take it annually and track your score over time to measure the subjective dimension of your financial wellness alongside the quantitative metrics.
What is the FinHealth Score and what is a good score?
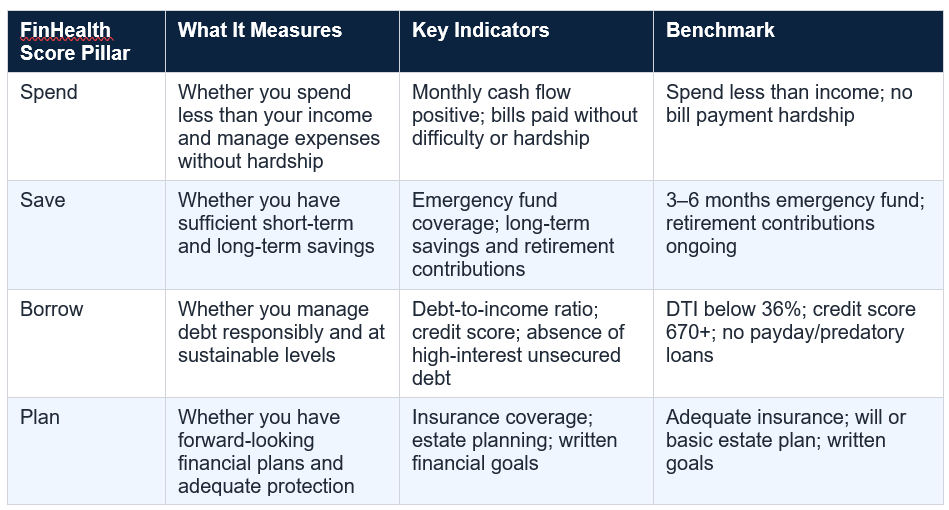
The FinHealth Score is a 0–100 measure of financial health developed by the Financial Health Network, updated in early 2026. It measures four pillars: Spend (living within your means), Save (short-term and long-term savings adequacy), Borrow (responsible debt management), and Plan (forward-looking financial planning and protection). Each pillar is scored using two survey questions. A score of 80 or above classifies a household as financially healthy. Below 80 indicates room for improvement, with lower scores indicating more acute financial health challenges. Only 31% of US households scored in the financially healthy range in spring 2025. The FinHealth Score Toolkit is available free for personal use at finhealthnetwork.org.
What is a good debt-to-income ratio?
According to CFPB guidance and mainstream mortgage lending standards, a DTI ratio below 36% is considered healthy, with the capacity to manage debt while maintaining financial flexibility. A ratio between 36% and 43% is considered concerning, and most mortgage lenders will not approve a home loan for applicants with a DTI above 43% (some will go to 50% under specific circumstances). Above 50% indicates that debt is consuming the majority of gross income, creating significant financial stress and limited capacity to save or invest. Your DTI is calculated by dividing total monthly debt payments by gross monthly income and multiplying by 100.
How much should I have in an emergency fund?
The standard recommended emergency fund is three to six months of essential living expenses. Investopedia's 2025 analysis calculated that six months of emergency expenses for a typical US household equals $35,218. Three months is the generally recommended minimum for dual-income households or those with stable employment; six months is recommended for single-income households, variable-income earners, those in industries with higher job volatility, or those with significant financial anxiety. A $1,000 initial milestone is the commonly cited first target for those building from zero. The U.S. News 2026 Financial Wellness Survey found the median emergency fund balance fell from $10,000 to $5,000 in a single year, reflecting how frequently these funds are being used and not rebuilt.
How often should I measure my financial wellness?
Most financial planning authorities recommend: (1) Monthly: calculate your savings rate and review your cash flow against your budget. (2) Quarterly: calculate your emergency fund coverage ratio and DTI ratio; review credit score via free monitoring. (3) Annually: calculate net worth (assets minus liabilities); take the CFPB Financial Well-Being Scale; review insurance coverage and estate planning status. The Financial Health Network's Benely guide recommends tracking both leading indicators (behaviour changes like increased saving or reduced impulse spending) and lagging indicators (actual metric improvements) because behaviours change before numbers do.
Can I have a good credit score but still be financially unwell?
Yes. A credit score measures creditworthiness, not overall financial wellness. A person can have a 750 credit score (they pay bills on time and manage available credit well) while simultaneously having a zero emergency fund, a high DTI ratio, a low savings rate, and high financial stress. Credit score is one of six key financial wellness metrics. It is an important indicator but not a comprehensive measure. Similarly, a person can have a lower credit score due to limited credit history rather than poor financial management, while having excellent savings habits and low stress. The full six-metric assessment provides a more accurate picture than any single metric, and the CFPB Financial Well-Being Scale captures the subjective dimension that no objective metric addresses.
Table of Contents
- You Cannot Improve What You Cannot Measure
- What Financial Wellness Actually Measures (and What It Does Not)
- The Official Tools: CFPB Scale and the FinHealth Score
- Metric 1: Your Savings Rate
- Metric 2: Your Emergency Fund Coverage Ratio
- Metric 3: Your Debt-to-Income (DTI) Ratio
- Metric 4: Your Credit Score
- Metric 5: Your Net Worth Trajectory
- Metric 6: Your Financial Stress Level (The Subjective Dimension)
- The Financial Wellness Scorecard: Where Do You Stand?
- How the Metrics Connect: Reading Your Complete Picture
- Setting Your Baseline and Tracking Progress
- Conclusion: Measurement Is the Starting Line, Not the Finish
- Frequently Asked Questions
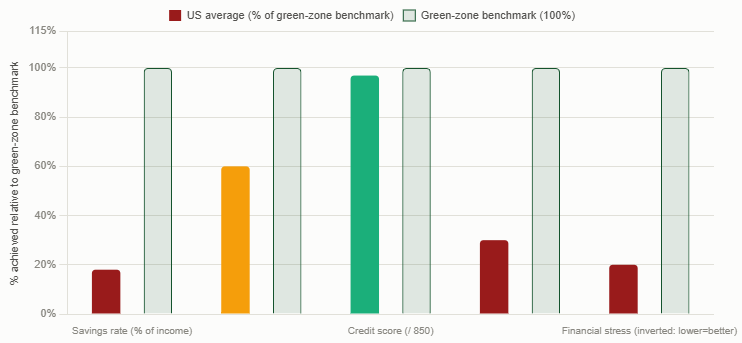
US Average vs Benchmark
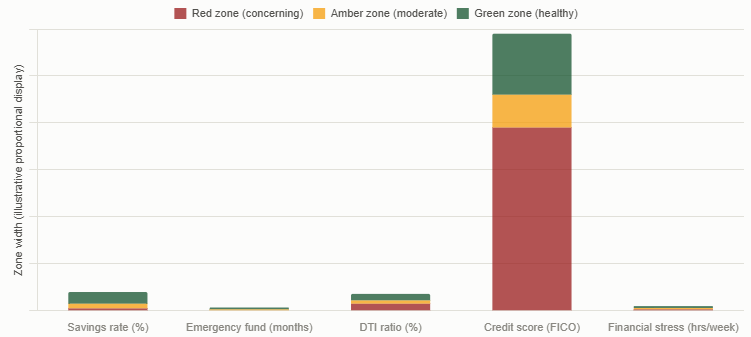
Red / Amber / Greenzone
You Cannot Improve What You Cannot Measure
Only 31 percent of US households were considered financially healthy in spring 2025, according to the Financial Health Network’s Financial Health Pulse 2025 US Trends Report. Most of the remaining 69 percent believe they are in worse shape than they actually are, or better shape than they actually are — and the uncertainty itself is part of the problem. Intuit’s January 2026 Financial Wellness Survey found that 37 percent of Americans find money management so overwhelming they do not know where to begin. For many people, the starting point they cannot find is a clear, current measurement of where they actually stand.Financial wellness measurement is the practice of assessing your financial health across a defined set of indicators, assigning a baseline, and tracking changes over time. It is what separates ‘I think I’m doing okay financially’ from ‘I know my savings rate is 12 percent, my DTI ratio is 28 percent, my emergency fund covers 2.4 months of expenses, and my net worth grew 8 percent last year.’ One of these statements is a feeling. The other is a foundation for improvement.
This guide presents the six key metrics for measuring financial wellness, the official validated tools developed by the Consumer Financial Protection Bureau (CFPB) and the Financial Health Network, and a practical scorecard for assessing your current position. The goal is not a perfect score. The goal is a clear, honest baseline from which the right next step becomes visible.
The Numbers: 31% of US households are financially healthy (Financial Health Pulse 2025). 37% find money management too overwhelming to know where to begin (Intuit January 2026). 68% of workers are very or somewhat financially stressed (PNC 2025). Only 29% feel hopeful about their financial future (down from 60% one year earlier).
What Financial Wellness Actually Measures (and What It Does Not)
Financial wellness is frequently misunderstood as a synonym for wealth. It is not. The Financial Planning Association’s November 2025 analysis of how financial wellness is categorised across academic and practitioner literature distinguishes between two distinct but related concepts:- Financial health: the objective, quantitative side — liquidity ratios, debt-to-asset ratios, credit scores, savings balances, income vs expenditure. These are the numbers that can be calculated, compared against benchmarks, and tracked over time.
- Financial well-being: the subjective, qualitative side — how secure you feel about your finances, your confidence in handling money decisions, your freedom from constant financial stress, your sense of being on track for the future.
The CFPB’s formal definition, which underpins their validated Financial Well-Being Scale, captures this dual nature: financial well-being is the state in which a person can fully meet current and upcoming financial obligations, feels secure in their financial future, and is able to make choices that allow them to enjoy life. The measurement framework that follows addresses both dimensions.
CFPB Financial Well-Being Definition: Financial well-being is a state of being in which a person can fully meet current and upcoming financial obligations, feels secure in their financial future, and is able to make choices that allow them to enjoy life.
The Official Tools: CFPB Scale and the FinHealth Score
The CFPB Financial Well-Being Scale
The Consumer Financial Protection Bureau developed its Financial Well-Being Scale as the first standardised, validated instrument for measuring consumer financial well-being in the United States. The scale consists of 10 questions — six of which assess behaviourally-anchored financial security statements (such as ‘I could handle a major unexpected expense’ and ‘I am just getting by financially’) and four of which assess financial freedom of choice. Respondents rate each statement on a five-point frequency scale. Responses are converted to a score between 0 and 100 using a scoring table. The scale is available free at consumerfinance.gov.CFPB score interpretation:
- 0–50: Low financial well-being. This range reflects significant financial stress, limited capacity to absorb shocks, and constrained freedom of financial choice.
- 51–61: Moderate financial well-being. Some financial stability but meaningful gaps remain in security and freedom.
- 62–100: High financial well-being. Strong sense of financial security, capacity to meet obligations, and confidence in the future.
The Financial Health Network FinHealth Score
The Financial Health Network updated its FinHealth Score framework in early 2026 after a multiyear refinement process to make it simpler, more concrete, and more user-friendly. The score measures financial health across four pillars — Spend, Save, Borrow, and Plan — using eight indicators (two per pillar) on a 0–100 scale. A score of 80 or above = financially healthy. Below 80 = room for improvement. The FinHealth Score Toolkit is available free for research, advocacy, and internal purposes at finhealthnetwork.org.The OECD/INFE Toolkit for Measuring Financial Literacy, Inclusion and Well-Being 2026 (published January 2026) provides an internationally comparable framework covering financial knowledge, behaviour, attitudes, financial resilience, and financial well-being — useful for understanding how your financial position compares to international benchmarks.
4. Metric 1: Your Savings Rate
Your savings rate is the percentage of your take-home income that you direct toward savings, investments, or additional debt payments above the minimum. It is the single most powerful indicator of your financial momentum because it quantifies how much of your income is working for your future rather than sustaining your present.How to calculate: divide your total monthly savings and investment contributions by your total monthly take-home income. Example: $600 saved from $4,000 take-home = a 15 percent savings rate.
Benchmark: Savings rate benchmarks — Below 5%: critically low — limited financial resilience; 5–10%: functional but below recommended minimums; 10–15%: approaching target range; 15–20%: healthy; above 20%: strong financial progress
The standard financial guidance — cited by NerdWallet, the CFPB, and most financial planning authorities — is to save 20 percent of take-home pay (the ‘20’ in the 50/30/20 rule). The US personal savings rate was 3.6 percent as of March 2026 (Federal Reserve FRED), illustrating the gap between the benchmark and the typical American household’s current position. If 20 percent feels distant, starting with 5 percent and increasing by 1 to 2 percentage points with each income rise is the evidence-based incremental approach.
How to Measure It: Calculate your savings rate once per month for three months before evaluating it. One month can be distorted by irregular expenses. Three months gives a reliable baseline. If your savings rate is near zero, the priority is identifying one category of spending that can be reduced to fund an automatic savings transfer of even $25 to $50 per payday. Automation is the mechanism that makes the number rise and stay risen.
Metric 2: Your Emergency Fund Coverage Ratio
Your emergency fund coverage ratio answers the question: how many months of essential living expenses could you cover from liquid savings if your income stopped tomorrow? This single number quantifies your financial resilience more accurately than any other metric.How to calculate: total your monthly essential expenses (rent/mortgage, utilities, groceries, minimum debt payments, insurance, childcare if applicable). Divide your liquid savings balance (cash, current account, instant-access savings — exclude investments you cannot access immediately) by this monthly total.
Example: $8,500 in liquid savings / $2,800 monthly essential expenses = 3.04 months of coverage.
Benchmark: Emergency fund benchmarks — Under 1 month: critical vulnerability; 1–2 months: limited buffer; 3 months: minimum recommended; 6 months: recommended for single-income households or variable income; above 6 months: conservative but appropriate for high financial anxiety or job insecurity
Investopedia’s 2025 analysis calculated that six months of emergency expenses for a typical US household totals $35,218. The U.S. News 2026 Financial Wellness Survey found that the median emergency fund balance fell from $10,000 to $5,000 in a single year, and more than 40 percent of respondents have no emergency fund at all. The emergency fund is the metric that most directly determines financial resilience — the FinHealth Score’s ‘Save’ pillar places it as the primary short-term savings indicator.
How to Measure It: Calculate your ratio using your actual monthly essential expenses, not your total spending. The emergency fund covers the expenses you could not pause in a crisis — rent, food, utilities, insurance, minimum debt payments. It does not need to cover dining out, subscriptions, or lifestyle spending. This calculation typically produces a smaller denominator and a more accurate resilience number than total monthly expenditure would.
Metric 3: Your Debt-to-Income (DTI) Ratio
The debt-to-income ratio is the percentage of your gross monthly income consumed by monthly debt payments. It is the primary metric used by lenders to assess credit risk, and it is one of the most reliable individual indicators of financial stress and financial capacity.How to calculate: add all monthly debt payments (mortgage or rent, car loan, student loans, credit card minimum payments, personal loans, any other debt obligation). Divide by your gross monthly income (before tax). Multiply by 100 for the percentage.
Example: $1,200 in monthly debt payments / $5,000 gross monthly income = 24 percent DTI.
The Gild Group’s July 2025 personal finance metrics guide identifies DTI as one of the most actionable metrics because it can be reduced by two routes: increasing income or reducing debt balances (which reduces minimum payments). The FinHealth Score’s ‘Borrow’ pillar uses DTI alongside credit score as the primary debt health indicators. Note that the DTI calculation for personal financial assessment uses gross income; some financial planning frameworks use net income, which typically produces a higher percentage.
How to Measure It: Calculate your DTI on both a gross and net income basis so you have both figures. Lenders use gross; your personal financial reality is better captured by net. If your gross DTI is below 36% but your net DTI is above 50%, you are carrying significant debt relative to your actual take-home income, which affects your real monthly cash flow more acutely than the lender’s metric would suggest.
Metric 4: Your Credit Score
Your credit score is a three-digit number between 300 and 850 (in the FICO and VantageScore systems used in the US) that quantifies your creditworthiness based on your credit history. It is the most widely accessed and immediately visible financial metric for most Americans because it appears on banking apps, credit card portals, and free monitoring services.Credit score ranges (Experian 2026):
- 300–579: Poor. Significant difficulty obtaining credit; high rates on any credit extended. Often indicative of missed payments, high credit utilisation, or collections.
- 580–669: Fair. Some credit products accessible but at above-average rates.
- 670–739: Good. Most mainstream credit products accessible at reasonable rates.
- 740–799: Very good. Better-than-average rates and terms; broad credit access.
- 800–850: Exceptional. Best available rates; strongest credit access.
The five factors that determine your FICO credit score:
- Payment history (35%): the single most important factor. Any missed payment has a significant negative impact.
- Credit utilisation (30%): the percentage of available credit in use. Below 30% is recommended; below 10% is optimal.
- Length of credit history (15%): longer histories are generally associated with higher scores.
- Credit mix (10%): having a variety of credit types (revolving, instalment) is positive.
- New credit (10%): opening many new accounts in a short period can lower the score.
8. Metric 5: Your Net Worth Trajectory
Net worth is the single most comprehensive snapshot of your overall financial position: the sum of all your assets minus all your liabilities. It captures savings, investments, property, and other assets on one side, and all debts on the other. It is the definitive measure of accumulated financial progress over time.How to calculate: list all assets (checking and savings balances, investment accounts, retirement accounts, estimated value of real estate if owned, market value of vehicles, other significant assets). List all liabilities (mortgage balance outstanding, car loan balance, student loan balance, credit card balances, personal loans, any other debts). Subtract total liabilities from total assets.
Net worth can be negative, particularly for younger adults with student loans and no accumulated assets. A negative net worth is not a failure. It is a starting point. The metric that matters for financial wellness measurement is not the absolute number but the trajectory: is your net worth increasing over time?
Benchmark: Net worth benchmarks — Negative to zero: normal for young adults with student debt; positive trajectory is the goal; growing by at least the rate of inflation annually indicates progress; Federal Reserve Survey of Consumer Finances (2022): median US household net worth approximately $192,700 (this varies enormously by age group)
The Gild Group’s personal finance metrics guide notes that while net worth might fluctuate due to big-ticket purchases or market changes, it should ideally trend upward over time. For most working-age households, net worth is most usefully tracked annually rather than more frequently, because short-term fluctuations in investment accounts can obscure the genuine underlying trajectory.
How to Measure It: Track net worth annually on the same date each year — the same week in January or April. Use a simple spreadsheet: date, total assets, total liabilities, net worth, year-on-year change. The year-on-year change percentage is more informative than the absolute number, and seeing it improve over multiple years is one of the most powerful motivators in personal finance.
9. Metric 6: Your Financial Stress Level (The Subjective Dimension)
The previous five metrics are quantitative — they produce specific numbers that can be compared against benchmarks and tracked over time. The sixth metric is qualitative: how you actually feel about your financial situation. This is not a soft addition to a hard framework. It is a validated dimension of financial wellness in its own right, captured by the CFPB’s Financial Well-Being Scale and the Financial Health Network’s FinHealth Score subjective indicators.The Financial Planning Association’s November 2025 analysis distinguishes between financial health (objective) and financial well-being (subjective) as the two necessary components of financial wellness. A household with technically healthy metrics but constant financial anxiety is not experiencing financial wellness. The subjective dimension is measured by asking:
- How often do you feel financial stress about your current financial situation?
- How confident do you feel about your ability to handle an unexpected financial expense?
- How secure do you feel about your financial future?
- To what extent does worry about money interfere with your sleep, relationships, or ability to focus on work?
People with strong financial literacy are 9 percent less likely to feel stressed or anxious, according to global financial wellness research cited by David Lerner Associates — confirming that the objective and subjective dimensions are related, but not identical. Improving the quantitative metrics reduces stress; addressing the subjective dimension through financial education, professional guidance, and deliberate planning builds confidence independently of the numbers.
Benchmark: Financial stress benchmark — Four or more hours per week of financial worry (PNC 2025 workplace benchmark) indicates significant financial stress requiring active intervention; zero to one hour per week indicates strong subjective financial wellness; the CFPB score of 62+ captures this as ‘high financial well-being’
The Financial Wellness Scorecard: Where Do You Stand?
Use the scorecard below to assess your current financial wellness position across all six metrics. Calculate each metric using the formulas in Sections 4 through 9, then rate yourself against the benchmark:Fill in your numbers for each metric. Count your Red, Amber, and Green zones. If you have two or more Red zones, those are your highest-priority areas. If all metrics are in the Amber or Green zone, focus on the one closest to the Red boundary. The metric that is weakest relative to its benchmark is your financial wellness entry point.
How the Metrics Connect: Reading Your Complete Picture
The six metrics do not exist in isolation. Their interactions reveal patterns that no single metric would surface alone:- A high DTI ratio and a low savings rate together indicate that debt servicing is consuming the income that should be building savings. The priority: debt reduction before savings increase, until the DTI falls below 36 percent and frees cash flow for savings.
- A healthy savings rate but no emergency fund suggests that savings are going somewhere other than liquid reserves — into investments, retirement accounts, or spending categories that feel like saving but are not immediately accessible. The priority: redirect part of the savings rate into a liquid emergency account until three months of coverage is established.
- A good credit score but high net worth volatility suggests that debt is being managed responsibly but assets are either not accumulating or fluctuating with market movements. This is a normal position for those heavily invested in equity; it becomes a concern if net worth is declining despite regular income.
- High financial stress levels despite objectively healthy metrics — a pattern documented in the Guardian’s Mind, Body and Wallet 2025 report — suggests that the subjective dimension requires attention independently. Education, professional financial advice, or financial coaching may be more effective than further optimisation of the numbers.
Setting Your Baseline and Tracking Progress
The value of financial wellness measurement is not the one-time score. It is the baseline and the trend. The Financial Health Network’s updated 2026 FinHealth Score specifically emphasises the ability to track changes in financial health over time — confirming that progress, not perfection, is the goal.A practical quarterly measurement system:
- Month 1 of each quarter: calculate all six metrics using the most recent three months of data. Record in a dedicated financial wellness tracker (a simple spreadsheet is sufficient). Note each metric’s zone (Red, Amber, Green).
- Identify the one metric that most needs attention based on its zone and its relationship to the others. Set a specific, measurable quarterly target for that metric.
- At the end of the quarter, recalculate that metric and assess progress. Celebrate movement in the right direction, even if it remains in the Amber zone.
- Annually: recalculate all six metrics, update net worth, and take the CFPB Financial Well-Being Scale assessment at consumerfinance.gov. Compare to the previous year’s baseline.
How to Measure It: Use the free CFPB Financial Well-Being Scale at consumerfinance.gov as your annual subjective benchmark. It takes under five minutes, produces a validated score on the 0–100 scale, and provides a comparable self-assessment across years. Pair it with your annual net worth calculation and savings rate review for a comprehensive annual financial wellness health check.
Conclusion
Sixty-one percent of those who say they are good at long-term financial planning report having high financial wellness, compared to 13 percent who report low financial health (Guardian Mind, Body and Wallet 2025). The planning habit, including the measurement habit that makes planning possible, is the distinguishing variable. Not the income. Not the age. Not the external circumstances. The willingness to look at the numbers clearly and build a response to what they show.Financial wellness measurement begins with six metrics: savings rate, emergency fund coverage ratio, debt-to-income ratio, credit score, net worth trajectory, and financial stress level. These six numbers, together with the CFPB’s validated Financial Well-Being Scale and the Financial Health Network’s updated FinHealth Score framework, give any household the tools to answer the question ‘How am I actually doing financially?’ with something more useful than a feeling.
The answer, once you have it, is the starting line. Not the finish. The finish is the direction that the answer reveals. Measurement is useful only when it changes decisions — and the first decision it should change is the decision to measure again, in three months, to find out whether the actions taken produced the movement intended. That discipline, applied consistently, is what converts financial anxiety into financial confidence.
Frequently Asked Questions
What is the CFPB Financial Well-Being Scale and how do I use it?The Consumer Financial Protection Bureau's Financial Well-Being Scale is a free, validated 10-question instrument that measures your financial well-being as a score between 0 and 100. It assesses your sense of financial security (the ability to handle unexpected expenses, not falling behind on finances) and financial freedom of choice (being able to enjoy life without constant money worry). Scores of 62 and above indicate high financial well-being; 51–61 indicates moderate; below 50 indicates low well-being. The tool is available free at consumerfinance.gov. Take it annually and track your score over time to measure the subjective dimension of your financial wellness alongside the quantitative metrics.
What is the FinHealth Score and what is a good score?
The FinHealth Score is a 0–100 measure of financial health developed by the Financial Health Network, updated in early 2026. It measures four pillars: Spend (living within your means), Save (short-term and long-term savings adequacy), Borrow (responsible debt management), and Plan (forward-looking financial planning and protection). Each pillar is scored using two survey questions. A score of 80 or above classifies a household as financially healthy. Below 80 indicates room for improvement, with lower scores indicating more acute financial health challenges. Only 31% of US households scored in the financially healthy range in spring 2025. The FinHealth Score Toolkit is available free for personal use at finhealthnetwork.org.
What is a good debt-to-income ratio?
According to CFPB guidance and mainstream mortgage lending standards, a DTI ratio below 36% is considered healthy, with the capacity to manage debt while maintaining financial flexibility. A ratio between 36% and 43% is considered concerning, and most mortgage lenders will not approve a home loan for applicants with a DTI above 43% (some will go to 50% under specific circumstances). Above 50% indicates that debt is consuming the majority of gross income, creating significant financial stress and limited capacity to save or invest. Your DTI is calculated by dividing total monthly debt payments by gross monthly income and multiplying by 100.
How much should I have in an emergency fund?
The standard recommended emergency fund is three to six months of essential living expenses. Investopedia's 2025 analysis calculated that six months of emergency expenses for a typical US household equals $35,218. Three months is the generally recommended minimum for dual-income households or those with stable employment; six months is recommended for single-income households, variable-income earners, those in industries with higher job volatility, or those with significant financial anxiety. A $1,000 initial milestone is the commonly cited first target for those building from zero. The U.S. News 2026 Financial Wellness Survey found the median emergency fund balance fell from $10,000 to $5,000 in a single year, reflecting how frequently these funds are being used and not rebuilt.
How often should I measure my financial wellness?
Most financial planning authorities recommend: (1) Monthly: calculate your savings rate and review your cash flow against your budget. (2) Quarterly: calculate your emergency fund coverage ratio and DTI ratio; review credit score via free monitoring. (3) Annually: calculate net worth (assets minus liabilities); take the CFPB Financial Well-Being Scale; review insurance coverage and estate planning status. The Financial Health Network's Benely guide recommends tracking both leading indicators (behaviour changes like increased saving or reduced impulse spending) and lagging indicators (actual metric improvements) because behaviours change before numbers do.
Can I have a good credit score but still be financially unwell?
Yes. A credit score measures creditworthiness, not overall financial wellness. A person can have a 750 credit score (they pay bills on time and manage available credit well) while simultaneously having a zero emergency fund, a high DTI ratio, a low savings rate, and high financial stress. Credit score is one of six key financial wellness metrics. It is an important indicator but not a comprehensive measure. Similarly, a person can have a lower credit score due to limited credit history rather than poor financial management, while having excellent savings habits and low stress. The full six-metric assessment provides a more accurate picture than any single metric, and the CFPB Financial Well-Being Scale captures the subjective dimension that no objective metric addresses.
0 Comments
Be the first to share your thoughts on this article.