
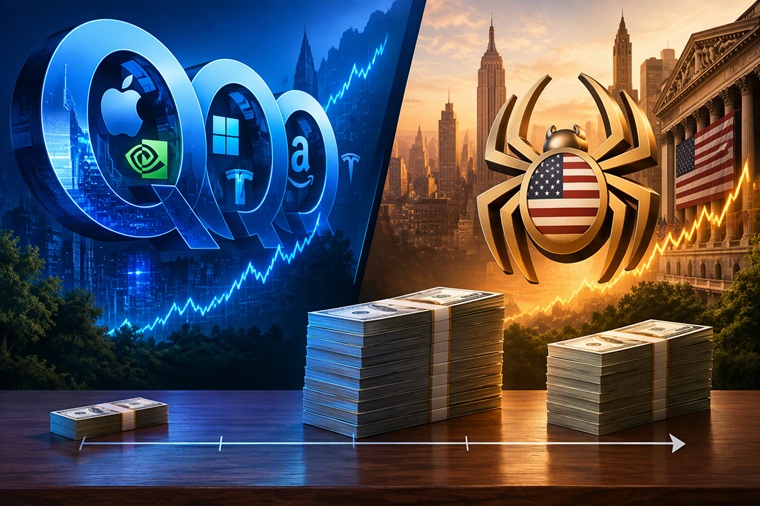
Investing
QQQ vs SPY: What $1,000 Invested 20 Years Ago Is Worth Today

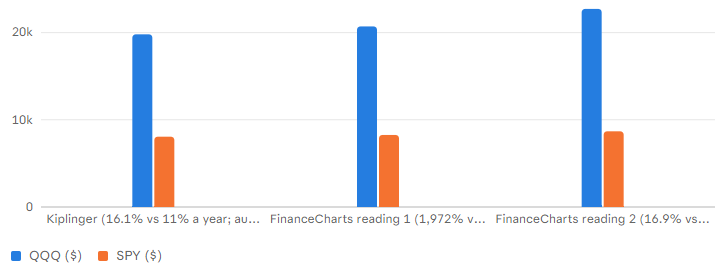
$1,000 in QQQ 20 years ago is worth about $20,000 (16.1% annualized) vs about $8,000 in SPY (11%); QQQ fell 36% from its peak in 2021–22 vs about 25% for SPY; other trackers: QQQ 16.4%–16.9% annualized, SPY about 11.4%. Costs and risk (secondary sources): expense ratios 0.18% (QQQ) vs 0.09% (SPY); yields 0.45% vs 0.99%; volatility 20.4% vs 15.3%; 2022 return −32.6% vs −18.2%; worst decline since inception about −83% vs about −56%; since March 1999, 10.8% vs 8.6% a year. My arithmetic: $1,000 at 16.1% for 20 years is about $19,800 and at 11% about $8,060, so QQQ finished about 2.5 times ahead; a 2022-style 32.6% fall turns $20,000 into about $13,500 (a $6,500 loss) vs a $1,450 loss on $8,000 for SPY; the expense gap is about $18 a year on $20,000.
Value of $1,000 ($) by (Nov 2026) and FinanceCharts (secondary); dollar values computed from the reported rates and total returns; start and end dates differ; past performance is not a forecast.
The honest answer is in the subtitle: mega-cap tech and communications stocks deliver outsized rewards, and greater risk. QQQ fell far deeper in the bad years and holds far fewer companies. This guide lays out the numbers, explains why QQQ won, shows what the ride cost, tests how much the answer depends on the start date and asks what it means for the next 20 years, without pretending to know.
In my arithmetic, $1,000 compounding at 16.1% for 20 years reaches about $19,800 and at 11% about $8,060, so QQQ finished about 2.5 times ahead: a five-point annual edge, sustained for 20 years, more than doubled the result. The question is not whether QQQ won, but whether the conditions that let it win will repeat, and at what cost along the way.
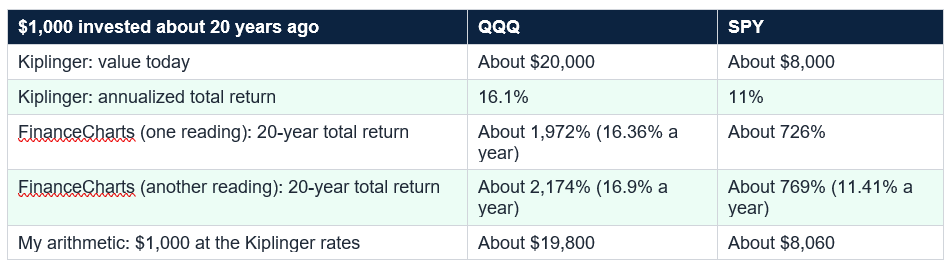
$1,000 in QQQ 20 years ago is worth about $20,000 (16.1% a year) vs about $8,000 in SPY (11% a year). Other trackers: QQQ about $20,700–$22,700; SPY about $8,300–$8,700. QQQ finished about 2.5 times ahead of SPY.
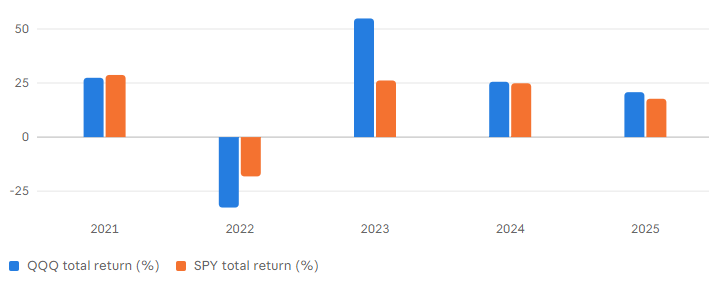
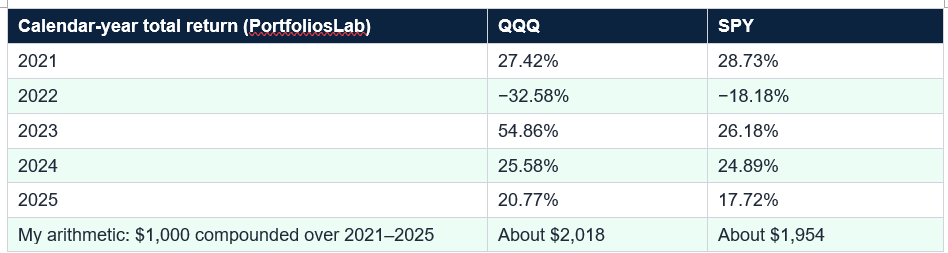
The calendar-year returns show how. In 2023, QQQ gained 54.86% against 26.18% for SPY, according to PortfoliosLab. In 2024 it gained 25.58% against 24.89%, in 2025 20.77% against 17.72% and in 2021 the two were close, 27.42% against 28.73%. The lead came in surges, with 2023 doing much of the work, and was partly given back in 2022, when QQQ lost 32.58% against 18.18%. Compounded over 2021 to 2025, $1,000 became about $2,020 in QQQ and $1,950 in SPY: a smaller gap than over 20 years, and a bumpier road.
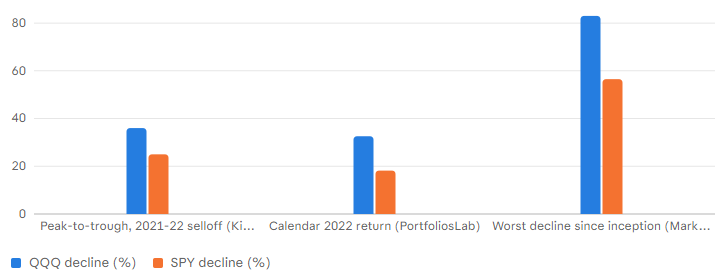
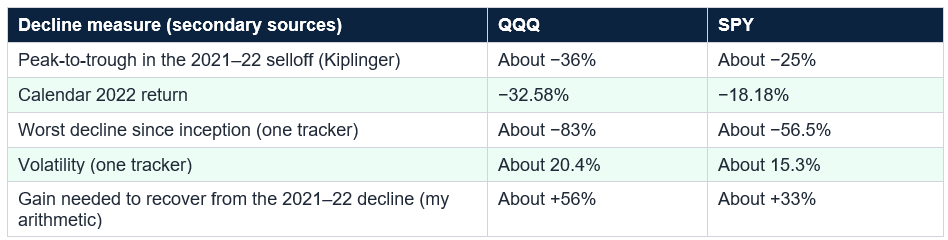
The history goes back further. Since inception, one tracker shows QQQ’s worst decline at about 83%, which in my general knowledge came in the dot-com bust, against about 56.5% for SPY, which came in the 2008 crisis. Recovery math makes this vivid: a 36% fall needs a 56% gain to get back to even, a 25% fall needs 33% and an 83% fall about 488%. In my illustration, a 2022-style 32.6% loss turns a $20,000 QQQ stake into about $13,500, a $6,500 hit, while an 18.2% loss on an $8,000 SPY stake costs about $1,450. The bigger the winner, the more there is to lose.
The same fund can look brilliant or disappointing depending on where you start. An investor who bought QQQ near the 2000 peak waited many years to get back to even, a general fact I did not retrieve from these sources. Today’s results reflect a long run of mega-cap leadership, and no law says it must continue. A fair comparison asks not just what happened but what you could have held through.

Lower dividends also mean lower annual taxes in a taxable account, a general point rather than a retrieved figure. The bigger cost for most investors is behavioral: DALBAR found the average investor earned about 6.8% a year over 30 years against 10.2% for the S&P 500, largely from badly timed trades, and a more volatile fund makes bad timing more likely.
QQQ’s next decade depends heavily on whether that spending turns into profits. If AI delivers, concentration will look like genius; if spending outruns returns, a fund with heavy weights in the same few names will feel it more than a broader fund. SPY does not escape that risk, since it holds the same giants, but it dilutes it with other sectors. Bessembinder’s finding that the best 4.3% of stocks created all the market’s net wealth is a reminder that picking winners is hard and that broad funds capture them without choosing.
QQQ and SPY overlap heavily, so owning both mostly doubles your exposure to the same mega-cap technology companies. If you want diversification, add different assets, not another fund full of the same names.
The sensible response is to avoid betting everything on one scenario: a market returning 8% a year for 20 years still turns $10,000 into $46,600. The question is how much extra risk you will take for the chance of beating that, and whether you can hold through a 36% drop without selling, since JPMorgan found that missing just the 10 best days over 20 years cut the S&P 500’s annualized return from about 10.6% to about 6.4%.

A few practical points: decide your allocation before the next drop, not during it; invest on a schedule; check what you already own, since your 401(k) and index funds may already hold plenty of the same mega-cap names; rebalance annually; and be honest about your reaction to losses, since if a 36% fall would make you sell, you will do better in a less volatile fund even if its long-run return is lower.
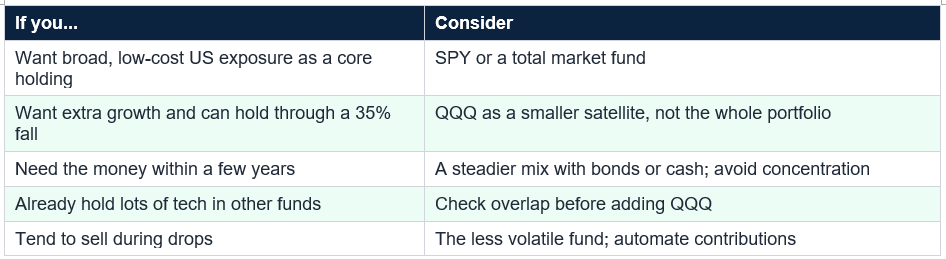
Look up what your current funds hold. If your top ten holdings are already mostly mega-cap tech, adding QQQ may add risk without adding diversification.
The practical takeaway is not that one fund is right. QQQ’s edge came from concentrated bets on mega-cap tech, and the same concentration brings deeper falls, so size it to your risk tolerance, keep a broad fund as the core and avoid owning both as equals. With AI spending now being questioned, nobody knows whether the next 20 years will favor the same names. A qualified adviser can help you decide.
According to Kiplinger, $1,000 in QQQ 20 years ago would be worth about $20,000 today, an annualized total return of 16.1%, against about $8,000 for SPY, or 11% annualized. Other trackers give slightly different figures depending on the dates: roughly $20,700 to $22,700 for QQQ and $8,300 to $8,700 for SPY. Past performance does not guarantee future results.
Is QQQ riskier than SPY?
Yes. QQQ fell about 36% from its peak in the 2021 to 2022 rate-hike selloff, against about 25% for SPY, and in calendar 2022 it lost 32.6% against 18.2% for SPY. Since the late 1990s its worst decline was roughly 83% against about 56% for SPY. QQQ holds about 100 large Nasdaq-listed companies, heavily weighted to tech, while SPY holds the broader S&P 500.
Which is cheaper, QQQ or SPY?
SPY. Its expense ratio is 0.09% against 0.18% for QQQ, according to several trackers. On $20,000 that is about $18 a year, small compared with the return gap, but it adds up. SPY also yields more, about 0.99% against 0.45% for QQQ, so SPY pays more income per dollar.
Should I own both QQQ and SPY?
Usually not as equals. They overlap heavily because the largest S&P 500 companies are also Nasdaq-100 giants, so owning both mostly doubles your tech exposure. Many investors choose a broad fund like SPY or a total market fund as the core and add QQQ as a smaller satellite if they want extra growth and accept extra risk. This is general education, not personal advice.
Will QQQ keep beating SPY?
Nobody knows. The past 20 years include a long run of mega-cap tech dominance, and QQQ’s lead depends heavily on the start date: since March 1999, including the dot-com crash, QQQ’s annualized return was about 10.8% against 8.6% for SPY. This week’s selloff in AI-spending names such as Alphabet and Amazon is a reminder that leadership can change.
Table of Contents
- The $12,000 Question
- The Short Answer
- The Numbers
- Why QQQ Won
- The Price of the Ride: Drawdowns
- The Start Date Changes the Story
- Costs, Income and Taxes
- Concentration and This Week’s AI Selloff
- The Next 20 Years: Scenarios
- How to Choose
- Common Mistakes
- Conclusion
- Frequently Asked Questions
What $1,000 invested 20 years ago is worth today: QQQ vs. SPY across three readings ($)
Value of $1,000 ($) by (Nov 2026) and FinanceCharts (secondary); dollar values computed from the reported rates and total returns; start and end dates differ; past performance is not a forecast.
The price of the ride: how far each fund fell (%)
Decline (%) by Kiplinger, PortfoliosLab and MarketXLS (secondary sources); the since-inception windows differ and cover different crises
Surges and slumps: calendar-year total returns, 2021-2025 (%)
Calendar-year total return (%) by PortfoliosLab (secondary source, about six months old); compounded $1,000 over 2021-2025 is about $2,018 in QQQ vs $1,954 in SPY (author's arithmetic)
The $12,000 Question
Imagine you had put $1,000 into the Invesco QQQ ETF 20 years ago, in late 2006, and the same $1,000 into the SPDR S&P 500 ETF. According to Kiplinger, the QQQ stake would be worth about $20,000 today, an annualized total return of 16.1%. The SPY stake would be worth about $8,000, or 11% a year. That is a gap of roughly $12,000 on a $1,000 investment, and it is the kind of number that makes people ask why anyone owns anything else.The honest answer is in the subtitle: mega-cap tech and communications stocks deliver outsized rewards, and greater risk. QQQ fell far deeper in the bad years and holds far fewer companies. This guide lays out the numbers, explains why QQQ won, shows what the ride cost, tests how much the answer depends on the start date and asks what it means for the next 20 years, without pretending to know.
The Short Answer
QQQ crushed SPY over the past 20 years, about $20,000 against about $8,000 on $1,000, because the Nasdaq-100 is packed with the mega-cap technology and communications companies that drove the market. But QQQ fell about 36% in the 2021 to 2022 selloff against about 25% for SPY, lost 32.6% in 2022 alone against 18.2% and has a history of much deeper declines, and its lead depends on the window: since 1999, including the dot-com crash, the gap is far smaller. For most investors SPY or a broad fund is the core and QQQ a satellite for those who can stomach the swings.The Numbers
Trackers give slightly different 20-year figures because they use different start and end dates. Kiplinger puts QQQ at about $20,000 and 16.1% annualized, and SPY at about $8,000 and 11%. FinanceCharts shows a 20-year total return of about 1,972% for QQQ, or 16.36% a year, turning $1,000 into about $20,700, and 726% for SPY; a second reading shows 2,174% for QQQ, 16.9% a year, or about $22,700, and about 769% for SPY, 11.41% a year, or about $8,700. The pattern is the same everywhere: QQQ ahead by roughly 2.5 times.In my arithmetic, $1,000 compounding at 16.1% for 20 years reaches about $19,800 and at 11% about $8,060, so QQQ finished about 2.5 times ahead: a five-point annual edge, sustained for 20 years, more than doubled the result. The question is not whether QQQ won, but whether the conditions that let it win will repeat, and at what cost along the way.
$1,000 in QQQ 20 years ago is worth about $20,000 (16.1% a year) vs about $8,000 in SPY (11% a year). Other trackers: QQQ about $20,700–$22,700; SPY about $8,300–$8,700. QQQ finished about 2.5 times ahead of SPY.
Why QQQ Won
QQQ tracks the Nasdaq-100, which in my general knowledge holds about 100 of the largest non-financial companies listed on the Nasdaq and weights the biggest most heavily. Over 20 years, the biggest of those, such as Apple, Microsoft, Amazon, Alphabet and Nvidia, were the engines of the market. According to a recent Motley Fool piece, the fund’s five biggest holdings are Nvidia, Apple, Microsoft, Micron Technology and Amazon, a list that reflects the AI buildout. When mega-cap technology compounds faster than the rest of the market, a fund concentrated in it wins.The calendar-year returns show how. In 2023, QQQ gained 54.86% against 26.18% for SPY, according to PortfoliosLab. In 2024 it gained 25.58% against 24.89%, in 2025 20.77% against 17.72% and in 2021 the two were close, 27.42% against 28.73%. The lead came in surges, with 2023 doing much of the work, and was partly given back in 2022, when QQQ lost 32.58% against 18.18%. Compounded over 2021 to 2025, $1,000 became about $2,020 in QQQ and $1,950 in SPY: a smaller gap than over 20 years, and a bumpier road.
The Price of the Ride: Drawdowns
The reward came with a roller coaster. When the Federal Reserve raised rates rapidly in 2021 and 2022, QQQ fell 36% from its peak, according to Kiplinger, while SPY suffered a drawdown of roughly 25%. In calendar 2022 QQQ lost 32.58% against 18.18%, and PortfoliosLab put the 2022 peak-to-trough drop at 34.83% against 24.50%. Volatility tells the same story: about 20.4% for QQQ against 15.3% for SPY in one tracker’s data.The history goes back further. Since inception, one tracker shows QQQ’s worst decline at about 83%, which in my general knowledge came in the dot-com bust, against about 56.5% for SPY, which came in the 2008 crisis. Recovery math makes this vivid: a 36% fall needs a 56% gain to get back to even, a 25% fall needs 33% and an 83% fall about 488%. In my illustration, a 2022-style 32.6% loss turns a $20,000 QQQ stake into about $13,500, a $6,500 hit, while an 18.2% loss on an $8,000 SPY stake costs about $1,450. The bigger the winner, the more there is to lose.
The Start Date Changes the Story
Twenty years is a nice round window, but it is a choice: it starts in late 2006, before the financial crisis, and runs through a long period of tech dominance. Start earlier and the picture changes. One tracker shows that since March 1999, QQQ has returned about 10.78% a year against 8.58% for SPY. In my arithmetic over about 27.6 years that turns $1,000 into about $16,900 for QQQ and $9,700 for SPY, a gap of about 1.7 times instead of 2.5, because QQQ was hit by an 83% crash early on.The same fund can look brilliant or disappointing depending on where you start. An investor who bought QQQ near the 2000 peak waited many years to get back to even, a general fact I did not retrieve from these sources. Today’s results reflect a long run of mega-cap leadership, and no law says it must continue. A fair comparison asks not just what happened but what you could have held through.
Costs, Income and Taxes
QQQ costs more and pays less. Its expense ratio is 0.18%, against 0.09% for SPY, according to several trackers, and its dividend yield is about 0.45% against about 0.99%. On $20,000 the fee gap is about $18 a year, and on $100,000 about $90, while SPY pays about $990 a year in dividends per $100,000 against about $450 for QQQ. The fee gap is small next to the return gap, but it is real, and investors who want income may prefer SPY.Lower dividends also mean lower annual taxes in a taxable account, a general point rather than a retrieved figure. The bigger cost for most investors is behavioral: DALBAR found the average investor earned about 6.8% a year over 30 years against 10.2% for the S&P 500, largely from badly timed trades, and a more volatile fund makes bad timing more likely.
Concentration and This Week’s AI Selloff
QQQ’s weakness is the flip side of its strength: concentration. A handful of mega-cap companies drive a large share of the fund, and they are tied to similar themes, especially AI. Last week showed what that can mean: Alphabet fell 12% on October 29, its worst day by percentage, and Amazon dropped after reporting record capital spending, as covered earlier in this series, while the four largest US tech companies plan more than $740 billion of capex this year. In my general knowledge, those companies are among the larger holdings of both funds.QQQ’s next decade depends heavily on whether that spending turns into profits. If AI delivers, concentration will look like genius; if spending outruns returns, a fund with heavy weights in the same few names will feel it more than a broader fund. SPY does not escape that risk, since it holds the same giants, but it dilutes it with other sectors. Bessembinder’s finding that the best 4.3% of stocks created all the market’s net wealth is a reminder that picking winners is hard and that broad funds capture them without choosing.
QQQ and SPY overlap heavily, so owning both mostly doubles your exposure to the same mega-cap technology companies. If you want diversification, add different assets, not another fund full of the same names.
The Next 20 Years: Scenarios
If the next 20 years look like the last, $1,000 would again become about $20,000 in QQQ and $8,000 in SPY, but there is no reason to assume that. If QQQ’s premium vanished and it earned the same 11% as SPY, $10,000 would grow to about $80,600 in either; at 8% about $46,600, at 6% about $32,100 and if QQQ repeated 16.1%, about $198,000. These are hypotheticals, not forecasts, and they show how sensitive the outcome is to the return rate.The sensible response is to avoid betting everything on one scenario: a market returning 8% a year for 20 years still turns $10,000 into $46,600. The question is how much extra risk you will take for the chance of beating that, and whether you can hold through a 36% drop without selling, since JPMorgan found that missing just the 10 best days over 20 years cut the S&P 500’s annualized return from about 10.6% to about 6.4%.
How to Choose
The choice depends on your goals, time horizon and nerves. For broad, low-cost exposure to the US market, SPY or a total market fund suits most people as the core. If you want extra growth and accept more volatility, QQQ can serve as a satellite, perhaps 10% to 20% of your stock holdings (an illustration, not advice), while investors close to retirement or needing money soon may prefer the broader, steadier fund. Most of your result will come from how much you save and how long you stay invested.A few practical points: decide your allocation before the next drop, not during it; invest on a schedule; check what you already own, since your 401(k) and index funds may already hold plenty of the same mega-cap names; rebalance annually; and be honest about your reaction to losses, since if a 36% fall would make you sell, you will do better in a less volatile fund even if its long-run return is lower.
Look up what your current funds hold. If your top ten holdings are already mostly mega-cap tech, adding QQQ may add risk without adding diversification.
Common Mistakes
Common mistakes include chasing the winner after a 20-year run, assuming past returns will repeat, ignoring drawdowns, owning QQQ and SPY at the same time and thinking you are diversified, putting a whole portfolio in one theme, selling after a big fall, forgetting that the start date shapes every comparison and judging funds only on return while ignoring volatility, fees and income.Conclusion
QQQ versus SPY is a story of reward and risk. According to Kiplinger, $1,000 in QQQ 20 years ago is worth about $20,000, a 16.1% annualized return, against about $8,000 for SPY at 11%. But QQQ fell 36% in the 2021 to 2022 selloff against about 25%, lost 32.6% in 2022 against 18.2%, costs 0.18% against 0.09% and pays less income, and its lead depends on the window: since 1999 the gap shrinks to about 10.8% against 8.6% a year.The practical takeaway is not that one fund is right. QQQ’s edge came from concentrated bets on mega-cap tech, and the same concentration brings deeper falls, so size it to your risk tolerance, keep a broad fund as the core and avoid owning both as equals. With AI spending now being questioned, nobody knows whether the next 20 years will favor the same names. A qualified adviser can help you decide.
Frequently Asked Questions
How much would $1,000 in QQQ and SPY be worth after 20 years?According to Kiplinger, $1,000 in QQQ 20 years ago would be worth about $20,000 today, an annualized total return of 16.1%, against about $8,000 for SPY, or 11% annualized. Other trackers give slightly different figures depending on the dates: roughly $20,700 to $22,700 for QQQ and $8,300 to $8,700 for SPY. Past performance does not guarantee future results.
Is QQQ riskier than SPY?
Yes. QQQ fell about 36% from its peak in the 2021 to 2022 rate-hike selloff, against about 25% for SPY, and in calendar 2022 it lost 32.6% against 18.2% for SPY. Since the late 1990s its worst decline was roughly 83% against about 56% for SPY. QQQ holds about 100 large Nasdaq-listed companies, heavily weighted to tech, while SPY holds the broader S&P 500.
Which is cheaper, QQQ or SPY?
SPY. Its expense ratio is 0.09% against 0.18% for QQQ, according to several trackers. On $20,000 that is about $18 a year, small compared with the return gap, but it adds up. SPY also yields more, about 0.99% against 0.45% for QQQ, so SPY pays more income per dollar.
Should I own both QQQ and SPY?
Usually not as equals. They overlap heavily because the largest S&P 500 companies are also Nasdaq-100 giants, so owning both mostly doubles your tech exposure. Many investors choose a broad fund like SPY or a total market fund as the core and add QQQ as a smaller satellite if they want extra growth and accept extra risk. This is general education, not personal advice.
Will QQQ keep beating SPY?
Nobody knows. The past 20 years include a long run of mega-cap tech dominance, and QQQ’s lead depends heavily on the start date: since March 1999, including the dot-com crash, QQQ’s annualized return was about 10.8% against 8.6% for SPY. This week’s selloff in AI-spending names such as Alphabet and Amazon is a reminder that leadership can change.
0 Comments
Be the first to share your thoughts on this article.