

Financial Literacy
Rich vs. Wealthy: The Gap Could Change Your Financial Future

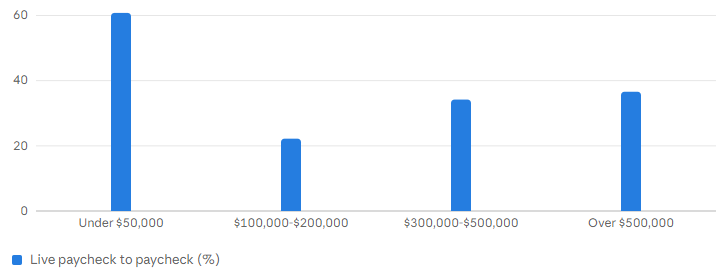
Rich is not wealthy (Goldman Sachs Asset Management 2026 survey): 60.8% of households under $50,000 live paycheck to paycheck, 22.2% at $100,000–$200,000, 34.2% at $300,000–$500,000 and 36.6% above $500,000 (other coverage reports 40%–41% for the top bands). Net worth (Fed SCF 2022, latest complete): median household $192,900, mean $1,063,700 (5.5x); medians by age from $39,040 (under 35) to $409,900 (65–74); about 23.6 million US millionaires (8.8% of adults, UBS); 79% received no inheritance (Ramsey survey). My arithmetic (20 years, 7%): Maya takes home $170,000, spends $165,000 and saves $5,000 a year, reaching about $205,000 (5% of the $4.1 million her lifestyle needs); Ben takes home $60,000, spends $45,000 and saves $15,000, reaching about $615,000 (55% of the $1.1 million he needs).
% living paycheck to paycheck by Goldman Sachs Asset Management 2026 survey via BigGo; other coverage reports 41% and 40% for the top two bands
That is the difference between rich and wealthy. Rich is what you can see: income, the car, the house, the lifestyle. Wealthy is what you own and what it lets you do: assets that grow, a cushion that lasts and the freedom to say no. The two often overlap, but they are not the same thing, and confusing them is one of the most expensive mistakes in personal finance. This guide explains the difference, shows what the 2026 data say and gives you four ways to measure which one you are building.
The report’s authors blame elevated expenses, debt burdens and lifestyle inflation, which can erode saving capacity across the income spectrum. High earners can qualify for more credit and carry it longer without noticing. Housing, child care and health care swallow take-home pay. The takeaway is not that high earners are foolish. It is that income expands to fill the space available, and that a big paycheck makes it easier to look rich while building little wealth.

Goldman Sachs Asset Management 2026 survey: 60.8% of households under $50,000, 22.2% of $100,000–$200,000, 34.2% of $300,000–$500,000 and 36.6% of those above $500,000 live paycheck to paycheck (some coverage reports 40%–41% for the top bands).
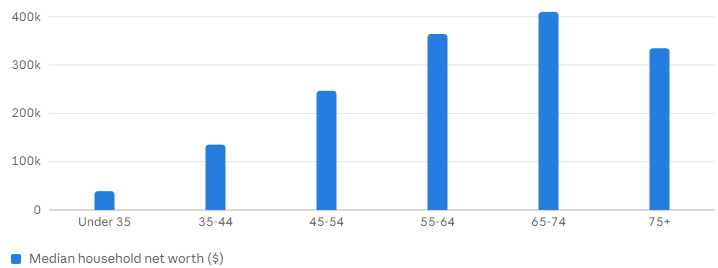
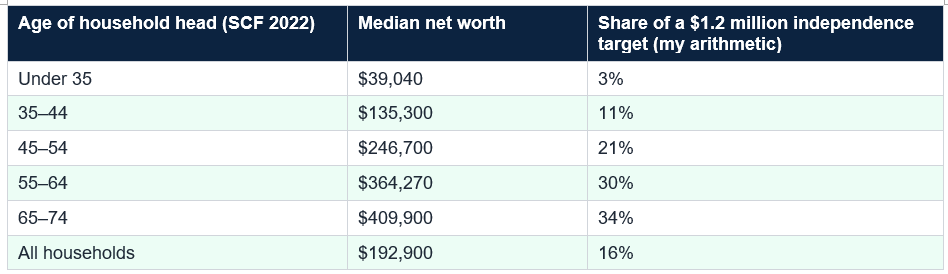
Age matters enormously. Median net worth was about $39,040 for households under 35, $135,300 for ages 35 to 44, $246,700 for 45 to 54, $364,270 for 55 to 64 and $409,900 for 65 to 74, then fell to about $334,700 after 75 as savings were spent. UBS estimates about 23.6 million Americans, 8.8% of adults, are millionaires, and a Ramsey Solutions survey found 79% received no inheritance. The first fact is that most households are far from rich. The second is that wealth is usually built, not given.
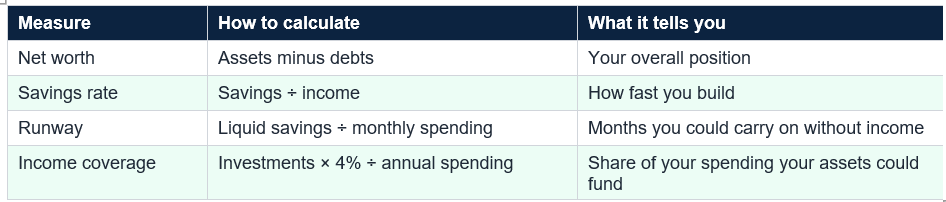
The fourth is income coverage, or what some people call a financial independence number. A common rule of thumb says you can sustain spending of about 4% of your investments a year, so assets of about 25 times your annual spending would cover it. If you spend $4,000 a month, $48,000 a year, the number is $1.2 million. It is a guideline, not a guarantee, since returns and spending vary. The value of the measure is that it ties wealth to your own lifestyle: a person who spends less needs a smaller number, which is why the quiet saver often gets there first.
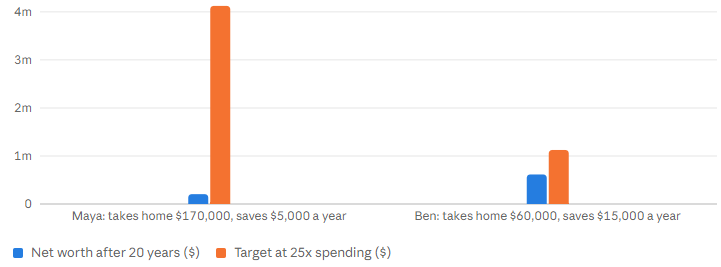
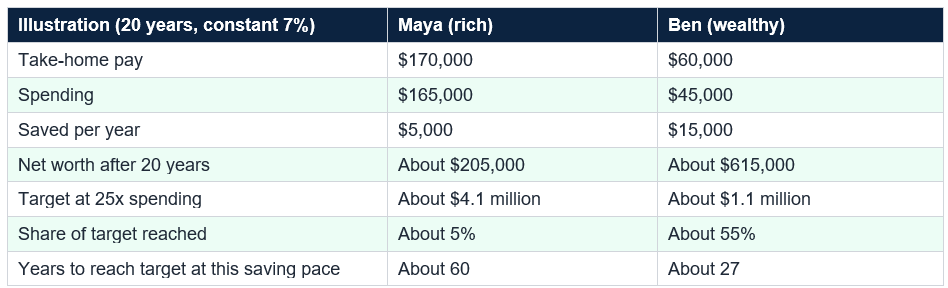
Now compare each to the portfolio their lifestyle needs. Maya’s spending of $165,000 implies a target of about $4.1 million at 25 times spending, and her $205,000 covers 5%. Ben’s spending of $45,000 implies about $1.1 million, and his $615,000 covers about 55%. Her investments could fund about $8,200 a year of her spending and his about $24,600. At those savings rates, Ben reaches his number in about 27 years of saving, and Maya would take about 60. Same decades, opposite outcomes. Maya is richer. Ben is on his way to wealthy.
Maya: saves $5,000 a year, about $205,000 after 20 years at 7%, 5% of her $4.1 million target. Ben: saves $15,000 a year, about $615,000, 55% of his $1.1 million target. Same 7% return, same 20 years.
They also avoid expensive debt, since the average credit card rate was about 20.9%, and they keep a cash cushion so a surprise never forces a sale. And they think in decades. With top savings accounts paying 4.34% to 4.50% and inflation at 3.7%, cash earns a modest real return, which is fine for a cushion and poor for long-term growth. None of this requires a high income. It requires a gap between income and spending and the patience to let it compound.
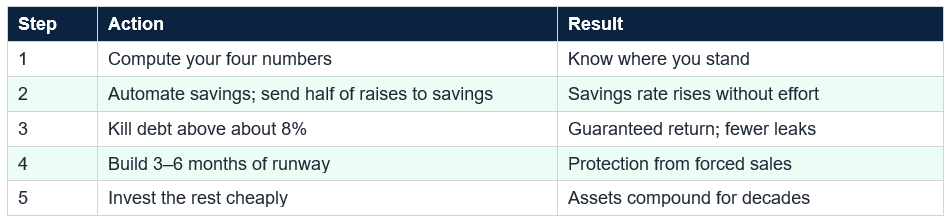
Next, change the default. Pay yourself first with an automatic transfer on payday. Send half of every raise to savings, so lifestyle cannot absorb it. Eliminate expensive debt. Invest in broad, low-cost funds inside tax-advantaged accounts such as a 401(k) and a Roth IRA. And measure your lifestyle by what it costs to sustain, not what it looks like. A cheaper life needs a smaller number, which brings freedom years closer. This is not about deprivation. It is about deciding what you want your money to do.
There is a counter-risk, too. It is possible to chase a number so hard that you forget to live, hoarding for a future that never feels sufficient. The goal is balance: enough saved to be secure and free, enough spent to enjoy the life you are building. Wealthy people, in the best sense, know their number, know their enough and are not driven by comparison with the neighbor in the luxury SUV.
Your independence number depends on your spending, taxes, location, health costs and longevity. The 4% guideline is a rule of thumb, and returns are not guaranteed.
Measure your net worth, savings rate, runway and independence number. In my illustration, Ben, who earns a third as much as Maya but saves three times as much, ends up with three times the net worth after 20 years and reaches his target in about half the time. Automate your savings, send half of every raise to your future, avoid expensive debt, invest cheaply and keep your lifestyle below your means. You can look rich in a day. Becoming wealthy takes years, but it is available to people of ordinary income who choose it. This is general education, not personalized advice.
Rich usually describes income and the lifestyle it supports; wealthy describes the assets you own and the freedom they buy. A person can earn $300,000 and spend nearly all of it, which looks rich, while another earns $75,000, saves a quarter of it and invests it, which builds wealth. This is a definition I use for clarity rather than a legal or official one.
Can you be rich but not wealthy?
Yes, and it is common. Goldman Sachs Asset Management’s 2026 retirement survey found that more than a third of households earning over $500,000 say they live paycheck to paycheck, and other coverage of the same report put the share closer to 40%. High income without savings and investments leaves you exposed if the paycheck stops.
How do I know if I am wealthy?
Look at four measures: net worth, savings rate, runway (how many months of spending your liquid savings could cover) and income coverage (how much of your spending your assets could fund). A common rule of thumb says you can sustain spending of about 4% of your investments a year, so assets of about 25 times your annual spending would cover it. These are guidelines, not guarantees.
What is the average net worth in the US?
The Federal Reserve’s 2022 Survey of Consumer Finances, the most recent complete data I found, shows a median household net worth of about $192,900 and a mean of about $1,063,700. The mean is about 5.5 times the median because very large fortunes pull it up. The median ranged from about $39,000 for households under 35 to about $410,000 for ages 65 to 74.
How can I become wealthy on an ordinary income?
Save a meaningful share of income, invest it in low-cost, diversified funds, avoid expensive debt and let time work. In my illustration, saving $15,000 a year for 20 years at a constant 7% grows to about $615,000. About 79% of millionaires in one survey received no inheritance, which suggests ordinary paths exist. This is general education, not personal advice.
Table of Contents
- Two Neighbors
- The Short Answer
- Why Income Is Not Wealth
- What Wealth Looks Like in Numbers
- Four Ways to Measure Wealth
- Maya and Ben: The Math
- What Wealthy People Do Differently
- How to Move From Rich-Looking to Wealthy
- Wealth Beyond the Balance Sheet
- Conclusion
- Frequently Asked Questions
Rich is not wealthy: households living paycheck to paycheck by income (%)
% living paycheck to paycheck by Goldman Sachs Asset Management 2026 survey via BigGo; other coverage reports 41% and 40% for the top two bands
What typical wealth looks like: median net worth by age of household head ($)
Median net worth ($) by Federal Reserve Survey of Consumer Finances 2022 (latest complete data), via CompoundLadder; all-household median about $192,900; mean about $1.06 million
Maya (rich) vs. Ben (wealthy): net worth after 20 years vs. the target their lifestyle needs ($)
Dollars by Author's illustration at a constant 7%, no taxes or fees; Maya reaches 5% of her target, Ben about 55%; not a forecast
Two Neighbors
Imagine two neighbors on the same street. One drives a new luxury SUV, takes three vacations a year and earns, everyone assumes, a great deal. The other drives a ten-year-old sedan, takes one modest trip and earns far less. Which one is richer? On the surface, it is obvious. Look at their finances in 20 years, though, and the answer may reverse. The first neighbor may still be working at 68 to cover the lifestyle, while the second may be choosing whether to work at all.That is the difference between rich and wealthy. Rich is what you can see: income, the car, the house, the lifestyle. Wealthy is what you own and what it lets you do: assets that grow, a cushion that lasts and the freedom to say no. The two often overlap, but they are not the same thing, and confusing them is one of the most expensive mistakes in personal finance. This guide explains the difference, shows what the 2026 data say and gives you four ways to measure which one you are building.
The Short Answer
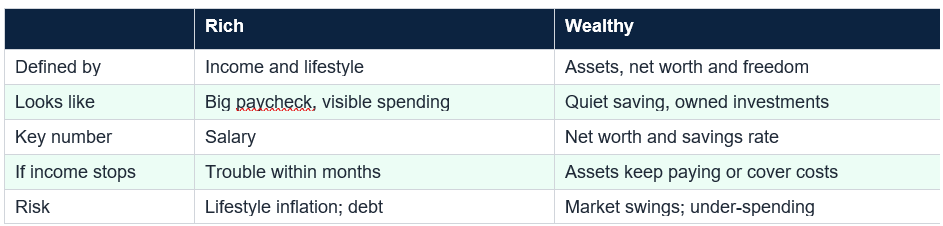
Rich describes income and the lifestyle it supports. Wealthy describes the assets you own, the cash flow they could produce and the time and choices they buy you. You can be rich without being wealthy, which is common among high earners who spend almost everything, and you can be wealthy without looking rich, which is common among steady savers who invest. The test is not how much comes in but how much stays and grows. If your paycheck stopped, how long could you carry on, and what could you do?
Why Income Is Not Wealth
The cleanest proof comes from high earners themselves. Goldman Sachs Asset Management’s 2026 retirement survey found that 60.8% of households earning under $50,000 say they live paycheck to paycheck, as you would expect. But so do 22.2% of those earning $100,000 to $200,000, 34.2% of those earning $300,000 to $500,000 and 36.6% of those earning over $500,000, according to one report of the study. Another outlet reported 41% and 40% for the top two bands, so treat those figures as a range of roughly 34% to 41%.The report’s authors blame elevated expenses, debt burdens and lifestyle inflation, which can erode saving capacity across the income spectrum. High earners can qualify for more credit and carry it longer without noticing. Housing, child care and health care swallow take-home pay. The takeaway is not that high earners are foolish. It is that income expands to fill the space available, and that a big paycheck makes it easier to look rich while building little wealth.
Goldman Sachs Asset Management 2026 survey: 60.8% of households under $50,000, 22.2% of $100,000–$200,000, 34.2% of $300,000–$500,000 and 36.6% of those above $500,000 live paycheck to paycheck (some coverage reports 40%–41% for the top bands).
What Wealth Looks Like in Numbers
Now the other side of the ledger. The Federal Reserve’s Survey of Consumer Finances, whose 2022 wave remains the most recent complete data I found, shows a median US household net worth of about $192,900 and a mean of about $1,063,700. The mean is about 5.5 times the median because a small number of very large fortunes pull it up. The typical household is much less wealthy than the average one, which is why headlines about average wealth can mislead.Age matters enormously. Median net worth was about $39,040 for households under 35, $135,300 for ages 35 to 44, $246,700 for 45 to 54, $364,270 for 55 to 64 and $409,900 for 65 to 74, then fell to about $334,700 after 75 as savings were spent. UBS estimates about 23.6 million Americans, 8.8% of adults, are millionaires, and a Ramsey Solutions survey found 79% received no inheritance. The first fact is that most households are far from rich. The second is that wealth is usually built, not given.
Four Ways to Measure Wealth
Because income is easy to see and wealth is not, it helps to have measures. The first is net worth: what you own minus what you owe. It is the simplest scoreboard, and it should rise over time. The second is your savings rate: the share of income you keep and invest. Vanguard reports an average total savings rate of 12.1% in its plans, while Fidelity found 401(k) millionaires saved 17.3% of pay, or 25.8% with employer contributions, against a 14.4% average. The third is runway: your liquid savings divided by monthly spending, the number of months you could carry on without income. Bankrate found only 46% of Americans could cover three months of expenses.The fourth is income coverage, or what some people call a financial independence number. A common rule of thumb says you can sustain spending of about 4% of your investments a year, so assets of about 25 times your annual spending would cover it. If you spend $4,000 a month, $48,000 a year, the number is $1.2 million. It is a guideline, not a guarantee, since returns and spending vary. The value of the measure is that it ties wealth to your own lifestyle: a person who spends less needs a smaller number, which is why the quiet saver often gets there first.
Maya and Ben: The Math
Here is a story with numbers, all of it my illustration. Maya earns a high salary, takes home $170,000 and spends $165,000 a year, so she saves $5,000. Ben takes home $60,000 and spends $45,000, so he saves $15,000. Maya looks richer in every way. But invest each person’s savings at a constant 7% for 20 years and Maya has about $205,000 while Ben has about $615,000. Ben has three times the net worth on a third of the income.Now compare each to the portfolio their lifestyle needs. Maya’s spending of $165,000 implies a target of about $4.1 million at 25 times spending, and her $205,000 covers 5%. Ben’s spending of $45,000 implies about $1.1 million, and his $615,000 covers about 55%. Her investments could fund about $8,200 a year of her spending and his about $24,600. At those savings rates, Ben reaches his number in about 27 years of saving, and Maya would take about 60. Same decades, opposite outcomes. Maya is richer. Ben is on his way to wealthy.
Maya: saves $5,000 a year, about $205,000 after 20 years at 7%, 5% of her $4.1 million target. Ben: saves $15,000 a year, about $615,000, 55% of his $1.1 million target. Same 7% return, same 20 years.
What Wealthy People Do Differently
Researchers and advisers point to a handful of habits. They save a meaningful share of income, which is the biggest lever: Fidelity’s 401(k) millionaires saved far more than average. They keep spending below income even as it grows, resisting lifestyle inflation. They invest in diversified, low-cost assets and hold them: S&P Dow Jones Indices found 79% of active large-cap funds trailed the S&P 500 in 2025, and DALBAR research found the average investor earned about 6.8% over 30 years against 10.2% for the S&P 500 because of badly timed trades.They also avoid expensive debt, since the average credit card rate was about 20.9%, and they keep a cash cushion so a surprise never forces a sale. And they think in decades. With top savings accounts paying 4.34% to 4.50% and inflation at 3.7%, cash earns a modest real return, which is fine for a cushion and poor for long-term growth. None of this requires a high income. It requires a gap between income and spending and the patience to let it compound.
How to Move From Rich-Looking to Wealthy
Start by measuring. Add up your assets and debts for a net worth, divide your yearly savings by your income for a savings rate, divide your liquid cash by monthly spending for a runway and multiply your annual spending by 25 for your independence number. Write the four numbers down. Then pick the one that is weakest and work on it for 90 days. If your runway is under three months, build the cushion. If your savings rate is under 10%, raise it by a point every few months and automate it.Next, change the default. Pay yourself first with an automatic transfer on payday. Send half of every raise to savings, so lifestyle cannot absorb it. Eliminate expensive debt. Invest in broad, low-cost funds inside tax-advantaged accounts such as a 401(k) and a Roth IRA. And measure your lifestyle by what it costs to sustain, not what it looks like. A cheaper life needs a smaller number, which brings freedom years closer. This is not about deprivation. It is about deciding what you want your money to do.
Wealth Beyond the Balance Sheet
It is worth saying that wealth is not only a number. For most people the point of money is what it buys beyond things: choices, security and time. Someone with a six-month cushion can leave a bad job, take a risk or care for a family member without panic. Someone with a paid-off home and steady investments can work part time or change careers. In that sense, wealth is optionality, the ability to say yes and no on your own terms, and the numbers are a way to track progress toward it.There is a counter-risk, too. It is possible to chase a number so hard that you forget to live, hoarding for a future that never feels sufficient. The goal is balance: enough saved to be secure and free, enough spent to enjoy the life you are building. Wealthy people, in the best sense, know their number, know their enough and are not driven by comparison with the neighbor in the luxury SUV.
Your independence number depends on your spending, taxes, location, health costs and longevity. The 4% guideline is a rule of thumb, and returns are not guaranteed.
Conclusion
The difference between rich and wealthy could change your financial future because it changes what you chase. Rich is a paycheck and a lifestyle. Wealthy is assets, cash flow and freedom. The data show how far apart they can be: in a 2026 Goldman Sachs survey, between about 34% and 41% of households earning $300,000 or more said they live paycheck to paycheck, while the typical US household has a net worth of about $192,900, and about 23.6 million Americans are millionaires, most of whom, in one survey, received no inheritance.Measure your net worth, savings rate, runway and independence number. In my illustration, Ben, who earns a third as much as Maya but saves three times as much, ends up with three times the net worth after 20 years and reaches his target in about half the time. Automate your savings, send half of every raise to your future, avoid expensive debt, invest cheaply and keep your lifestyle below your means. You can look rich in a day. Becoming wealthy takes years, but it is available to people of ordinary income who choose it. This is general education, not personalized advice.
Frequently Asked Questions
What is the difference between rich and wealthy?Rich usually describes income and the lifestyle it supports; wealthy describes the assets you own and the freedom they buy. A person can earn $300,000 and spend nearly all of it, which looks rich, while another earns $75,000, saves a quarter of it and invests it, which builds wealth. This is a definition I use for clarity rather than a legal or official one.
Can you be rich but not wealthy?
Yes, and it is common. Goldman Sachs Asset Management’s 2026 retirement survey found that more than a third of households earning over $500,000 say they live paycheck to paycheck, and other coverage of the same report put the share closer to 40%. High income without savings and investments leaves you exposed if the paycheck stops.
How do I know if I am wealthy?
Look at four measures: net worth, savings rate, runway (how many months of spending your liquid savings could cover) and income coverage (how much of your spending your assets could fund). A common rule of thumb says you can sustain spending of about 4% of your investments a year, so assets of about 25 times your annual spending would cover it. These are guidelines, not guarantees.
What is the average net worth in the US?
The Federal Reserve’s 2022 Survey of Consumer Finances, the most recent complete data I found, shows a median household net worth of about $192,900 and a mean of about $1,063,700. The mean is about 5.5 times the median because very large fortunes pull it up. The median ranged from about $39,000 for households under 35 to about $410,000 for ages 65 to 74.
How can I become wealthy on an ordinary income?
Save a meaningful share of income, invest it in low-cost, diversified funds, avoid expensive debt and let time work. In my illustration, saving $15,000 a year for 20 years at a constant 7% grows to about $615,000. About 79% of millionaires in one survey received no inheritance, which suggests ordinary paths exist. This is general education, not personal advice.
0 Comments
Be the first to share your thoughts on this article.