

Taxes
Tax Bracket vs. Tax Rate: Do You Know the Difference?

Seven brackets (10% to 37%); single filers pay 10% up to $12,400, 12% to $50,400, 22% to $105,700, 24% to $201,775; married couples filing jointly pay 10% to $24,800, 12% to $100,800, 22% to $211,400, 24% to $403,550; standard deduction $16,100 single and $32,200 joint; Social Security wage cap $184,500. The national picture (IRS, tax year 2023): average income tax rate 14.1%; top 1% (AGI of $675,602 and above) 26.3%; bottom half 3.7%; the top 1% earned 20.6% of AGI and paid 38.4% of income taxes. My arithmetic (single filer, standard deduction): $90,000 of income is in the 22% bracket but costs $10,970, an effective 12.2% of gross income (14.8% of taxable income); only 31.8% of taxable income is taxed at 22%; a $5,000 raise costs $1,100 of tax; $40,000 pays 6.6%, $150,000 pays 16.5% and $250,000 pays 20.5%; a $6,000 401(k) contribution saves $1,320.
The truth is simpler and more comforting. The US uses a progressive system in which each slice of your income is taxed at its own rate, so your bracket describes only the rate on your last dollars while your overall rate is lower. This guide explains the difference with the 2026 numbers, worked examples, national data and a few real exceptions.
Think of a set of buckets: you fill the first at 10%, and when it is full the next dollars go into the 12% bucket, and so on; income in a lower bucket is never retaxed at a higher rate. The standard deduction comes first: $16,100 for single filers, $32,200 for joint filers and $24,150 for heads of household in 2026. The 37% rate applies only above $640,600 for single filers and $768,700 for joint filers, according to one source, a level most households never reach.
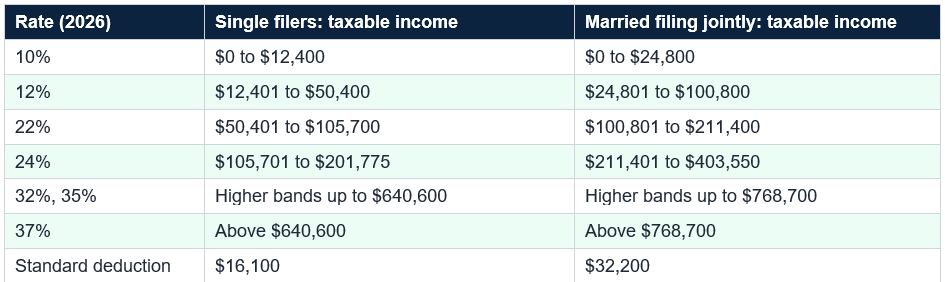
2026: seven rates from 10% to 37%. Single: 10% to $12,400, 12% to $50,400, 22% to $105,700, 24% to $201,775. Married filing jointly: 10% to $24,800, 12% to $100,800, 22% to $211,400, 24% to $403,550. Standard deduction $16,100 single, $32,200 joint. Rates apply to taxable income, after deductions.
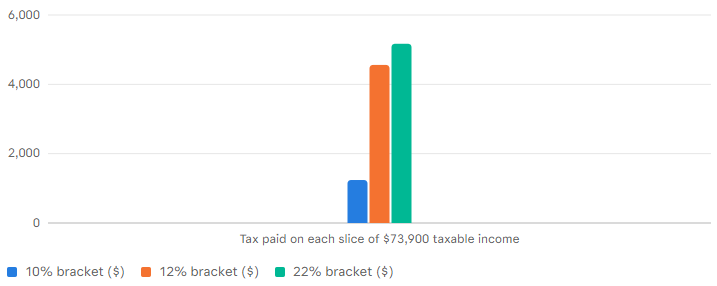
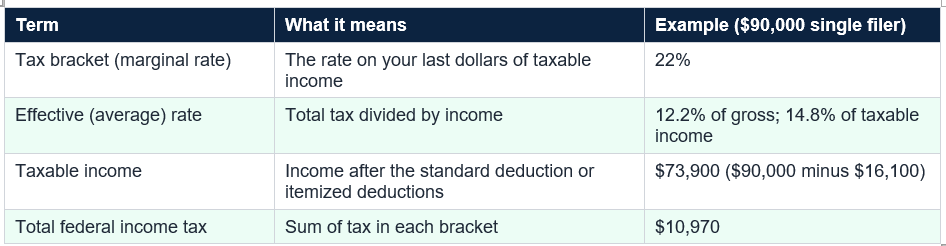
This person is in the 22% bracket, but only $23,500 of their $73,900 of taxable income, 31.8%, is taxed at 22%, with 16.8% taxed at 10% and 51.4% at 12%. The effective rate is 14.8% of taxable income and 12.2% of gross income, the gap between what people think they pay, 22%, and what they pay. This excludes payroll and state taxes, covered below.
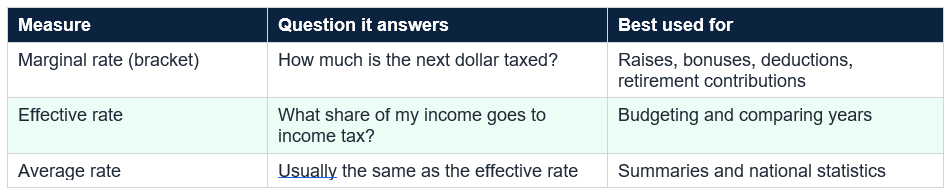
Each answers a different question. The effective rate shows how much of your income goes to federal income tax overall, useful for budgeting and comparing years. The marginal rate shows how much of an extra dollar (overtime, a bonus, a retirement contribution or a deduction) will be taxed or saved, useful for decisions. Budgeting with the marginal rate overestimates your tax; using the effective rate for a bonus underestimates it.
In both cases the raise leaves the person better off. Crossing a threshold changes the rate only on the dollars above it: in my arithmetic, a taxable income of $105,701 owes just 24 cents more than $105,700. There is no “cliff” in the bracket system itself; cases where a raise reduces what you keep come from other rules, such as credits and benefits that phase out as income rises, discussed below.
Crossing into a higher bracket never reduces your take-home pay by itself, because only the dollars above the threshold are taxed at the higher rate. Real exceptions come from benefits, credits and deductions that phase out as income rises.
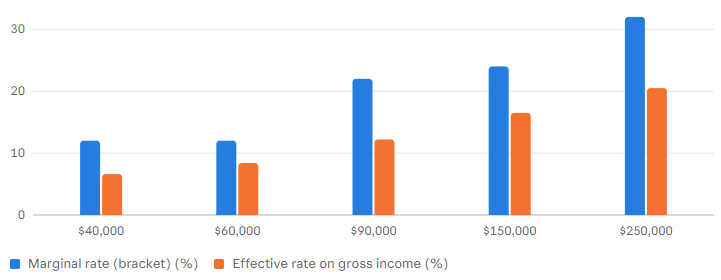
Seeing several incomes side by side shows how big the gap can be. For a single filer using the standard deduction, $40,000 of income is in the 12% bracket but costs $2,620, an effective 6.6% of gross income; at $60,000 the effective rate is 8.4%; at $90,000, 12.2% (22% bracket); at $150,000, 16.5% (24% bracket); and at $250,000, 20.5% (32% bracket).
The effective rate is always below the bracket. Even at $250,000, with 32% on the last dollars, the average is 20.5%, because each earlier slice is taxed at lower rates and the first $16,100 is untaxed. These numbers are federal income tax only, for wage income and without credits or other deductions, so your own figures will differ.
At $300,000 of income, taxable income is $267,800, in the 24% bracket, and the tax is about $49,468, or 16.5% of gross income. A couple’s rate is lower than a single filer’s at the same total income because the joint brackets are about twice as wide. Actual outcomes depend on children, credits, itemized deductions and other income, none of which these simplified examples include.
Single filer, $90,000 income: taxable $73,900; tax $10,970 = 12.2% of gross, though the bracket is 22%. Married couple, $150,000: tax $15,340 = 10.2% of gross, bracket 22%. A $5,000 raise at 22% costs $1,100 and leaves $3,900.
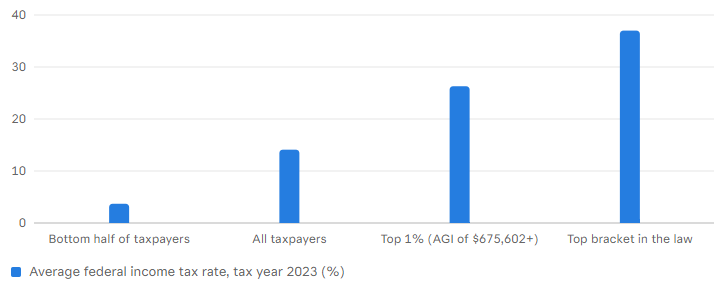
The data also show how progressive the system is: the top 1% earned 20.6% of total AGI and paid 38.4% of federal income taxes, while the bottom half earned 12.3% and paid 3.3%, per the Tax Foundation. Sources differ: one site labels the 3.3% share of taxes as a rate and another cites a 14.9% average, which conflicts with the Tax Foundation’s 14.1%, so I use the latter. These figures exclude payroll taxes and are for 2023, not 2026.
State and local income, sales and property taxes also matter and vary widely. Long-term capital gains and qualified dividends have their own, generally lower rates (general knowledge), so a high bracket does not apply to all income types. And there are real exceptions to “more income never costs you”: credits and benefits that phase out can create a higher effective marginal rate in some ranges, and the SALT deduction cap phases down above $505,000 of income. If you are near such a threshold, check the details.
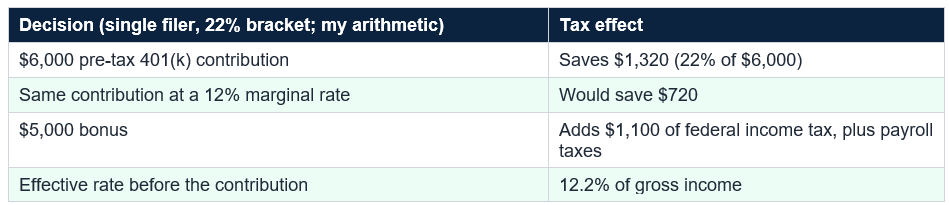
It works in the other direction too: a $5,000 bonus is taxed at your marginal rate, costing $1,100 of federal income tax for the filer above, plus payroll taxes. The marginal rate also matters for choosing between traditional and Roth accounts, which depends partly on whether your rate now will be higher or lower than in retirement, something I cannot predict.
Find your taxable income on your last Form 1040, look up your bracket in the table above and calculate your effective rate by dividing your total tax by your income. Then use the marginal rate for any decision about extra income or deductions. Common mistakes include believing all income is taxed at your top bracket, turning down a raise or overtime for fear of the next bracket, confusing gross with taxable income, using the marginal rate to estimate total tax, ignoring payroll and state taxes, assuming a deduction saves a dollar for dollar instead of your marginal rate and forgetting that phase-outs can create real thresholds.
The national data agree: the average federal income tax rate was 14.1% in tax year 2023, with 26.3% for the top 1% and 3.7% for the bottom half. Use your effective rate to understand your overall burden and your marginal rate to make decisions, such as a $6,000 pre-tax 401(k) contribution saving $1,320 at 22%, and remember payroll and state taxes and phase-outs.
Your tax bracket, or marginal rate, is the rate applied to the last dollars you earn. Your tax rate, usually called the effective or average rate, is your total tax divided by your income. Because US income tax is progressive, each slice of income is taxed at its own rate, so your effective rate is lower than your bracket. A single filer with $90,000 of income is in the 22% bracket but pays about 12.2% of gross income in federal income tax, in my example.
If I get a raise that pushes me into a higher bracket, will I take home less?
No. Only the dollars above the bracket threshold are taxed at the higher rate. In my example, a single filer with $105,000 of taxable income who earns $2,000 more pays about $466 of extra tax and keeps about $1,534, rather than losing money. Take-home pay can fall in rare cases because of benefit phase-outs or credits that disappear, which are separate from the bracket system.
How do I calculate my effective tax rate?
Divide your total federal income tax by your income. You can use gross income, as I do in most examples, or taxable income, which gives a higher percentage. The tax line on your Form 1040 and your total income are the starting points. Remember that payroll taxes for Social Security and Medicare, state income taxes and sales taxes are separate and add to your overall burden.
What is the average effective tax rate in the US?
According to IRS data for tax year 2023 as summarized by the Tax Foundation, the average federal income tax rate was 14.1%. The top 1% of taxpayers paid an average of 26.3%, while the bottom half paid 3.7%. These figures count income tax only and exclude payroll taxes. One site I found labels the bottom half’s 3.3% share of all taxes as a rate, which is a different measure.
Should I use my marginal rate or my effective rate when making decisions?
Use the marginal rate for decisions about additional income or deductions, since the next dollar is taxed at that rate. For example, a $6,000 pre-tax 401(k) contribution saves about $1,320 for a single filer in the 22% bracket. Use your effective rate to understand your overall tax burden and to compare years. This is general education, not personal tax advice.
Table of Contents
- The Fear of the Higher Bracket
- The Short Answer
- How the 2026 Brackets Work
- A Worked Example: $90,000 of Income
- Marginal vs. Effective vs. Average
- What Happens When You Get a Raise
- The Rate You Pay at Different Incomes
- A Married Couple’s Example
- What the National Data Show
- Taxes Beyond Federal Income Tax
- Using Your Marginal Rate to Decide
- Common Mistakes
- Conclusion
- Frequently Asked Questions
Your bracket is not your rate: marginal vs. effective federal income tax rate, single filer, 2026 (%)
Tax rate (%) by Author's arithmetic using the 2026 brackets (IRS Rev. Proc. 2025-32 via the Tax Foundation) and the $16,100 standard deduction; wage income only, no credits, payroll or state taxes; illustrations, not your tax
How $10,970 of tax is built: tax in each bracket for a single filer earning $90,000 ($)
Tax ($) by Author's arithmetic, 2026 brackets and $16,100 standard deduction: $12,400 at 10% = $1,240; $38,000 at 12% = $4,560; $23,500 at 22% = $5,170; only 31.8% of taxable income is taxed at the 22% rate
The national picture: average income tax rates vs. the 37% top bracket (%)
Rate (%) by IRS Statistics of Income, tax year 2023, as summarized by the Tax Foundation (income tax only, excludes payroll taxes); the 37% top rate is the statutory bracket and applies only above $640,600 for single filers in 2026
The Fear of the Higher Bracket
It is one of the most common money fears: a raise, a bonus or a second job will push you into a higher tax bracket, and suddenly you will take home less. People turn down overtime and delay income over the word “bracket.” The fear is understandable, because “you are in the 24% bracket” sounds like all of your income is taxed at 24%. It is not.The truth is simpler and more comforting. The US uses a progressive system in which each slice of your income is taxed at its own rate, so your bracket describes only the rate on your last dollars while your overall rate is lower. This guide explains the difference with the 2026 numbers, worked examples, national data and a few real exceptions.
The Short Answer
Your tax bracket, or marginal rate, is the rate applied to the top slice of your income. Your tax rate, usually called your effective or average rate, is your total tax divided by your income. Because only the income above each threshold is taxed at the higher rate, your effective rate is always lower than your bracket: in my example, a single filer with $90,000 of income is in the 22% bracket but pays $10,970 of federal income tax, about 12.2% of gross income. A raise that pushes you into the next bracket taxes only the extra dollars at the higher rate, so earning more never leaves you with less.
How the 2026 Brackets Work
For 2026, federal income tax has seven rates (10%, 12%, 22%, 24%, 32%, 35% and 37%), according to the Tax Foundation citing IRS Revenue Procedure 2025-32. They apply to taxable income, your income after deductions, not your gross salary. A single filer pays 10% on the first $12,400, 12% up to $50,400, 22% up to $105,700 and 24% up to $201,775; married couples filing jointly have wider bands: 10% up to $24,800, 12% up to $100,800, 22% up to $211,400 and 24% up to $403,550.Think of a set of buckets: you fill the first at 10%, and when it is full the next dollars go into the 12% bucket, and so on; income in a lower bucket is never retaxed at a higher rate. The standard deduction comes first: $16,100 for single filers, $32,200 for joint filers and $24,150 for heads of household in 2026. The 37% rate applies only above $640,600 for single filers and $768,700 for joint filers, according to one source, a level most households never reach.
2026: seven rates from 10% to 37%. Single: 10% to $12,400, 12% to $50,400, 22% to $105,700, 24% to $201,775. Married filing jointly: 10% to $24,800, 12% to $100,800, 22% to $211,400, 24% to $403,550. Standard deduction $16,100 single, $32,200 joint. Rates apply to taxable income, after deductions.
A Worked Example: $90,000 of Income
Take a single filer earning $90,000 in wages, with the standard deduction. Taxable income is $90,000 minus $16,100, or $73,900. The first $12,400 is taxed at 10% ($1,240), the next $38,000 at 12% ($4,560) and the remaining $23,500 at 22% ($5,170), for total federal income tax of $10,970 in my arithmetic.This person is in the 22% bracket, but only $23,500 of their $73,900 of taxable income, 31.8%, is taxed at 22%, with 16.8% taxed at 10% and 51.4% at 12%. The effective rate is 14.8% of taxable income and 12.2% of gross income, the gap between what people think they pay, 22%, and what they pay. This excludes payroll and state taxes, covered below.
Marginal vs. Effective vs. Average
These terms are easy to confuse. The marginal rate is the rate on your next dollar of taxable income, the same as your bracket. The effective rate is total tax divided by income, calculated on gross or taxable income, so always say which, and the average rate is often a synonym. “What tax rate do I pay” usually means the effective rate; “what bracket am I in” means the marginal rate.Each answers a different question. The effective rate shows how much of your income goes to federal income tax overall, useful for budgeting and comparing years. The marginal rate shows how much of an extra dollar (overtime, a bonus, a retirement contribution or a deduction) will be taxed or saved, useful for decisions. Budgeting with the marginal rate overestimates your tax; using the effective rate for a bonus underestimates it.
What Happens When You Get a Raise
Here is the scenario people dread. Our single filer with $73,900 of taxable income gets a $5,000 raise. All $5,000 falls in the 22% bracket, so the extra federal income tax is $1,100 and the filer keeps $3,900, before payroll taxes. Now suppose a filer with $105,000 of taxable income, just below the $105,700 threshold of the 24% bracket, gets a $2,000 raise: the first $700 is taxed at 22% ($154) and the remaining $1,300 at 24% ($312), for $466 of extra tax and $1,534 kept.In both cases the raise leaves the person better off. Crossing a threshold changes the rate only on the dollars above it: in my arithmetic, a taxable income of $105,701 owes just 24 cents more than $105,700. There is no “cliff” in the bracket system itself; cases where a raise reduces what you keep come from other rules, such as credits and benefits that phase out as income rises, discussed below.
Crossing into a higher bracket never reduces your take-home pay by itself, because only the dollars above the threshold are taxed at the higher rate. Real exceptions come from benefits, credits and deductions that phase out as income rises.
Seeing several incomes side by side shows how big the gap can be. For a single filer using the standard deduction, $40,000 of income is in the 12% bracket but costs $2,620, an effective 6.6% of gross income; at $60,000 the effective rate is 8.4%; at $90,000, 12.2% (22% bracket); at $150,000, 16.5% (24% bracket); and at $250,000, 20.5% (32% bracket).
The effective rate is always below the bracket. Even at $250,000, with 32% on the last dollars, the average is 20.5%, because each earlier slice is taxed at lower rates and the first $16,100 is untaxed. These numbers are federal income tax only, for wage income and without credits or other deductions, so your own figures will differ.
A Married Couple’s Example
The same logic applies to couples, with wider brackets and a bigger standard deduction. A married couple filing jointly with $150,000 of income has taxable income of $117,800 after the $32,200 deduction. The first $24,800 is taxed at 10% ($2,480), the next $76,000 at 12% ($9,120) and the remaining $17,000 at 22% ($3,740). Total tax is $15,340 in my arithmetic, an effective 10.2% of gross income, though they are in the 22% bracket.At $300,000 of income, taxable income is $267,800, in the 24% bracket, and the tax is about $49,468, or 16.5% of gross income. A couple’s rate is lower than a single filer’s at the same total income because the joint brackets are about twice as wide. Actual outcomes depend on children, credits, itemized deductions and other income, none of which these simplified examples include.
Single filer, $90,000 income: taxable $73,900; tax $10,970 = 12.2% of gross, though the bracket is 22%. Married couple, $150,000: tax $15,340 = 10.2% of gross, bracket 22%. A $5,000 raise at 22% costs $1,100 and leaves $3,900.
What the National Data Show
The national statistics tell the same story. According to IRS data for tax year 2023, summarized by the Tax Foundation, the average federal income tax rate was 14.1% across all taxpayers. The top 1% (adjusted gross income of $675,602 or more) paid an average of 26.3% and the bottom half 3.7%. Even the top earners’ average sits well below the 37% top bracket, the effective-versus-marginal gap at national scale.The data also show how progressive the system is: the top 1% earned 20.6% of total AGI and paid 38.4% of federal income taxes, while the bottom half earned 12.3% and paid 3.3%, per the Tax Foundation. Sources differ: one site labels the 3.3% share of taxes as a rate and another cites a 14.9% average, which conflicts with the Tax Foundation’s 14.1%, so I use the latter. These figures exclude payroll taxes and are for 2023, not 2026.
Taxes Beyond Federal Income Tax
Federal income tax is only one layer. Payroll taxes for Social Security and Medicare are, in my general knowledge, 7.65% of wages for employees, with the Social Security part applying only up to a wage cap ($184,500 in 2026). On $90,000 of wages that is $6,885; added to the $10,970 of income tax it gives $17,855, or 19.8% of gross income, before any state income tax.State and local income, sales and property taxes also matter and vary widely. Long-term capital gains and qualified dividends have their own, generally lower rates (general knowledge), so a high bracket does not apply to all income types. And there are real exceptions to “more income never costs you”: credits and benefits that phase out can create a higher effective marginal rate in some ranges, and the SALT deduction cap phases down above $505,000 of income. If you are near such a threshold, check the details.
Using Your Marginal Rate to Decide
Your marginal rate is the value of a deduction or a pre-tax contribution. Our single filer in the 22% bracket who puts $6,000 into a traditional 401(k) lowers taxable income from $73,900 to $67,900 and cuts federal income tax from $10,970 to $9,650, a saving of $1,320, exactly 22% of $6,000; a filer in the 12% bracket would save $720. The higher your bracket, the more a pre-tax contribution or deduction is worth.It works in the other direction too: a $5,000 bonus is taxed at your marginal rate, costing $1,100 of federal income tax for the filer above, plus payroll taxes. The marginal rate also matters for choosing between traditional and Roth accounts, which depends partly on whether your rate now will be higher or lower than in retirement, something I cannot predict.
Find your taxable income on your last Form 1040, look up your bracket in the table above and calculate your effective rate by dividing your total tax by your income. Then use the marginal rate for any decision about extra income or deductions. Common mistakes include believing all income is taxed at your top bracket, turning down a raise or overtime for fear of the next bracket, confusing gross with taxable income, using the marginal rate to estimate total tax, ignoring payroll and state taxes, assuming a deduction saves a dollar for dollar instead of your marginal rate and forgetting that phase-outs can create real thresholds.
Conclusion
Your tax bracket and your tax rate are different things. The bracket, or marginal rate, is the rate on your last dollars of taxable income; the effective rate is your total tax divided by your income, and it is always lower. In 2026, a single filer earning $90,000 is in the 22% bracket but pays $10,970, or 12.2% of gross income, with only 31.8% of taxable income taxed at 22%. A raise never reduces your take-home pay by itself: a $5,000 raise costs $1,100 of federal income tax and leaves $3,900.The national data agree: the average federal income tax rate was 14.1% in tax year 2023, with 26.3% for the top 1% and 3.7% for the bottom half. Use your effective rate to understand your overall burden and your marginal rate to make decisions, such as a $6,000 pre-tax 401(k) contribution saving $1,320 at 22%, and remember payroll and state taxes and phase-outs.
Frequently Asked Questions
What is the difference between a tax bracket and a tax rate?Your tax bracket, or marginal rate, is the rate applied to the last dollars you earn. Your tax rate, usually called the effective or average rate, is your total tax divided by your income. Because US income tax is progressive, each slice of income is taxed at its own rate, so your effective rate is lower than your bracket. A single filer with $90,000 of income is in the 22% bracket but pays about 12.2% of gross income in federal income tax, in my example.
If I get a raise that pushes me into a higher bracket, will I take home less?
No. Only the dollars above the bracket threshold are taxed at the higher rate. In my example, a single filer with $105,000 of taxable income who earns $2,000 more pays about $466 of extra tax and keeps about $1,534, rather than losing money. Take-home pay can fall in rare cases because of benefit phase-outs or credits that disappear, which are separate from the bracket system.
How do I calculate my effective tax rate?
Divide your total federal income tax by your income. You can use gross income, as I do in most examples, or taxable income, which gives a higher percentage. The tax line on your Form 1040 and your total income are the starting points. Remember that payroll taxes for Social Security and Medicare, state income taxes and sales taxes are separate and add to your overall burden.
What is the average effective tax rate in the US?
According to IRS data for tax year 2023 as summarized by the Tax Foundation, the average federal income tax rate was 14.1%. The top 1% of taxpayers paid an average of 26.3%, while the bottom half paid 3.7%. These figures count income tax only and exclude payroll taxes. One site I found labels the bottom half’s 3.3% share of all taxes as a rate, which is a different measure.
Should I use my marginal rate or my effective rate when making decisions?
Use the marginal rate for decisions about additional income or deductions, since the next dollar is taxed at that rate. For example, a $6,000 pre-tax 401(k) contribution saves about $1,320 for a single filer in the 22% bracket. Use your effective rate to understand your overall tax burden and to compare years. This is general education, not personal tax advice.
0 Comments
Be the first to share your thoughts on this article.