

Investing
The Diversification Mistake That Could Cost You Money

65% of self-directed investors had zero international allocation (Vanguard). IVV and EFA move together 80-90% of the time. CFA Institute: risk reduction is negligible beyond 30 holdings. More funds ≠ more diversification. Diversification has been called the only free lunch in investing. It is the one strategy that, when applied correctly, reduces risk without proportionally reducing expected return. The problem is not whether diversification works. It demonstrably does. The problem is that most investors are not actually doing it. They think they are diversified because they own multiple funds, hold stocks in different sectors, or have a portfolio with an impressive array of tickers. But a portfolio can look diversified on paper while being genuinely concentrated underneath. The CFA Institute research cited by PortfolioPilot is specific: the incremental risk reduction becomes negligible beyond 20-30 holdings, yet many investors hold 100 securities or more, often duplicating the same exposure under different names. Vanguard research found that 65% of self-directed investors had no international allocation at all before receiving advice. And experimental economic research from the University of Göttingen found that correlation neglect — the failure to account for how assets move together — is the single strongest driver of suboptimal diversification decisions. This article covers the five most common and most costly diversification mistakes, the specific research behind each one, and the concrete fix for each.
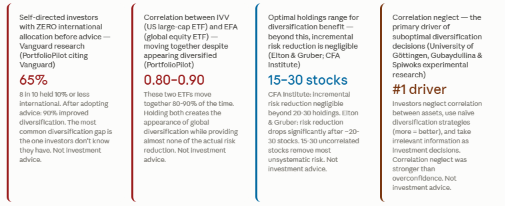
Yale/Goetzmann & Kumar: vast majority of 40,000+ investors were under-diversified. Young and active investors held least diversified portfolios. University of Göttingen/Gubaydullina & Spiwoks: correlation neglect is the strongest driver of suboptimal diversification. Morningstar 2025: the lower the correlation, the greater the volatility reduction from adding an asset. Not investment advice.
Holding 100+ securities and overlapping funds that move together. The CFA Institute finds incremental risk reduction becomes negligible beyond 20-30 holdings. IVV and EFA have 0.80-0.90 correlation — both are essentially 'US and global equities moving together. Count your actual distinct economic exposures, not your number of tickers. If ten of your funds all track US large-cap equities, you have one diversification unit — not ten. The goal is 15-30 holdings with low correlation to each other. Research suggests this range captures most of the available diversification benefit. Elton & Gruber: risk-reduction benefit drops significantly after 20-30 holdings (HeyGoTrade citing Elton & Gruber). CFA Institute: incremental risk reduction negligible beyond 20-30 securities yet many hold 100+ (PortfolioPilot). IVV-EFA correlation: 0.80-0.90 (PortfolioPilot). 15-30 uncorrelated stocks removes most unsystematic risk (PortfolioPilot; HeyGoTrade).
Assuming yesterday's correlation holds tomorrow. In 2022, both stocks AND bonds fell — the traditional negative correlation failed. IVV and EFA move together 80-90% of the time despite appearing diversified. Check correlation between all significant portfolio holdings — not just between asset classes. Use free tools like PortfolioPilot's correlation matrix. Review correlations at least annually and after major market regime changes (rate hike cycles, geopolitical shocks).
University of Göttingen (Gubaydullina & Spiwoks): correlation neglect is the strongest driver of suboptimal diversification decisions. Morningstar 2025: correlation coefficients shift over time. PortfolioPilot/Barclays: during stressed periods, correlations often rise — reducing expected diversification benefit precisely when it is most needed.
65% of self-directed investors had zero international allocation before advice (Vanguard via PortfolioPilot). 80% held 10% or less international. Concentrating entirely in the domestic market bets on one economy, one currency, and one policy environment. Check your actual international allocation — not the international-sounding names of funds. True international diversification means holding assets that respond to different economies, currencies, and growth cycles. The Vanguard finding that 90% of investors improved after advice suggests professional review can reveal gaps that are invisible to the individual investor. Vanguard (via PortfolioPilot): 65% of self-directed investors had no international allocation before advice. 80% held 10% or less. After advice: 90% improved diversification. HeyGoTrade: 'No single market outperforms all others over every period.' Morningstar 2025: international diversification remains valuable despite recent US outperformance.
Owning four 'different' funds that all hold the same mega-cap tech stocks. A portfolio with a technology ETF + Nasdaq ETF + growth ETF + S&P 500 fund is likely 40%+ in the same 10 companies. Appears diversified. Is concentrated. Look at the top 10 holdings of every fund you own and aggregate them. If the same 5-10 companies appear in most of your funds, your diversification is illusory at the position level. Use overlap-checking tools or ask your adviser to run a holdings-level analysis. PortfolioPilot: a seemingly diversified portfolio can have 85%+ of its risk still coming from equities in practice. Brinson-Hood-Beebower research: asset allocation explains the majority of portfolio behaviour over long periods. S&P 500 is approximately 30%+ technology sector as of 2025-2026.
A 60/40 portfolio that runs unreviewed for 5 years during a bull market can silently become 80/20 or 90/10. The investor thinks they are diversified. Their portfolio is now concentrated. They discover this during the next correction. Review portfolio allocation at least annually — compare current weights to intended weights. Rebalance when any asset class drifts more than 5-10% from its target. This discipline prevents diversification decay and has the additional benefit of systematically selling high and buying low. PortfolioPilot: 'Over time, exposure drifts.' Morningstar 2025: correlation between assets shifts sometimes over multiyear periods — regular review essential. PortfolioPilot recommendation: quarterly portfolio review at minimum. Rebalancing resets diversification to intended levels.
The research is consistent: 15 to 30 genuinely uncorrelated holdings removes most unsystematic (company-specific) risk. HeyGoTrade cites the Elton and Gruber research showing the risk-reduction benefit drops significantly after approximately 20-30 stocks. The CFA Institute finding, cited by PortfolioPilot, is specific: incremental risk reduction becomes negligible beyond this range. Beyond 30 holdings, adding more does not meaningfully reduce risk — it adds complexity, potential overlap, and in some cases fees. The critical qualifier is 'genuinely uncorrelated.' Twenty funds that all track US large-cap equities do not constitute 20 diversification units. They constitute one.
What is correlation and why does it matter for diversification?
Correlation is the statistical measure of how two assets move in relation to each other. A correlation of 1.0 means they move in perfect lockstep. A correlation of 0 means they are statistically independent. A correlation of -1.0 means they move in perfect opposition. Morningstar's 2025 Diversification Landscape explains the mathematical principle: the lower the correlation between assets, the greater the reduction in portfolio volatility from combining them. Two assets with -0.5 correlation provide substantially more diversification benefit than two assets with +0.9 correlation, regardless of how different their names sound. University of Göttingen researchers found correlation neglect is the strongest driver of suboptimal diversification — investors consistently ignore this when building portfolios.
Is it possible to be over-diversified?
Yes, and it is more common than under-diversification among retail investors who follow general advice to 'spread investments widely.' HeyGoTrade's diversification myths analysis explains: over-diversification beyond 20-30 stocks dilutes returns without meaningful risk reduction. PortfolioPilot adds: 'Over-diversification can lead to index-like returns without the benefit of real control. Too many assets = complexity, overlap, and hidden correlation.' When you hold 100 securities that all move together, you have created the costs and complexity of a large portfolio while capturing the diversification benefit of a much smaller one.
What happened to stock-bond diversification in 2022?
The 2022 rate-hike cycle produced one of the clearest recent demonstrations that correlation between assets is not fixed. PortfolioPilot's common diversification mistakes analysis explains: during 2022, both stocks and bonds declined — a reversal of the traditional negative correlation between the two asset classes that had been reliable for most of the previous 40 years. Investors who believed a stock-and-bond portfolio was reliably diversified experienced losses in both components simultaneously. Morningstar's 2025 research warns directly: 'Correlation coefficients shift over time, so what worked in the past won't necessarily work in the future.' The lesson: always review the current correlation, not the assumed historical one.
How often should I review my portfolio's diversification?
PortfolioPilot's guidance recommends at minimum a quarterly review of portfolio exposures, with specific attention to concentration, correlation, and whether allocations have drifted from their intended targets. Morningstar's 2025 Diversification Landscape notes that correlation can shift over multiyear periods, making the annual review a necessary minimum rather than an optional exercise. A practical rule: review after any major market regime change (rate hike cycles, geopolitical shocks, major sector dislocations), and at least annually in stable conditions. Rebalance when any asset class has drifted more than 5-10% from its intended weight.
Table of Contents
- Why Most Investors Are Not Actually Diversified
- Mistake 1 Owning More Funds Does Not Mean Better Diversification
- Mistake 2 Ignoring Correlation — The Most Expensive Oversight
- Mistake 3 Domestic Bias — The Invisible Concentration Risk
- Mistake 4 Sector Overlap — The Hidden Concentration You Cannot See
- Mistake 5 Treating Diversification as Fixed — The Drift Problem
- The Diversification Checklist: Five Questions Every Portfolio Needs
- Conclusion: Fewer, Better-Chosen, Genuinely Uncorrelated
- Frequently Asked Questions
Why Most Investors Are Not Actually Diversified
The Yale School of Management study by Goetzmann and Kumar, examining over 40,000 equity investment accounts over a six-year period, found that the vast majority of investors in the sample were under-diversified. The research identified a clear pattern: young and active investors, and those in lower-income and non-professional categories, held the least diversified portfolios. But under-diversification — holding too few genuinely uncorrelated assets — is only half the problem. The other half is its opposite: the illusion of diversification, where investors hold many assets that all move together and therefore provide no actual risk reduction despite appearing varied. Morningstar’s 2025 Diversification Landscape report, published in April 2025, frames the foundational principle: diversification has often been called the only free lunch in investing, because it can reduce portfolio volatility without proportionally reducing expected return. But that free lunch is only available when the holdings are genuinely uncorrelated. University of Göttingen researchers Gubaydullina and Spiwoks identified the root cause of most diversification failures: correlation neglect — the systematic tendency of investors to ignore how assets move together when constructing portfolios, using naïve strategies based on the number of holdings rather than their actual statistical relationship. What follows is a five-mistake breakdown of how this plays out in practice, with the specific cost and the specific fix for each.Yale/Goetzmann & Kumar: vast majority of 40,000+ investors were under-diversified. Young and active investors held least diversified portfolios. University of Göttingen/Gubaydullina & Spiwoks: correlation neglect is the strongest driver of suboptimal diversification. Morningstar 2025: the lower the correlation, the greater the volatility reduction from adding an asset. Not investment advice.
Mistake 1 Owning More Funds Does Not Mean Better Diversification
The most widespread diversification mistake is a conceptual one: the belief that the more funds and securities you own, the more diversified you are. It is intuitive. It is also wrong, and the research demonstrating its wrongness goes back decades. The foundational work by Elton and Gruber, cited by HeyGoTrade’s 2025 analysis of diversification myths, showed that the risk-reduction benefit of adding stocks drops significantly after approximately twenty to thirty holdings. The CFA Institute research cited by PortfolioPilot confirms the same finding: ‘The incremental reduction in risk becomes negligible after this range — yet many investors still hold 100+ securities and overlapping funds, often duplicating exposure without improving diversification.’ The mechanism behind this is important to understand. Diversification works by combining assets that do not move together. When one falls, another holds steady or rises, smoothing the overall portfolio. But if all the assets in a ‘diversified’ portfolio are responding to the same economic forces — all US equities, for example — adding more of them does not reduce the risk that matters. You can own twenty large-cap US equity ETFs with different names and still have a portfolio with essentially the same risk profile as owning one. PortfolioPilot’s AI adviser analysis identifies the hidden correlation problem directly: a large-cap US ETF (IVV) and a global equity ETF (EFA) typically share a correlation of 0.80-0.90 over multi-year periods. These move together 80-90% of the time. Holding both creates the appearance of global diversification while providing almost none of the actual risk reduction. Over-diversification, as HeyGoTrade’s research summary notes, ‘dilutes your best ideas, increases portfolio complexity, and can result in index-like returns with higher costs.Holding 100+ securities and overlapping funds that move together. The CFA Institute finds incremental risk reduction becomes negligible beyond 20-30 holdings. IVV and EFA have 0.80-0.90 correlation — both are essentially 'US and global equities moving together. Count your actual distinct economic exposures, not your number of tickers. If ten of your funds all track US large-cap equities, you have one diversification unit — not ten. The goal is 15-30 holdings with low correlation to each other. Research suggests this range captures most of the available diversification benefit. Elton & Gruber: risk-reduction benefit drops significantly after 20-30 holdings (HeyGoTrade citing Elton & Gruber). CFA Institute: incremental risk reduction negligible beyond 20-30 securities yet many hold 100+ (PortfolioPilot). IVV-EFA correlation: 0.80-0.90 (PortfolioPilot). 15-30 uncorrelated stocks removes most unsystematic risk (PortfolioPilot; HeyGoTrade).
Mistake 2 Ignoring Correlation — The Most Expensive Oversight
Correlation is the statistical heart of diversification. A correlation coefficient of 1.0 means two assets move in perfect lockstep. A coefficient of 0 means they move independently. A coefficient of -1.0 means they move in perfect opposition. The mathematical benefit of diversification — reducing portfolio volatility without proportionally reducing expected return — comes entirely from low or negative correlation between holdings. As Morningstar’s 2025 Diversification Landscape report frames it: ‘The lower the correlation, the greater the reduction in volatility from adding an asset.’ The university-level academic research confirms what practitioners have been observing in markets. The University of Göttingen experimental study by Gubaydullina and Spiwoks found that investors systematically neglect correlation when making portfolio decisions, instead using naïve diversification strategies and relying on irrelevant information. Correlation neglect was the strongest effect identified in the study. This neglect has a concrete recent cost. PortfolioPilot’s common mistakes analysis identifies the 2022 rate-hike cycle as a textbook example: ‘During the 2022 rate-hike cycle, both stocks and bonds declined — a reversal of the traditional negative stock-bond correlation.’ Investors who believed their stock-and-bond portfolio was diversified because stocks and bonds ‘always’ move in opposite directions discovered in 2022 that correlation is not static. Morningstar’s 2025 research explicitly warns: ‘Correlation coefficients shift over time, so what worked in the past won’t necessarily work in the future.’ During stressed periods, PortfolioPilot notes (citing Barclays research), ‘correlations often rise or turn positive, reducing the diversification benefits investors expected.’ The diversification that was supposed to protect you often provides the least protection at exactly the moment you most need it.Assuming yesterday's correlation holds tomorrow. In 2022, both stocks AND bonds fell — the traditional negative correlation failed. IVV and EFA move together 80-90% of the time despite appearing diversified. Check correlation between all significant portfolio holdings — not just between asset classes. Use free tools like PortfolioPilot's correlation matrix. Review correlations at least annually and after major market regime changes (rate hike cycles, geopolitical shocks).
University of Göttingen (Gubaydullina & Spiwoks): correlation neglect is the strongest driver of suboptimal diversification decisions. Morningstar 2025: correlation coefficients shift over time. PortfolioPilot/Barclays: during stressed periods, correlations often rise — reducing expected diversification benefit precisely when it is most needed.
Mistake 3 Domestic Bias — The Invisible Concentration Risk
The third major diversification mistake is one that most individual investors do not realise they are making, because it is the default position of doing nothing. Vanguard research, cited by PortfolioPilot’s AI financial adviser analysis, found that before adopting professional advice, 65% of self-directed investors had no international allocation at all, and eight in ten held 10% or less in international investments. This is domestic bias — the tendency to overweight the home market far beyond its share of the global opportunity set. For US investors, this bias is particularly ironic: the US market has significantly outperformed international markets over the past decade, which means domestic bias has ‘worked’ in recent years. But HeyGoTrade’s diversification myths analysis is direct: ‘No single market outperforms all others over every period.’ The Morningstar 2025 Diversification Landscape report, published in April 2025, frames the dynamic: ‘Tariff policy announced in April 2025 added massive levels of uncertainty to the investment’ environment globally, altering the relative diversification benefit of international holdings. Concentration in any single market, however historically strong, creates exposure to the risk that it underperforms. The Vanguard finding — that after adopting advice, nearly 90% of previously self-directed investors improved their diversification — suggests that the gap between what investors typically hold and what a well-diversified portfolio looks like is substantial for most people.65% of self-directed investors had zero international allocation before advice (Vanguard via PortfolioPilot). 80% held 10% or less international. Concentrating entirely in the domestic market bets on one economy, one currency, and one policy environment. Check your actual international allocation — not the international-sounding names of funds. True international diversification means holding assets that respond to different economies, currencies, and growth cycles. The Vanguard finding that 90% of investors improved after advice suggests professional review can reveal gaps that are invisible to the individual investor. Vanguard (via PortfolioPilot): 65% of self-directed investors had no international allocation before advice. 80% held 10% or less. After advice: 90% improved diversification. HeyGoTrade: 'No single market outperforms all others over every period.' Morningstar 2025: international diversification remains valuable despite recent US outperformance.
Mistake 4 Sector Overlap — The Hidden Concentration You Cannot See
A portfolio that appears diversified by fund count can be dangerously concentrated at the sector level in ways that are invisible without looking under the hood. PortfolioPilot’s common diversification mistakes analysis identifies sector-based diversification failure directly: ‘Sector-based diversification can fail when assets share the same economic drivers.’ The practical mechanism: if you own a technology ETF, a growth ETF, a Nasdaq-100 ETF, and an S&P 500 index fund, you appear to have four distinct investments. In reality, all four have very large overlapping allocations to the same handful of mega-cap technology companies — Apple, Microsoft, Nvidia, Alphabet, Amazon, Meta. The S&P 500 index fund alone is approximately 30%+ weighted to the technology sector as of 2025-2026. Adding a technology ETF on top of it does not increase diversification — it increases concentration. PortfolioPilot’s AI adviser analysis makes the equity concentration point starkly: a portfolio that appears diversified can have 85%+ of its risk coming from equities in practice, even if the funds have different names and apparently different mandates. The allocation research from Brinson, Hood, and Beebower — cited by PortfolioPilot — shows that asset allocation explains the majority of portfolio behaviour over long periods, including volatility, drawdowns, and recovery paths. The same research demonstrates that it is the allocation across genuinely different economic drivers that matters, not the number of products owned.Owning four 'different' funds that all hold the same mega-cap tech stocks. A portfolio with a technology ETF + Nasdaq ETF + growth ETF + S&P 500 fund is likely 40%+ in the same 10 companies. Appears diversified. Is concentrated. Look at the top 10 holdings of every fund you own and aggregate them. If the same 5-10 companies appear in most of your funds, your diversification is illusory at the position level. Use overlap-checking tools or ask your adviser to run a holdings-level analysis. PortfolioPilot: a seemingly diversified portfolio can have 85%+ of its risk still coming from equities in practice. Brinson-Hood-Beebower research: asset allocation explains the majority of portfolio behaviour over long periods. S&P 500 is approximately 30%+ technology sector as of 2025-2026.
Mistake 5 Treating Diversification as Fixed — The Drift Problem
Even a well-constructed diversified portfolio can become poorly diversified over time without a single deliberate change being made. Portfolio drift — the natural movement of holdings’ weights as different assets grow at different rates — can transform a balanced 60/40 stock/bond portfolio into an 80/20 or 90/10 portfolio over a sustained equity bull market. PortfolioPilot’s common mistakes analysis identifies drift as a distinct diversification failure: ‘Over time, exposure drifts.’ The consequence is that the investor who set up their portfolio with intentional diversification may find, after several years without review, that what they thought was a moderate-risk portfolio has become an equity-heavy one that behaves entirely differently from their original intention during a market downturn. The 2022 rate-hike example cited earlier — where both stocks and bonds fell together — illustrates a related dynamic: not only did individual asset correlations shift, but investors who had not rebalanced found their equity-heavy drifted portfolios took larger losses than a periodically rebalanced portfolio would have. PortfolioPilot’s guidance is practical: ‘Some investors build this into a routine — for example, setting aside time each quarter for a short portfolio review.’ Morningstar’s research explicitly cautions that correlation between assets shifts ‘sometimes over multiyear periods,’ making periodic review essential rather than optional.A 60/40 portfolio that runs unreviewed for 5 years during a bull market can silently become 80/20 or 90/10. The investor thinks they are diversified. Their portfolio is now concentrated. They discover this during the next correction. Review portfolio allocation at least annually — compare current weights to intended weights. Rebalance when any asset class drifts more than 5-10% from its target. This discipline prevents diversification decay and has the additional benefit of systematically selling high and buying low. PortfolioPilot: 'Over time, exposure drifts.' Morningstar 2025: correlation between assets shifts sometimes over multiyear periods — regular review essential. PortfolioPilot recommendation: quarterly portfolio review at minimum. Rebalancing resets diversification to intended levels.
The Diversification Checklist: Five Questions Every Portfolio Needs
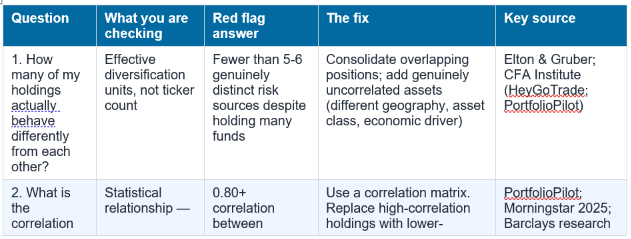
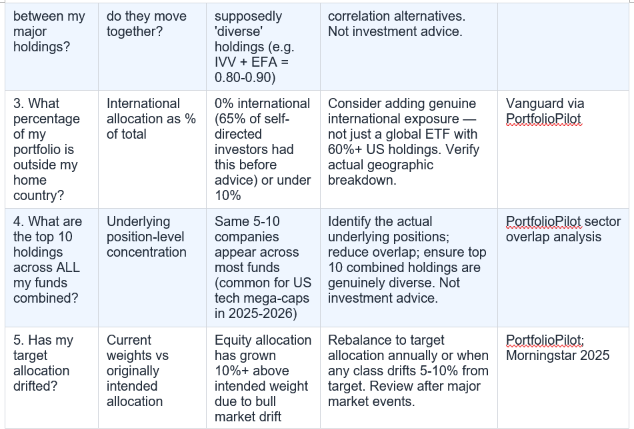
The following five questions, applied to your portfolio once a year, identify each of the mistakes covered in this article. Not financial advice.
Conclusion
The research that runs through every section of this article reaches the same conclusion from multiple directions. Elton and Gruber showed the risk reduction benefit plateaus beyond 20-30 holdings. The CFA Institute confirmed the incremental benefit disappears beyond that range. The University of Göttingen demonstrated that correlation neglect — not the number of holdings — is the primary driver of bad diversification decisions. Morningstar’s 2025 report confirmed that correlations shift over time and that the traditional stock-bond relationship broke down in 2022. Vanguard found that 65% of self-directed investors had no international exposure at all. PortfolioPilot found that a portfolio appearing diversified can have 85%+ of its risk from a single asset class. The pattern is consistent: the mistake is not usually too few assets. It is assets that all respond to the same forces, whatever label they carry. Diversification that works is not about owning more. It is about owning fewer things that genuinely do not move together. A portfolio of 15 to 30 truly uncorrelated assets, reviewed annually, rebalanced when drift occurs, and constructed with real attention to geographic and sector exposure, is more diversified in every meaningful sense than a portfolio of 100 funds with similar underlying holdings. The fix is not more funds. It is better diversification.Frequently Asked Questions
How many stocks or funds do I actually need to be diversified?The research is consistent: 15 to 30 genuinely uncorrelated holdings removes most unsystematic (company-specific) risk. HeyGoTrade cites the Elton and Gruber research showing the risk-reduction benefit drops significantly after approximately 20-30 stocks. The CFA Institute finding, cited by PortfolioPilot, is specific: incremental risk reduction becomes negligible beyond this range. Beyond 30 holdings, adding more does not meaningfully reduce risk — it adds complexity, potential overlap, and in some cases fees. The critical qualifier is 'genuinely uncorrelated.' Twenty funds that all track US large-cap equities do not constitute 20 diversification units. They constitute one.
What is correlation and why does it matter for diversification?
Correlation is the statistical measure of how two assets move in relation to each other. A correlation of 1.0 means they move in perfect lockstep. A correlation of 0 means they are statistically independent. A correlation of -1.0 means they move in perfect opposition. Morningstar's 2025 Diversification Landscape explains the mathematical principle: the lower the correlation between assets, the greater the reduction in portfolio volatility from combining them. Two assets with -0.5 correlation provide substantially more diversification benefit than two assets with +0.9 correlation, regardless of how different their names sound. University of Göttingen researchers found correlation neglect is the strongest driver of suboptimal diversification — investors consistently ignore this when building portfolios.
Is it possible to be over-diversified?
Yes, and it is more common than under-diversification among retail investors who follow general advice to 'spread investments widely.' HeyGoTrade's diversification myths analysis explains: over-diversification beyond 20-30 stocks dilutes returns without meaningful risk reduction. PortfolioPilot adds: 'Over-diversification can lead to index-like returns without the benefit of real control. Too many assets = complexity, overlap, and hidden correlation.' When you hold 100 securities that all move together, you have created the costs and complexity of a large portfolio while capturing the diversification benefit of a much smaller one.
What happened to stock-bond diversification in 2022?
The 2022 rate-hike cycle produced one of the clearest recent demonstrations that correlation between assets is not fixed. PortfolioPilot's common diversification mistakes analysis explains: during 2022, both stocks and bonds declined — a reversal of the traditional negative correlation between the two asset classes that had been reliable for most of the previous 40 years. Investors who believed a stock-and-bond portfolio was reliably diversified experienced losses in both components simultaneously. Morningstar's 2025 research warns directly: 'Correlation coefficients shift over time, so what worked in the past won't necessarily work in the future.' The lesson: always review the current correlation, not the assumed historical one.
How often should I review my portfolio's diversification?
PortfolioPilot's guidance recommends at minimum a quarterly review of portfolio exposures, with specific attention to concentration, correlation, and whether allocations have drifted from their intended targets. Morningstar's 2025 Diversification Landscape notes that correlation can shift over multiyear periods, making the annual review a necessary minimum rather than an optional exercise. A practical rule: review after any major market regime change (rate hike cycles, geopolitical shocks, major sector dislocations), and at least annually in stable conditions. Rebalance when any asset class has drifted more than 5-10% from its intended weight.
0 Comments
Be the first to share your thoughts on this article.