

Savings
The State of Saving in the UK: Accountant Explains

Table of Contents
- A Nation Divided Between Savers and the Savings-Less
- The Headline Numbers: What UK Savers Actually Hold in 2026
- Average UK Savings by Age: The Generational Divide in 2026
- Inflation vs Savings Rates: The Decade of Lost Purchasing Power
- Where to Put Your Savings: Best Rates by Account Type — July 2026
- The ISA Landscape: 46% Cash ISA, 26% Stocks and Shares ISA
- Who Is Not Saving — and Why: The Structural Barriers
- What Good Saving Looks Like in 2026: The Practical Framework
- The Gender Savings Gap: £9,448 Between Men and Women
- Conclusion
- Frequently Asked Questions (FAQ)
A Nation Divided Between Savers and the Savings-Less
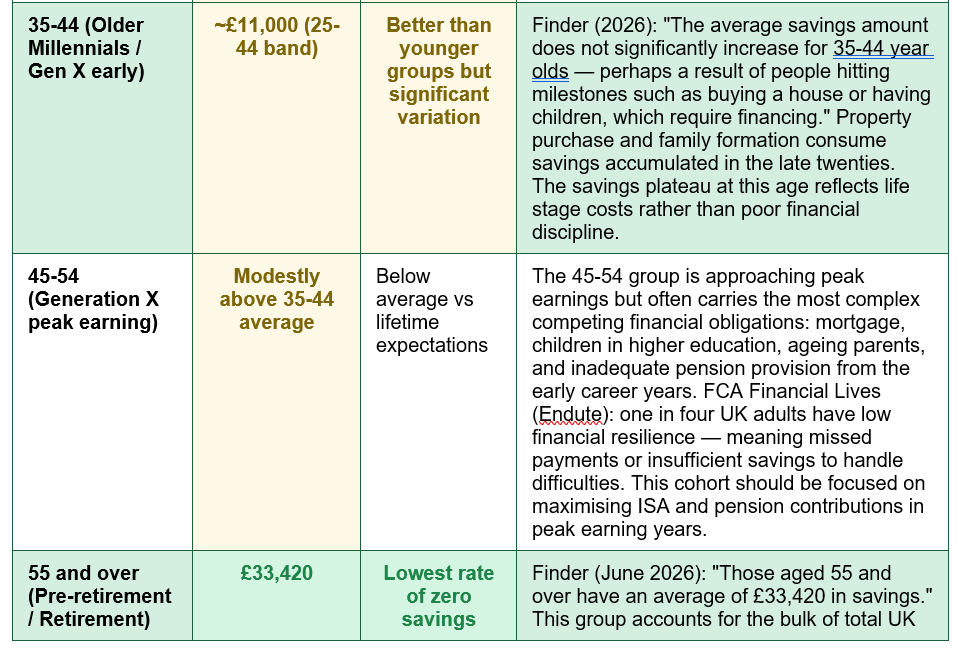
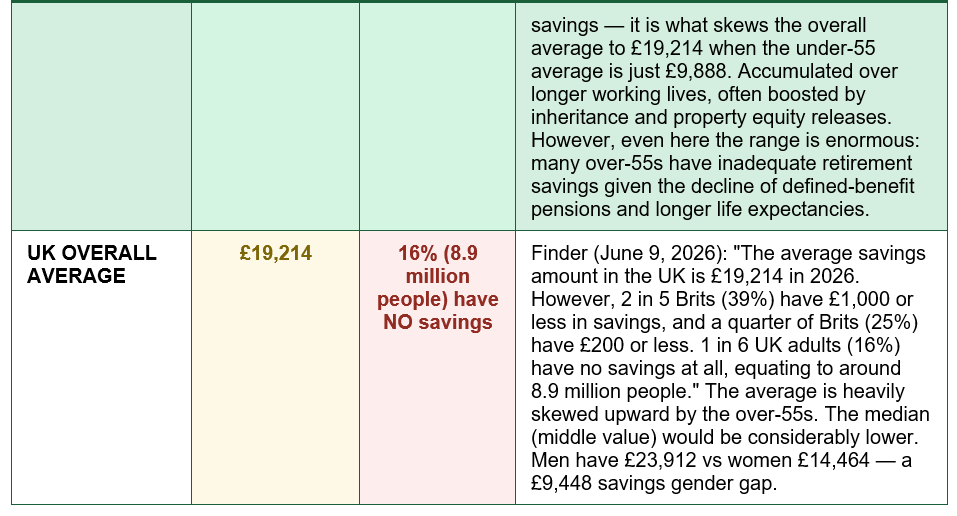
The average UK adult holds £19,214 in savings in 2026. That number sounds reassuring — until you look at what is hiding behind it. That average is pulled heavily upward by the over-55s, who hold £33,420 on average. Remove those aged 55 and above, and the average savings for everyone under 55 in the UK collapses to just £9,888. More revealingly: 2 in 5 Brits — 39% of the population — have £1,000 or less in savings. A quarter of all UK adults have £200 or less. And 16% of UK adults — approximately 8.9 million people — have no savings whatsoever. Not a small emergency fund. Not a rainy-day reserve. Nothing.This is the true state of saving in the UK in 2026: a population split between a relatively affluent older generation that has accumulated savings over decades, and a younger, often renting, often indebted generation that is structurally unable to build meaningful financial resilience. The FCA's Financial Lives 2024 survey (published May 2025, covering 17,950 respondents) found that one in four UK adults have low financial resilience — having missed payments or lacking the savings to handle unexpected costs. And 44% of adults stopped or reduced saving in the previous twelve months.
Yet this is also a moment of meaningful opportunity for those who can save. The Bank of England base rate, while falling from its peak, remains at 3.75% as of February 2026. As of July 17, 2026, the best UK savings rates range from 4.38% AER on fixed accounts to 8.00% AER on regular savers — rates that have not been available since the years before the 2008 financial crisis. The question for 2026 is not whether good savings rates exist: they do. The question is how many people are accessing them, whether the best products are well understood, and what the structural barriers to saving actually look like for different segments of the population. This report addresses all three.
The Headline Numbers: What UK Savers Actually Hold in 2026
The savings landscape in the UK in 2026 is characterised by a set of statistics that sit in uncomfortable juxtaposition: a reasonable-looking average figure that masks extreme underlying inequality, a household savings rate that remains positive but has declined from its COVID-19-era peak, and a cohort of millions who have effectively been priced out of saving altogether by the combination of stagnant real wages, high housing costs, and a decade-long period when savings rates were so low that the behavioural habit of saving was genuinely demotivated.The household savings rate in the UK — the proportion of disposable income that is saved rather than spent — stood at 9.5% in Q3 2025, down from 10.2% in Q2 2025 (Office for National Statistics, as cited by Trading Economics). The long-run average from 1955 to 2025 is 7.83%, placing the current rate above historical norms — but the rate peaked at 27.5% in Q2 2020 during the COVID-19 pandemic when consumption was severely restricted. Since then, the steady draw-down of pandemic savings, the cost-of-living crisis of 2022-2023, and the normalisation of consumer spending have all contributed to the downward drift.
MoneySuperMarket (July 10, 2026) adds international context that is sobering for a country that considers itself financially sophisticated: 'The average person in the UK saves 10% of their income, whilst this is as high as 35% in other parts of the world.' Endute (May 22, 2026) quantifies the European gap: 'The eurozone household savings rate sits at about 15% (Eurostat, Q1 2025) — roughly three times the US rate and 50% higher than the UK rate. Germany leads at over 20%. The Netherlands saves about 25% of household income.'
UK savings 2026 — the defining statistics: Average UK savings: £19,214. But 39% have £1,000 or less. 16% have NO savings (8.9 million people). Under-55 average: just £9,888. — Finder (June 9, 2026): 'The average savings amount in the UK is £19,214 in 2026. However, 2 in 5 Brits (39%) have £1,000 or less in savings, and a quarter of Brits (25%) have £200 or less. 1 in 6 UK adults (16%) have no savings at all, equating to around 8.9 million people. Men have £23,912 in savings on average, compared to £14,464 for women.' FCA Financial Lives (Endute, May 2026): 44% of adults stopped or reduced saving in the previous 12 months; 1 in 4 have low financial resilience. Bank of England base rate: 3.75% (February 2026). Best regular saver rate: 8.00% AER (Moneyfactscompare, July 17, 2026)
Average UK Savings by Age: The Generational Divide in 2026
The variation in savings across age groups tells a story that is as much about structural economic change as it is about individual financial decisions. Understanding where each generation stands — and why — is essential context for any honest assessment of the state of saving in the UK: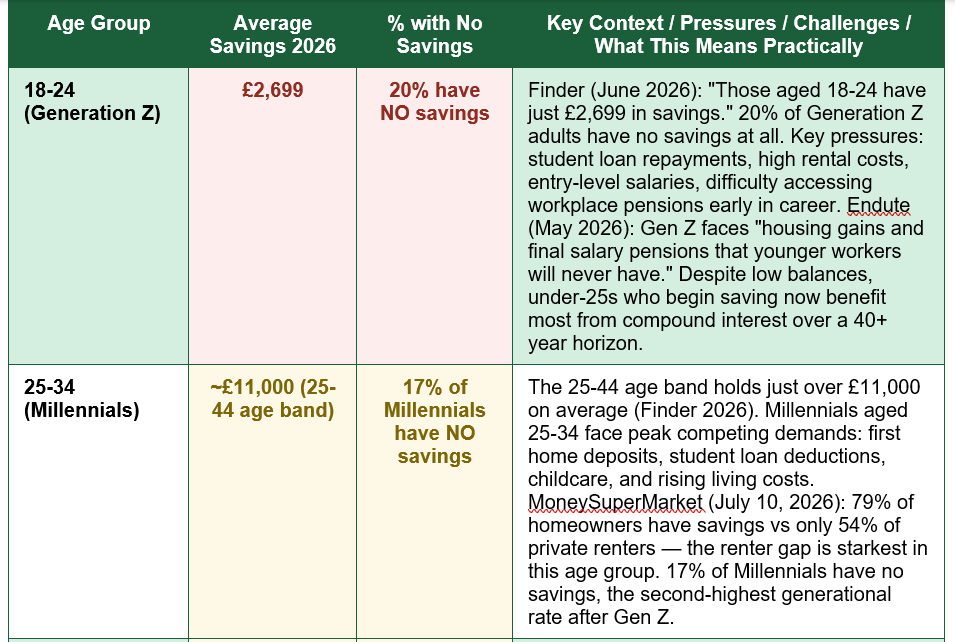
Inflation vs Savings Rates: The Decade of Lost Purchasing Power
To understand why so many UK adults have little or no savings in 2026, it is essential to understand what happened to savings rates between 2008 and 2021 — and the psychological and behavioural consequences of that era. The period from the 2008 financial crisis to the post-pandemic inflation spike represents the longest sustained period of near-zero savings rates in modern British financial history.ClearScore (3 days ago, July 2026) documents the trajectory: 'While the average savings account paid a mere 0.35% in 2021, the landscape shifted violently when inflation peaked at a 41-year high of 11.1% in late 2022. This forced the Bank of England to intervene, eventually driving savings rates up to levels not seen since the 2008 financial crisis.' Between 2008 and 2014, average savings rates fell from 5.09% to 1.5%. They continued drifting down through the 2010s, reaching a nadir of 0.35% in 2021. At 0.35% with inflation running at 2%+, cash savings were actively destroying purchasing power. The rational response — moving money out of cash savings into equities, property, or just spending it — was the one many people took.
Finder's research quantifies the damage: 'The average UK savings account has lost £2,989 in real terms between June 2020 and June 2025. If savings rates had risen in line with inflation over the last five years, then this amount would now be worth £20,286.' For someone holding £17,000 in savings (close to the current average), the failure to find inflation-beating savings products cost them approximately £3,000 in real purchasing power over five years — the equivalent of watching one sixth of their savings silently evaporate.
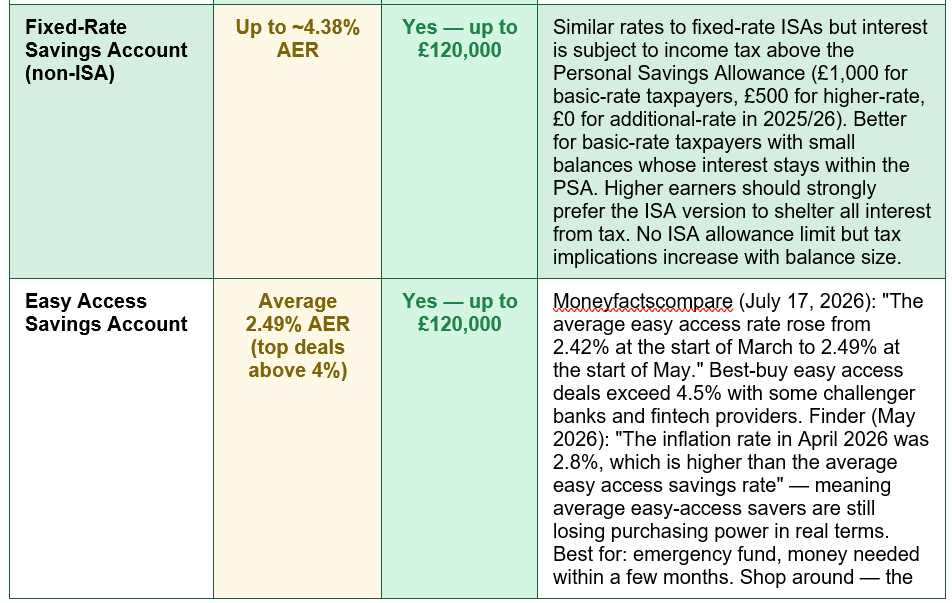
The recovery has been significant. Finder (May 2026): 'Average savings rates began rising again in 2022 as the Bank of England began to raise the base rate in an effort to control inflation.' By 2024-2025, the best easy-access rates were exceeding 5% and fixed-rate ISAs were reaching 5.5% — the highest in decades. In 2026, with the base rate settled at 3.75%, rates have moderated but remain meaningfully positive. The problem: Finder (April 2026) notes that 'The inflation rate in April 2026 was 2.8%, which is higher than the average easy access savings rate.' The best rates easily clear inflation — but the average easy-access rate of 2.49% does not. The gap between the best and average rates is the opportunity cost of not actively shopping around.
The 'loyalty penalty' on savings: One of the most consistent findings in UK savings research is that the banks offering the lowest savings rates are the largest high-street banks — Barclays, Lloyds, NatWest, HSBC, and Santander — whose easy-access rates have historically been far below the market-leading rates offered by challenger banks (Marcus, Moneybox, Chase UK, Atom Bank) and building societies. ClearScore (July 2026) and Moneyfactscompare (July 17, 2026) both note that savers must 'monitor top rates regularly' because the gap between providers is substantial. Moneyfactscompare data shows the average easy-access rate rose from 2.42% to 2.49% in just two months — but the best-buy easy-access rate already exceeded 4.5%. The difference between the average and the best on a £20,000 balance: approximately £400 per year in additional interest — simply from moving to the right account.
Where to Put Your Savings: Best Rates by Account Type — July 2026
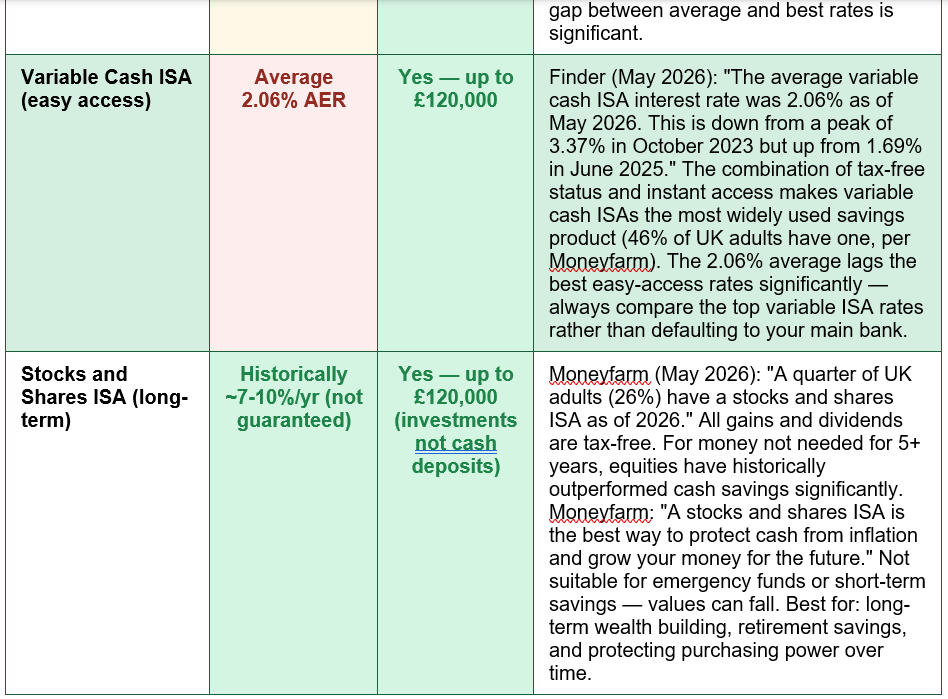
Understanding the savings rate landscape in July 2026 requires knowing not just the average rates but the best available rates — and the practical restrictions that accompany each account type. The following table maps the full spectrum from highest-rate to most flexible: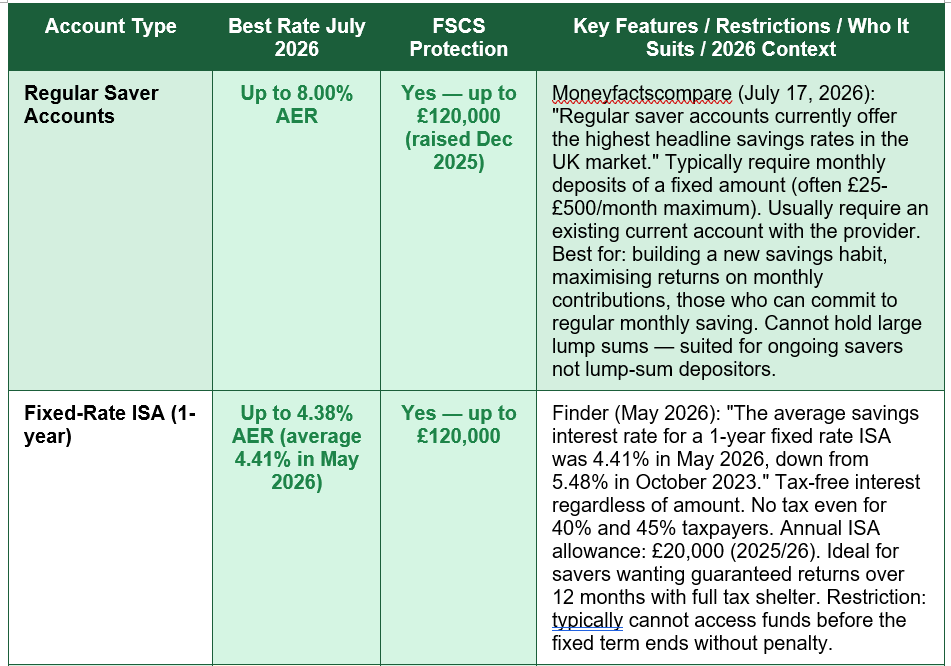
The ISA Landscape: 46% Cash ISA, 26% Stocks and Shares ISA
The Individual Savings Account (ISA) is the cornerstone of UK tax-efficient saving, and 2026 data reveals both its strength as a financial habit and the gap between how people use it and how they optimally should. Moneyfarm (May 27, 2026): '4.1 million stocks and shares ISAs and 9.9 million cash ISAs were subscribed to in 2023/2024. A quarter of UK adults (26%) have a stocks and shares ISA as of 2026, while almost half of Brits (46%) have a cash ISA.'The cash ISA dominance is understandable — cash is familiar, tangible, and offers guaranteed nominal returns. The 2025/26 ISA allowance of £20,000 per adult can be split between any combination of ISA types, giving full flexibility. However, Moneyfarm's assessment is that for long-term wealth building, the cash ISA is insufficient: 'While cash rates are far better than a few years ago, they are still struggling to keep pace with prices. A stocks and shares ISA is the best way to protect cash from inflation and grow your money for the future.' The 2.06% average variable cash ISA rate (Finder, May 2026), against 2.8% April 2026 inflation, continues to produce negative real returns for average cash ISA holders.
The Lifetime ISA (LISA) is making increasing practical impact: MoneySuperMarket (July 10, 2026) reports that 'The number of individuals who made a withdrawal from a Lifetime ISA to make a house purchase went from 56,750 in 2023-2024, to 87,250 in 2024-2025 — an increase of over 50%.' The average LISA withdrawal for a property purchase was £15,782 in 2024-2025. This 53% annual increase in LISA withdrawals reflects both the maturation of the LISA cohort (accounts opened from 2017 are now seasoned) and the continuing pressure of first-time buyer affordability in the UK housing market.
Who Is Not Saving — and Why: The Structural Barriers
The 8.9 million UK adults with no savings at all are not a monolithic group — they include people with very different financial circumstances, ages, and barriers. Understanding why people are not saving is as important as understanding the savings statistics themselves:- The renter-owner savings gap: MoneySuperMarket (July 10, 2026): '79% of homeowners have money in a savings account, whilst only 54% of those renting privately have any savings.' This 25-percentage-point gap reflects multiple compounding factors: renters devote a higher proportion of income to housing costs, making monthly surplus for saving smaller or non-existent; renters have no property equity accumulation as a form of forced saving; and renters typically have lower average incomes, as homeownership itself correlates with higher earnings. The housing tenure gap is perhaps the single biggest structural driver of savings inequality in the UK.
- Generational savings inequality: Endute (May 22, 2026): '20% of Gen Z adults and 17% of Millennials have no savings at all.' Young adults face a unique combination of pressures that previous generations did not encounter simultaneously: student loan repayments reducing take-home pay; housing costs at historic highs relative to income; the decline of defined-benefit workplace pensions requiring higher personal contributions; and a decade of 2010s savings rates that demotivated the savings habit in exactly the years when young adults were forming their financial behaviours. Endute adds: 'Much of this is simply the result of more time to accumulate, but it also reflects inherited wealth, housing gains, and final salary pensions that younger workers will never have.'
- The stopping and reducing trend: FCA Financial Lives (cited by Endute, May 2026): '44% of adults stopped or reduced saving in the previous 12 months.' This is the clearest indicator of financial fragility at a population level — nearly half of all UK adults either stopped saving or reduced their savings contributions in the past year. The reasons are multi-factorial: cost-of-living pressures, higher debt servicing costs following the interest rate rises, and the loss of the COVID-era household income support that artificially boosted savings rates in 2020.
- Low financial resilience: FCA Financial Lives (Endute): 'One in ten UK adults have no cash savings at all. Another 21% have less than £1,000. One in four have low financial resilience, meaning they have missed payments or lack savings to handle difficulties.' Low financial resilience creates a self-reinforcing cycle: without savings, any unexpected expense (car breakdown, boiler replacement, medical cost) must be met with credit, generating debt that further reduces the monthly surplus available for saving.
What Good Saving Looks Like in 2026: The Practical Framework
Against the backdrop of the statistics above, what does a genuinely sound savings strategy look like for a UK adult in July 2026? The following framework, grounded in the current interest rate environment and tax-efficient account structure, provides the practical foundation:Priority 1: Emergency fund (3-6 months of essential expenses): Target: 3 months minimum; 6 months for self-employed or variable income. Account: best-buy easy-access savings (4%+ AER available July 2026). Purpose: financial resilience — covers unexpected costs without triggering credit card debt. Never compromise this for higher returns in less accessible accounts.
Priority 2: Use your ISA allowance first (£20,000 in 2025/26): Cash ISA (easy access): for emergency fund overflow and near-term savings. Fixed-rate ISA (1-year+): for money not needed for 12+ months. Stocks and Shares ISA: for money committed for 5+ years. All ISA income and gains are tax-free — this is the highest-priority tax shelter available to UK adults.
Priority 3: Regular saver accounts (up to 8.00% AER July 2026): For monthly contributions of typically £25-£500/month. Highest available rates in the market. Usually require an existing current account with the provider. Use for monthly savings discipline and maximum return on new monthly contributions. Cannot store large lump sums.
Priority 4: Pension contributions (particularly employer-matched): Employer-matched pension contributions are effectively a guaranteed 50-100% instant return. After ISA, SIPP contributions provide tax relief at your marginal rate (20%, 40%, or 45%) plus tax-free growth. Long-term wealth building.
Priority 5: Invest for the long term (5+ year horizon): Moneyfarm (May 2026): stocks and shares ISA is "the best way to protect cash from inflation and grow your money for the future." Historical equity returns of 7-10%/year far exceed fixed savings rates over 10+ year periods. Not suitable for emergency funds or near-term goals.
The Gender Savings Gap: £9,448 Between Men and Women
One of the most striking findings in the 2026 UK savings data is the gender savings gap. Finder (June 9, 2026): 'Men have £23,912 in savings on average, compared to £14,464 for women.' That is a gap of £9,448 — meaning the average UK woman holds 39% less in savings than the average UK man. This gap is not primarily a reflection of different attitudes to saving. It reflects structural economic inequalities that express themselves in savings outcomes: the gender pay gap (women earn less on average than men at every career stage); career breaks for childcare, which disproportionately affect women's earnings trajectories; the part-time work premium (women are more likely to work part-time, and part-time hourly rates are on average lower); and the pension gender gap (women retire with significantly smaller pension pots as a result of the same career interruptions and pay disparities).The savings gender gap is both a symptom and a cause of financial vulnerability: women with less savings have less financial resilience, less negotiating power in relationships, and less ability to handle unexpected financial shocks. The FCA's Financial Lives data consistently finds higher rates of financial vulnerability among women than men. The specific solutions are structural — equal pay, affordable childcare, flexible working — but at the individual level, the priority for women is the same as for any under-served saver: maximise ISA allowances, automate monthly transfers to savings, and access employer pension matching before any other investment priority.
THE SAVINGS COMPLACENCY TRAP — FOUR MISTAKES THAT COST UK SAVERS HUNDREDS OF POUNDS PER YEAR: (1) ACCEPTING YOUR BANK'S DEFAULT RATE — the largest high-street banks consistently offer savings rates significantly below the market best. The difference between a 1% high-street rate and a 4.5% challenger bank rate on £10,000 is £350 per year. Compare rates at Moneyfactscompare.co.uk regularly. (2) CHOOSING INTEREST OVER TAX EFFICIENCY — savers who hold large balances outside an ISA pay income tax on interest above the Personal Savings Allowance (£1,000 basic-rate, £500 higher-rate, £0 additional-rate). A higher-rate taxpayer with £20,000 in a non-ISA account at 4% earns £800 in interest — pays 40% tax = £320 to HMRC. The same money inside an ISA: £0 tax. (3) NOT SHOPPING AROUND AS RATES CHANGE — Moneyfactscompare (July 17, 2026): 'Savers must be vigilant and monitor top rates regularly.' Rates change weekly. The best deal this month may not be the best deal next month. Set a calendar reminder to review your savings rate every 3-6 months. (4) KEEPING LONG-TERM MONEY IN CASH — for money not needed for 5+ years, cash savings reliably underperform equities over long periods. Finder: the average UK savings account lost £2,989 in real terms over 5 years. For long-term goals, a Stocks and Shares ISA has historically provided significantly better inflation-beating returns.
Conclusion
The state of saving in the UK in 2026 presents a study in contradictions. The headline average of £19,214 masks the reality that the majority of UK adults under 55 hold just £9,888 — and that 39% of the entire population has £1,000 or less, 25% has £200 or less, and 16% has nothing at all. The FCA's finding that 44% of adults stopped or reduced saving in the past year suggests that the underlying trend is deteriorating rather than improving for a significant portion of the population. The renter-owner gap, the generational gap, and the gender gap all compound each other to create pockets of severe savings inadequacy alongside pockets of genuine accumulated wealth.Yet the interest rate environment in 2026 offers the best returns for savers in over a decade. Regular saver accounts are yielding up to 8.00% AER. Fixed-rate ISAs are averaging 4.41%. The best easy-access accounts exceed 4.5%. The FSCS protection limit has risen to £120,000 per banking group. The ISA annual allowance of £20,000 provides a £40,000 per-couple annual tax shelter that makes all returns entirely free of Income Tax and Capital Gains Tax. The tools for building financial resilience are available and accessible. The barrier is rarely the interest rate: it is the structural squeeze on disposable income that prevents saving in the first place, compounded by a long period of demotivating near-zero rates that eroded the savings habit for millions.
The practical conclusion is straightforward: for those who can save, July 2026 is an excellent moment to review where savings are held, compare rates against the best available at Moneyfactscompare.co.uk, fill ISA allowances before using taxable accounts, and deploy long-term money into equities rather than cash. For those who cannot yet save, building even a modest emergency fund — even £500 — breaks the cycle of credit dependency that prevents any surplus from accumulating. And for policymakers, the data makes the stakes of savings inequality clear: a country where 8.9 million adults have no financial cushion whatsoever is a country with severely limited collective resilience to the economic shocks that inevitably come.

0 Comments Comments