

Credits
The US Debt Map: $18.8 Trillion By State, Age, and Type

Table of Contents
- A Record That Keeps Breaking
- The National Debt Numbers: Q1 2026 in Full
- The Generational Debt Map: Who Owes What and Why
- Deep Dive by Debt Type: The Story Behind Each Category
- The Regional Debt Map: Where Debt Is Concentrated and Where It Hurts Most
- The Stress Signals: Where the 2026 Debt Map Shows Pressure
- Conclusion: A Debt Map That Tells Two Different Stories
- Frequently Asked Questions (FAQ)
A Record That Keeps Breaking
The United States household debt reached $18.8 trillion in the first quarter of 2026, according to the Federal Reserve Bank of New York's Quarterly Household Debt and Credit Report released on May 12, 2026. This is a new all-time high -- the latest in a series of records that has seen American household debt grow from $7.23 trillion in 2003 to more than two and a half times that figure in just over two decades. The $18 billion increase in Q1 2026 alone -- described as a 0.1% quarterly rise -- masks the more dramatic annual picture: WalletHub (June 24, 2026) reports that total debt increased by 3.24% compared to Q1 2025.The composition of that $18.8 trillion tells a story about where American financial life is concentrated, where it is under pressure, and where the risks are most acute. Mortgage debt dominates at $13.19 trillion -- more than 70% of total household debt, reflecting the central role of home ownership in American household balance sheets. Credit card debt has reached a record $1.3 trillion. Student loan debt stands at $1.66 trillion, with a delinquency rate of 10.3% for balances 90+ days past due -- up from 9.6% just one quarter earlier -- and approximately 2.6 million borrowers transferred to the Department of Education's Default Resolution Group. Auto loan debt has grown 146% faster than student loan debt since 2020, reaching $1.67 trillion.
This guide maps the full US debt picture in 2026: by debt type, by generation, by state, and by the delinquency and stress signals embedded in the most current data. It is not just a collection of large numbers. The debt map reveals structural patterns in American financial life -- who owes the most, which types of debt are growing fastest, which demographics and geographies are under the most pressure, and what the 2026 data means for households at every income and age level.
The National Debt Numbers: Q1 2026 in Full
The following table presents the complete US debt picture by category, using the most current available Federal Reserve Bank of New York and secondary source data: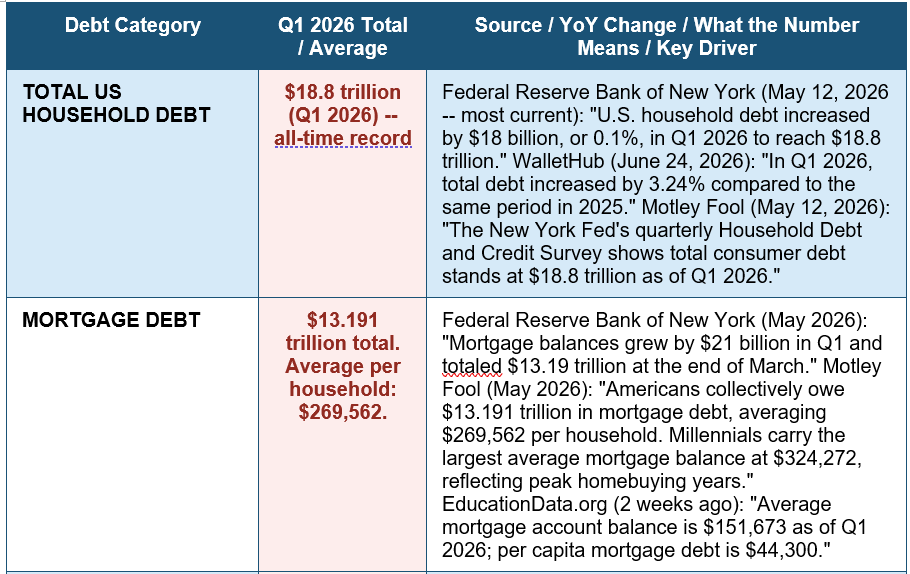
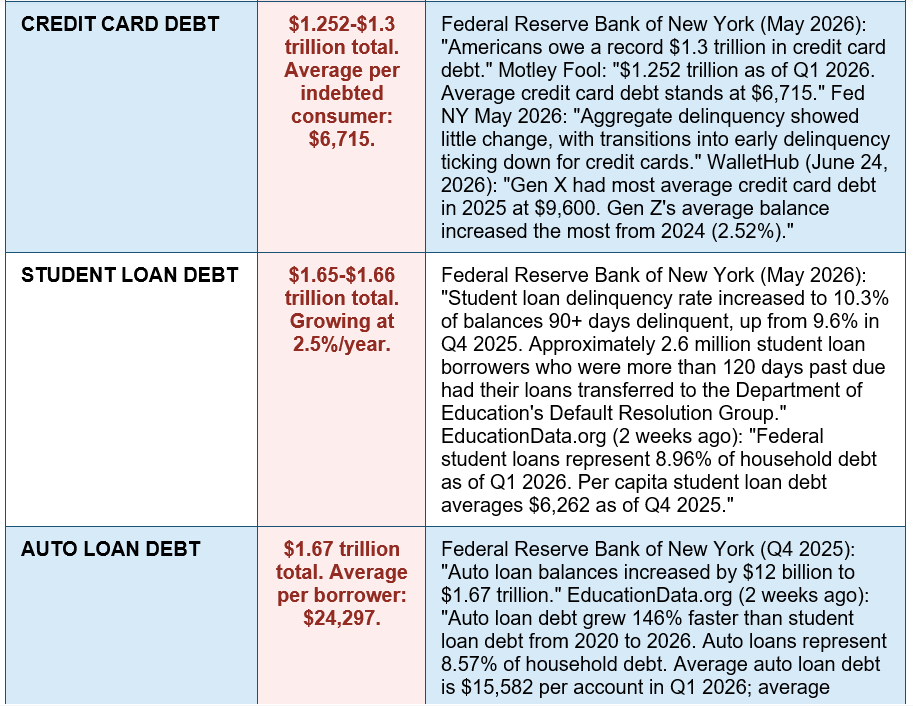
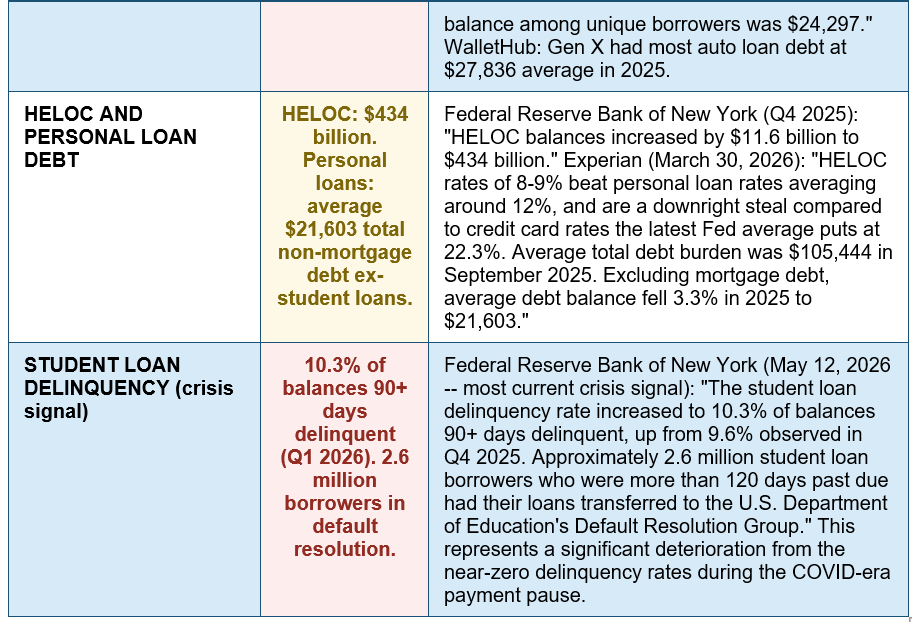
US household debt Q1 2026 -- the record numbers: $18.8 trillion total (all-time record). $13.19T mortgages. $1.3T credit cards. $1.66T student loans. $1.67T auto. Student loan delinquency: 10.3%. — Federal Reserve Bank of New York (May 12, 2026 -- most current): '$18.8 trillion total household debt Q1 2026. Mortgage balances $13.19 trillion. Student loan delinquency 10.3% -- up from 9.6% Q4 2025. 2.6 million student borrowers in Default Resolution Group.' WalletHub (June 24, 2026 -- most current comprehensive state/age data): '3.24% total debt increase Q1 2026 vs Q1 2025. 40-49 year olds have most debt at $4.92 trillion.' Motley Fool (May 2026): 'Total $18.8 trillion. Credit card record $1.3 trillion. Millennials highest avg mortgage $324,272.'
The Generational Debt Map: Who Owes What and Why
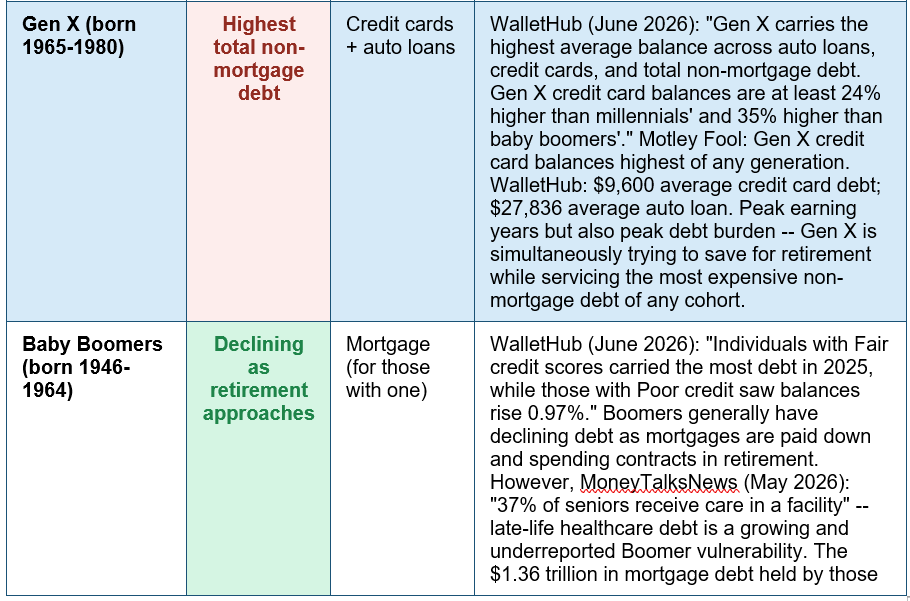
The distribution of debt across generations is not uniform -- it follows the life cycle of financial decisions, from student loans and entry-level car purchases in early adulthood through peak mortgage and consumer debt in middle age, to declining balances as retirement assets replace debt in later life: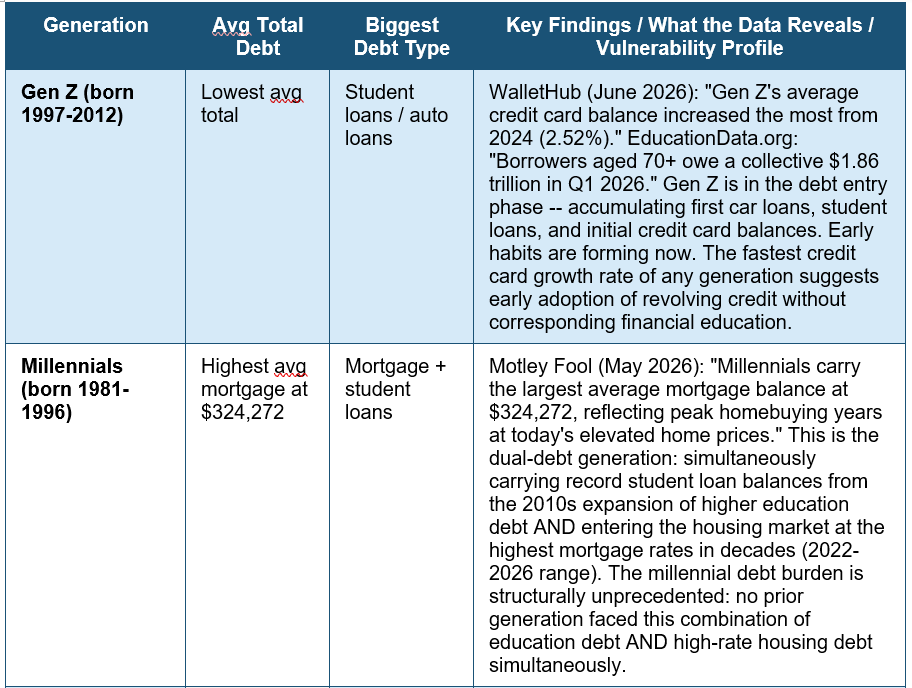

Deep Dive by Debt Type: The Story Behind Each Category
1 MORTGAGE DEBT -- $13.19 TRILLION AND GROWING | 70.2% of all US household debt. The housing market is the American balance sheet.
Mortgage debt is not just the largest category -- it is the dominant feature of the American household balance sheet to a degree that makes all other debt categories look modest by comparison. Federal Reserve Bank of New York (May 12, 2026): 'Mortgage balances grew by $21 billion in Q1 and totaled $13.19 trillion at the end of March.' EducationData.org (2 weeks ago -- most current): 'Mortgage debt grew three times as fast as student loan debt from 2020 to 2026.' Motley Fool (May 2026): 'Average monthly mortgage payment increased 3.83% in 2024 to $2,035.' The mortgage market in 2026 is dominated by a structural feature that has no modern precedent: the lock-in effect. Approximately 60-70% of existing mortgage holders locked in rates below 4% during 2020-2022. Moving would mean giving up these rates for a current market rate of 6.66% (Freddie Mac, July 30, 2026). This lock-in suppresses supply, keeps home prices elevated, and means the $13.19 trillion in mortgage balances is held disproportionately by people who have little financial incentive to sell their homes. WalletHub (June 24, 2026): 'Individuals aged 40-49 held the highest share of debt at $4.92 trillion in Q1 2026. Of this amount, $3.60 trillion was from mortgages.' Mortgage delinquencies are rising but remain near historically normal levels -- though the Fed notes deterioration is 'concentrated in lower-income areas and in areas with declining home prices.'2 CREDIT CARD DEBT -- $1.3 TRILLION RECORD | The fastest-growing major debt category in recent quarters. Delinquency is stabilising but balances are at historic highs.
Credit card debt hit a record $1.3 trillion in Q1 2026, according to the Federal Reserve Bank of New York. Motley Fool (May 2026): 'Average credit card debt stands at $6,715.' This average masks the bifurcation in credit card usage: approximately 30-35% of credit card users pay their statement in full each month and pay zero interest; the remaining 65-70% carry a balance at the average APR of 22.3% (Experian, March 2026). For households carrying balances, this represents one of the most expensive forms of debt available. The interest cost on $6,715 at 22.3% APR is approximately $1,497 per year -- money that produces no asset, builds no equity, and reduces no meaningful debt balance at minimum payment levels. The generational distribution is revealing: WalletHub (June 24, 2026): Gen X carries the highest average credit card debt at $9,600 -- 24% more than Millennials and 35% more than Baby Boomers. Gen Z is adding credit card debt fastest (2.52% year-over-year increase). The Federal Reserve Bank of New York's Q1 2026 report notes that 'transitions into early delinquency ticked down for credit cards' -- a modest positive signal, though absolute balances remain at historic highs. The Queen Zone (July 1, 2026) confirmed: 'LendingTree estimates Americans' total credit card balance reached $1.252 trillion in Q1 2026.'3 STUDENT LOAN DEBT -- $1.66 TRILLION AND A 10.3% DELINQUENCY RATE | The post-pause reckoning. 2.6 million borrowers transferred to Default Resolution.
Student loan debt is where the most acute immediate crisis in the US debt map is concentrated. Federal Reserve Bank of New York (May 12, 2026 -- most current, most alarming): 'The student loan delinquency rate increased to 10.3% of balances 90+ days delinquent, up from the 9.6% observed in Q4 2025. Approximately 2.6 million student loan borrowers who were more than 120 days past due had their loans transferred to the U.S. Department of Education's Default Resolution Group.' This represents a sharp deterioration from the near-zero delinquency rates maintained during the COVID-era payment pause (2020-2022). The pause ended in October 2023, and the subsequent re-entry into repayment has exposed the structural fragility of a borrower population that used the pause period to adjust to life without loan payments rather than to build savings to resume them. EducationData.org (2 weeks ago): 'In total, federal student loans represent 8.96% of household debt as of Q1 2026. Per capita student loan debt averages $6,262 as of Q4 2025. The average federal student loan debt per borrower represents 91.3% of the average mortgage debt per capita.' Experian (March 2026): 'Borrowers still collectively owe $1.65 trillion in student loan debt, which is increasing at an annual rate of 2.5%. Ongoing changes in federal student loan debt repayment plans since the start of the pandemic in 2020 continue into 2026.'4 AUTO LOAN DEBT -- $1.67 TRILLION AND THE FASTEST GROWING SINCE 2020 | 146% faster growth than student loans since 2020. Average borrower balance: $24,297.
Auto loan debt has become one of the most significant and underreported debt categories in the American household balance sheet. EducationData.org (2 weeks ago -- most current): 'Auto loan debt grew 146% faster than student loan debt from 2020 to 2026. Auto loans represent 8.57% of household debt. The average auto loan debt is $15,582 per account in Q1 2026. The average balance among unique borrowers was $24,297 in 2024.' The surge in auto loan debt reflects two simultaneous forces: new vehicle prices hit record highs in 2021-2023 (driven by supply chain disruption and chip shortages), pushing average vehicle transaction prices above $48,000 at the peak; and interest rates on auto loans rose sharply from 2022-2023 as the Federal Reserve raised the federal funds rate. The combination of higher vehicle prices and higher rates has produced auto loans of longer duration (72-84 month terms are now common) and higher monthly payments. WalletHub (June 24, 2026): 'Gen X had most auto loan debt in 2025, at $27,836 on average, while Silent Generation's average balance increased the most from 2024 (3.48%).' The auto loan delinquency picture is mixed: Federal Reserve Bank of New York (May 2026) noted that 'transitions into early delinquency holding steady for auto loans' -- suggesting the worst of the delinquency wave has been absorbed but not reversed.The Regional Debt Map: Where Debt Is Concentrated and Where It Hurts Most
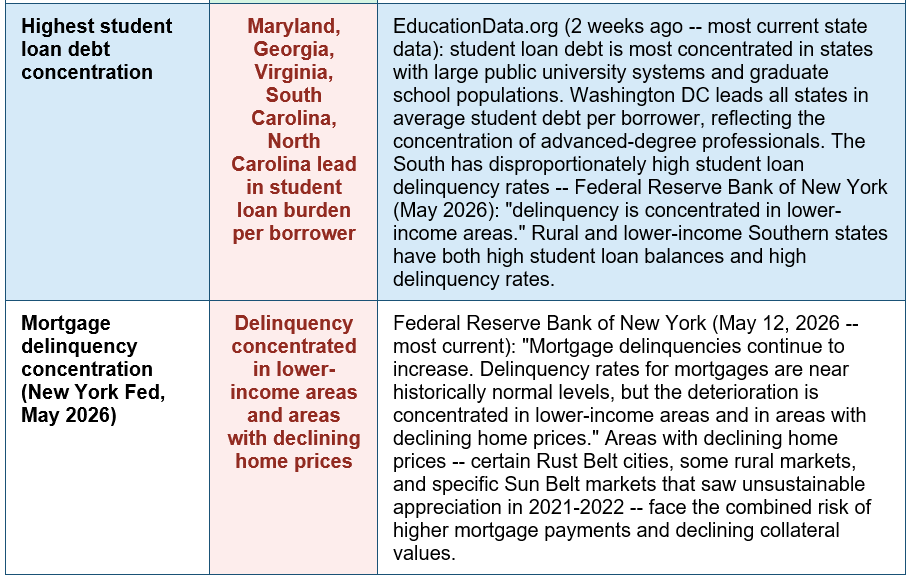
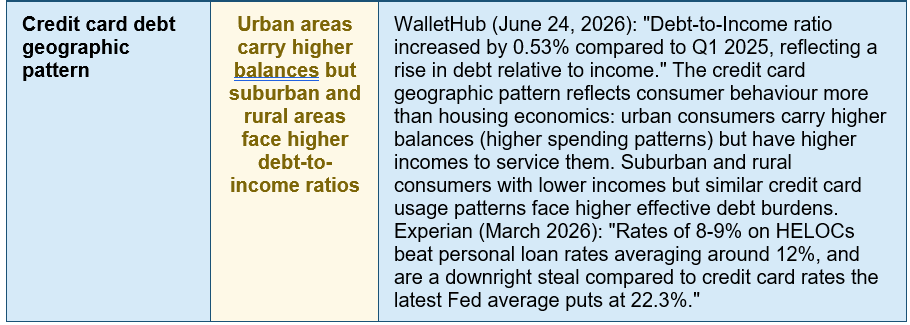
Debt is not evenly distributed across the United States. The geographic distribution reflects housing costs, income levels, educational attainment, and access to financial products -- creating distinct regional debt profiles that the national averages conceal: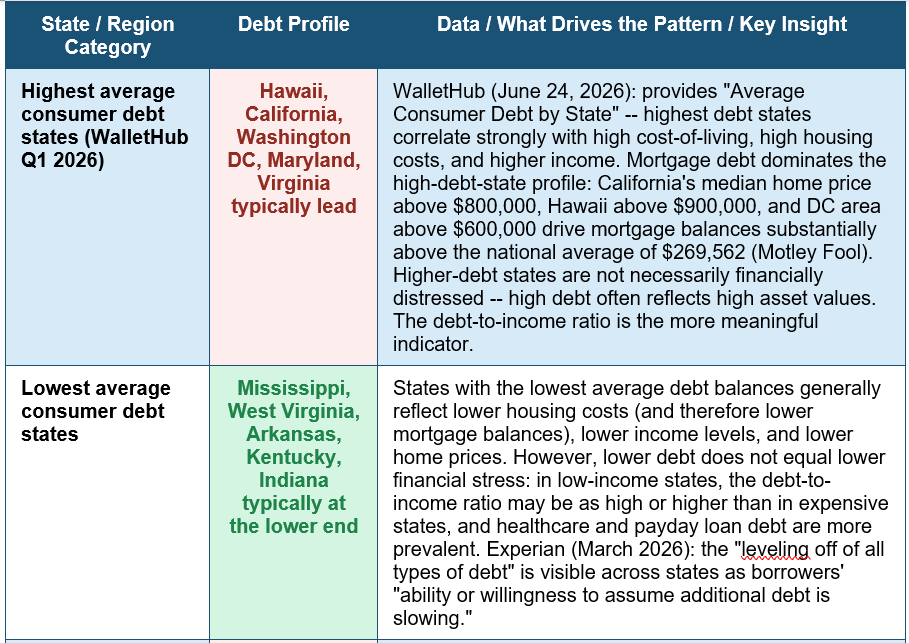
The Stress Signals: Where the 2026 Debt Map Shows Pressure
The headline totals are records. But the stress signals in the data are more important than the aggregate numbers for understanding where the debt map produces financial difficulty rather than financial capacity.- Student loan delinquency spike: From near zero during the payment pause to 10.3% in Q1 2026. Federal Reserve Bank of New York (May 12, 2026): 2.6 million borrowers transferred to Default Resolution. This is the most acute current stress signal in the debt map -- representing a large cohort of borrowers who cannot make payments on a debt that was suspended but never restructured to be more manageable.
- Mortgage delinquency concentration in lower-income areas: Federal Reserve Bank of New York (May 2026): "Deterioration is concentrated in lower-income areas and in areas with declining home prices." These are the households with the least financial cushion to absorb higher mortgage payments and the most exposure to negative equity if home prices fall.
- Gen X at peak debt burden: WalletHub (June 24, 2026): 40-49 year olds hold $4.92 trillion in debt -- the most of any age group. With retirement approximately 15-25 years away, Gen X faces a simultaneous challenge: servicing peak debt loads while building retirement savings. Credit card balances 24% higher than Millennials and 35% higher than Boomers create competing claims on the income that should be compounding in retirement accounts.
- Auto loan term extension as hidden risk: EducationData.org (2 weeks ago): 72-84 month auto loan terms are increasingly common. Extended terms reduce monthly payments but increase total interest paid and extend the period of negative equity (where the loan balance exceeds the vehicle's value). A borrower 18 months into a 72-month auto loan is likely in negative equity, creating a financial trap if circumstances change.
- Credit card interest rate at 22.3%: Experian (March 2026): average credit card rate is 22.3%. On the $6,715 average balance, this is $1,497 in annual interest. Minimum payments on this balance at 22.3% APR are insufficient to make meaningful progress -- the balance would take approximately 12-15 years to clear at minimum payment only, costing more in interest than the original balance. The $1.3 trillion total credit card balance at an effective rate near 22% represents approximately $286 billion in annual interest charges across the country.
What the $18.8 trillion actually means per household. The Federal Reserve Bank of New York's Q1 2026 data translates to a striking per-household figure. With approximately 130 million US households (US Census data): $18.8 trillion in total household debt divided by 130 million households = approximately $144,615 per household in total debt. Motley Fool (May 2026) provides a more granular figure: average total debt burden per household was $105,444 in September 2025 (Experian data), rising to higher when the most recent mortgage data is incorporated. WalletHub (June 24, 2026): 'In Q1 2026, people aged 40-49 had the most debt, owing around 4.92 times more than people ages 18-29, who had the least.' EducationData.org (2 weeks ago): 'Borrowers aged 70+ owe a collective $1.86 trillion in Q1 2026.' The debt map is not an abstraction. It is the specific sum of 130 million households' financial decisions, reflecting the price of housing, the cost of education, the price of cars, and the spending patterns supported by revolving credit -- all accumulated in an environment of the highest consumer borrowing rates since the early 1980s.
THE FIVE MOST ALARMING SIGNALS IN THE 2026 US DEBT MAP: (1) STUDENT LOAN DELINQUENCY AT 10.3% AND RISING FAST. Federal Reserve Bank of New York (May 12, 2026): up from 9.6% in Q4 2025. 2.6 million borrowers in Default Resolution. This is a rapid deterioration that suggests the structural issues with post-pause repayment are not self-resolving. For individual borrowers: contact your servicer immediately and explore income-driven repayment plans at studentaid.gov before default is recorded on your credit file. (2) GEN X CARRYING THE HIGHEST NON-MORTGAGE DEBT OF ANY GENERATION AT PEAK PRE-RETIREMENT YEARS. $9,600 average credit card debt and $27,836 average auto loan for the cohort 15-25 years from retirement. Every dollar in credit card interest at 22.3% APR is a dollar not compounding in a retirement account. The urgency for Gen X to eliminate high-interest consumer debt is extreme. (3) CREDIT CARD DEBT AT A RECORD $1.3 TRILLION WITH $1.252 TRILLION IN Q1 2026. Total US credit card interest payments at an effective rate near 22% represent approximately $275-286 billion annually -- the largest single interest cost on consumer borrowing in American history. For households: pay off or balance-transfer the highest-rate balances. CFPB provides comparison tools at consumerfinance.gov. (4) AUTO LOAN DEBT GROWTH 146% FASTER THAN STUDENT LOANS SINCE 2020. The rapid expansion of auto debt through extended term loans represents a hidden risk: negative equity vehicles, higher total cost of ownership, and reduced financial flexibility if income changes. The average $24,297 borrower balance at typical 2026 auto loan rates (approximately 6-8%) costs $1,700-$2,000/year in interest. (5) MORTGAGE DELINQUENCY CONCENTRATED IN LOWER-INCOME AREAS AND DECLINING PRICE MARKETS. For the most financially vulnerable mortgage holders, the combination of higher payments (refinanced out of fixed rates, or ARMs that have adjusted) and potential negative equity represents the highest risk of foreclosure since 2008-2009. Free mortgage delinquency help: HUD-approved housing counsellors at hud.gov.
YOUR DEBT MAP ACTION PLAN -- WHERE YOU STAND AND WHAT TO DO: KNOW YOUR NUMBERS (30 minutes today): (1) List every debt: balance, interest rate, minimum payment, and type (mortgage, student loan, credit card, auto, personal). Total them. This is your personal debt map. (2) Check where you stand relative to the national averages: Is your credit card balance above or below the $6,715 national average? Is your mortgage above or below $269,562 per household? Is your student loan delinquency risk: are you current, behind, or in forbearance? (3) Calculate your total annual interest cost: the sum of all your annual interest payments. For the average household with mixed debt, this can exceed $3,000-$7,000/year. PRIORITY ORDER FOR DEBT ATTACK: Step 1: Capture full employer 401(k)/retirement match (guaranteed 50-100% return). Step 2: Eliminate credit card debt above 10% APR using debt avalanche (highest rate first). Step 3: Build 3-month emergency fund to prevent new high-interest debt. Step 4: Address student loan delinquency if applicable (income-driven repayment at studentaid.gov). Step 5: Refinance auto loan if rate above 8% and credit score has improved. Step 6: Invest in low-cost index fund with remaining surplus. STUDENT LOAN EMERGENCY: If you are behind on student loans, act immediately. Contact your servicer or call 1-800-4-FED-AID. Apply for income-driven repayment (IDR) which can reduce payments to $0 if income is below 225% of the federal poverty level. FREE DEBT HELP: CFPB consumerfinance.gov | NFCC nfcc.org | studentaid.gov | HUD housing counsellors hud.gov.
Conclusion
The US household debt map in 2026 tells two simultaneous stories. Story one: $18.8 trillion in debt is a record, but much of it reflects the accumulation of assets -- the $13.19 trillion in mortgage debt is collateralised by trillions in housing equity, and homeowners who bought before 2022 at sub-4% rates have seen their properties appreciate significantly. The debt-to-asset ratio of US households, while elevated, is not at crisis levels for the majority who are current on payments.Story two: the concentration of stress signals in specific categories, generations, and geographies reveals acute vulnerability beneath the aggregate record. Student loan delinquency at 10.3% and rising, with 2.6 million borrowers already in Default Resolution. Gen X carrying the highest non-mortgage debt of any generation at exactly the years when retirement preparation is most critical. Mortgage delinquency concentrated in lower-income areas and declining-price markets. Credit card debt at a record $1.3 trillion accruing interest at 22.3% average APR.
The Federal Reserve Bank of New York (May 12, 2026): 'Aggregate delinquency showed little change, with transitions into early delinquency holding steady for auto loans and ticking down for credit cards and mortgages.' The system-wide delinquency signal is not yet alarming. But the student loan data represents a significant and rapidly worsening exception. EducationData.org (2 weeks ago): 'From 2010 through 2020, student loan debt had a CAGR of 7.44%.' The two decades of student loan expansion, followed by a pandemic pause that suspended but did not resolve repayment, and now a delinquency rate back above 10%, represent a structural debt challenge that the national aggregate numbers alone do not convey. The debt map is a record. For millions of Americans, it is also a crisis.
Frequently Asked Questions (FAQ)
What is the total US household debt in 2026?The total US household debt reached $18.8 trillion in the first quarter of 2026, according to the Federal Reserve Bank of New York's Quarterly Household Debt and Credit Report released on May 12, 2026. This represents an increase of $18 billion (0.1%) from the prior quarter and a 3.24% increase compared to Q1 2025 (WalletHub, June 24, 2026). The composition: mortgage debt accounts for $13.19 trillion (70.2% of total), representing the largest single category. Credit card debt stands at a record $1.3 trillion. Student loan debt is $1.65-$1.66 trillion. Auto loan debt is $1.67 trillion. HELOC balances are $434 billion. EducationData.org (2 weeks ago -- most current): mortgages represent approximately 70% of all household debt, with federal student loans representing 8.96%, auto loans 8.57%, and credit cards approximately 6.7%. The $18.8 trillion figure is not a one-time spike but the latest in a long-term trend: total household debt was $7.23 trillion in 2003, meaning it has grown 160% in 23 years. Motley Fool (May 12, 2026): 'The New York Fed's quarterly Household Debt and Credit Survey shows that total consumer debt stands at $18.8 trillion as of Q1 2026.' For context: this figure exceeds US GDP of approximately $28-29 trillion by a significant margin, though household debt-to-GDP is typically used as a financial stability metric alongside the net worth and asset holdings that offset much of this debt.
Which generation carries the most debt in the US in 2026?
The answer depends on whether you measure by total debt or average individual debt, and what types of debt are included. By total aggregate debt: WalletHub (June 24, 2026) reports that individuals aged 40-49 held the highest share at $4.92 trillion in Q1 2026, of which $3.60 trillion was mortgage debt. By average individual debt across non-mortgage categories: Gen X (born approximately 1965-1980) carries the highest average balances. Motley Fool (May 2026): 'Generation X carries the highest average balance across auto loans, credit cards, and total non-mortgage debt. Gen X credit card balances are at least 24% higher than millennials' and 35% higher than baby boomers'.' WalletHub: Gen X average credit card debt: $9,600; average auto loan: $27,836. For mortgage debt specifically: Millennials carry the highest average mortgage balance at $324,272, reflecting their current position in peak homebuying years at today's elevated prices. Gen Z has the lowest absolute debt but the fastest credit card balance growth rate (2.52% year-over-year increase) -- a concerning signal for the trajectory of the youngest adult cohort. EducationData.org (2 weeks ago): 'Borrowers aged 70+ years owe a collective $1.86 trillion in Q1 2026, including $1.36 trillion in mortgage debt' -- indicating significant housing debt persisting into late retirement age.
How bad is the student loan delinquency problem in 2026?
The student loan delinquency situation in 2026 is a significant and worsening crisis. Federal Reserve Bank of New York (May 12, 2026 -- most current): 'The student loan delinquency rate increased to 10.3% of balances 90+ days delinquent, up from the 9.6% observed in Q4 2025. Approximately 2.6 million student loan borrowers who were more than 120 days past due had their loans transferred to the U.S. Department of Education's Default Resolution Group.' This represents a rapid deterioration in just one quarter (0.7 percentage point increase) and is occurring against a backdrop of $1.65-$1.66 trillion in total student loan debt. The historical context: during the COVID-era payment pause (March 2020-September 2023), reported delinquency rates were essentially zero because no payments were required and delinquencies were not being reported. The re-entry into active repayment since October 2023 has exposed a population of borrowers who either cannot afford their payments or did not resume payments after the pause ended. Experian (March 2026): 'Ongoing changes in federal student loan debt repayment plans since the start of the pandemic in 2020 continue into 2026. Changes to income-based repayment plans (on top of the student loan onramp that ended in 2025) put reported student loan debt data in flux.' For borrowers at risk of delinquency or in delinquency: contact your servicer immediately, apply for income-driven repayment at studentaid.gov (payments can be $0 if income qualifies), and do not ignore your loans -- default triggers wage garnishment, tax refund seizure, and credit score destruction.
What states have the highest household debt in the US?
WalletHub (June 24, 2026) provides 'Average Consumer Debt by State' in their comprehensive Q1 2026 debt statistics report. The geographic pattern of US household debt closely follows housing costs: states with the highest home prices produce the highest mortgage debt averages, which drive the total household debt average. States that consistently appear at the top of average consumer debt rankings include Hawaii (highest median home prices in the nation at over $900,000, driving mortgage balances substantially above the $269,562 national average), California (median home prices above $800,000 in many markets), Washington DC and Maryland/Virginia (the DC metro area has among the highest home prices in the country combined with high student loan concentrations from the graduate degree-heavy professional population), and Connecticut and New Jersey (high housing costs in the Northeast). However, high debt does not equal high financial distress: in these high-cost states, income levels are also elevated, meaning the debt-to-income ratio may be similar to lower-debt states. The most financially stressed states -- where debt levels are high relative to income -- include areas of the Southeast and Midwest where student loan burdens are high relative to the income premium from the degree, and where payday lending and auto loan vulnerability is more pronounced. Federal Reserve Bank of New York (May 2026): mortgage delinquency deterioration is 'concentrated in lower-income areas and in areas with declining home prices' -- patterns visible in parts of the Rust Belt, rural America, and specific Sun Belt markets that experienced the fastest price appreciation and are now seeing correction.
What is the fastest-growing type of debt in the US?
By growth rate since 2020, auto loan debt is the fastest growing major debt category. EducationData.org (2 weeks ago -- most current): 'Auto loan debt grew 146% faster than student loan debt from 2020 to 2026.' The $1.67 trillion in auto loan balances represents the product of several converging forces: new vehicle prices hit record highs in 2021-2023 (supply chain disruption, chip shortage, and pandemic-era demand), pushing average transaction prices above $48,000 at peak; interest rates on auto loans rose sharply from 2022, increasing the total cost of borrowing; and the shift toward longer loan terms (72-84 months) increased the total balance per loan while reducing monthly payments. In the most recent quarters, credit card debt has been growing rapidly in both absolute and proportional terms. Federal Reserve Bank of New York (Q3 2025 data via Statista, December 2025): 'HELOC loans and credit card debt growing the fastest in relative terms at 2.7 and 2.0 percent compared to the previous quarter and 9.0 and 5.7 percent year-over-year respectively.' The $1.3 trillion credit card record in Q1 2026 reflects 5-9% year-over-year growth. Mortgage debt also grew rapidly in absolute dollar terms -- $21 billion in Q1 2026 alone -- reflecting both new originations and the elevated price of the underlying assets. Student loan debt is growing more slowly at approximately 2.5% annually (Experian, March 2026), though the delinquency rate is rising much faster than the balance growth.

0 Comments Comments