

Real Estate
UK House Prices 2026: Latest Data and Property Forecast

The UK property market in 2026 is not one market. It is a collection of diverging local stories held together by a single national index that struggles to represent any of them accurately. Average UK house prices are broadly flat to mildly positive depending on which index you consult — the Land Registry puts annual growth at 2.0%, Nationwide at 1.6%, and Lloyds (formerly Halifax) at just 0.1%, all as of recent 2026 data. But behind those national numbers, Northern Ireland is posting annual price growth of 7.4%, Scotland is up 3.9%, the North East is up 2.8% — while London is down 1.1%, the South East is down 2.0%, and Eastern England is falling 1.6%. Savills, which started 2026 forecasting a 2.5% rise nationally, had by June revised that to a 2% fall. Rightmove downgraded its forecast in August to between 0% and -2%. The question ‘what is happening to UK house prices?’ no longer has a single answer. This article assembles the latest data from every major index, explains the forces driving the regional divergence, and gives buyers, sellers, and investors the honest picture heading into the final quarter of 2026. Not financial, mortgage, or property advice.
None of these figures is wrong. They measure different things, use different methodologies, and cover different property types and geographies. What they collectively describe is a UK housing market that is flat to marginally positive at the national level — with significant regional variation underneath that surface. As of September 2026, the Lloyds index shows prices broadly unchanged on the month (0.0%) following a recovery of +0.2% in June, while the Nationwide records +0.2% month-on-month and +1.6% year-on-year for August. These are not the conditions of a booming market, nor the conditions of a collapse. They are the conditions of a market under sustained affordability pressure, navigating elevated mortgage rates, and splitting along a north-south axis that has become the defining feature of UK property in 2026.
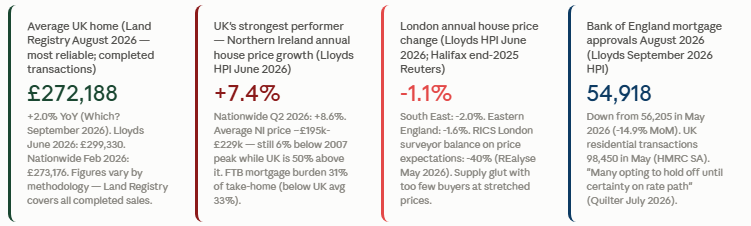
Key national figures (October 2026): Land Registry average UK home: £272,188, +2.0% YoY (Which? September 2026). Nationwide (August 2026): +0.2% MoM, +1.6% YoY. Lloyds (July 2026): 0.0% MoM, +0.1% YoY. Nationwide annual growth (June 2026): 2.2%. Halifax-era 2025 full year: 0.7% growth to record £299,892 (Halifax/Financial Reporter). UK prices 50% above 2007 peak (Nationwide). Sources cited. Not financial or property advice.
The HomeOwners Alliance compared forecasts versus outcomes directly: Rightmove’s forecast for 2025 was a 4% rise in prices. The actual outcome was 0.6% (Nationwide) and 0.3% (Halifax). The lesson: asking price forecasts tend to overestimate, while mortgage-based indices lag the market turn. For the most grounded view of what is actually happening — as opposed to what sellers are hoping or lenders are approving — the Land Registry is the anchor. Not property or financial advice.
REalyse’s May 2026 analysis described the RICS’ surveyors’ price expectation readings as sharply negative for London (−40%) versus positive for Northern Ireland, Scotland, and the North West. The Quilter/Lloyds July 2026 commentary described ‘stark’ regional differences, with ‘stronger price growth concentrated in the North while the South has continued to struggle.’ Rightmove property expert Colleen Babcock said 2026 ‘will feel very different depending on location and price bracket’ (REalyse, May 2026). Not property advice.
The first-time buyer affordability picture in NI supports this: Nationwide’s Q2 2026 data shows that the mortgage payment on a typical first-time buyer property in Northern Ireland is equivalent to 31% of an average earner’s take-home pay — below the UK average of 33%. REalyse noted that this value proposition has attracted both local first-time buyers and cross-border investors seeking stronger rental yields than are available in southern England. The growth is not without limits: affordability is tightening as prices rise faster than wages, and the Lloyds September 2026 HPI notes NI remains the UK’s leader but supply constraints will eventually moderate the growth rate. Not property advice.
Northern Ireland 2026 snapshot: +7.4-8.6% annual growth (Lloyds/Nationwide). Average price £195,000-£229,000. FTB mortgage burden: 31% of take-home vs UK avg 33% (Nationwide Q2 2026). Still 6% below 2007 peak despite years of growth (Nationwide). Primary driver: affordability advantage vs rest of UK. Risk: supply constraints; tightening affordability as prices rise. Sources: Lloyds June/September 2026 HPI; Nationwide Q2 2026; REalyse May 2026. Not property or financial advice.
The mechanism is not mystery. A buyer in London paying £653 per square foot (REalyse, May 2026) faces a fundamentally different affordability calculation to a buyer in Northern Ireland. The Quilter/Lloyds July 2026 commentary described the southern market directly: ‘In southern areas a glut of supply is attracting too few serious buyers, and this is steadily driving prices down.’ Property Investor Today noted in July 2026 that Manchester has overtaken London as the UK’s most sought-after buy-to-let location — a shift that encapsulates the direction of investor sentiment. Even the Bank of England’s rate environment, with higher-for-longer mortgage rates following the Iran-conflict-related inflation concerns cited in HomeOwners Alliance’s coverage, has hit the high-end London market harder than the more affordable north, because affordability pressure is multiplicative: high prices plus high rates creates an impossible affordability equation that fewer buyers can solve.
London market caution: London prices are down 1.1% annually (Lloyds June 2026). RICS surveyor balance on London price expectations: -40% (REalyse May 2026). Supply glut in southern regions is a persistent near-term headwind. Higher mortgage rates disproportionately impact high-price areas. Source: Lloyds HPI June/September 2026; REalyse May 2026; Property Investor Today July 2026. Not property or financial advice. Past price falls do not guarantee future direction.
The impact on lending data is clear. Bank of England mortgage approvals for house purchase fell 14.9% to 56,205 in May 2026 per Lloyds’ June HPI, and fell further to 54,918 in August 2026 (Lloyds September HPI). UK residential transactions fell 2.0% to 98,450 in May 2026 (HMRC seasonally adjusted, cited Lloyds June HPI). The Quilter commentary on Lloyds’ June data noted that ‘many are opting to hold off on making any big moves until they have more certainty around the path of interest rates.’ The Lloyds September 2026 HPI described ‘a period of higher mortgage rates, which has been driven by changing expectations around the future path of interest rates,’ with wider economic uncertainty making buyers more cautious. Residential construction starts also fell sharply in Q2 2026 (Property Investor Today), which reduces new supply but also signals developer confidence concerns. Not property or financial advice.
Halifax’s end-2025 data, cited by Reuters and BBC, noted the house price to income ratio was at its lowest in over a decade in December 2025 — a genuinely meaningful affordability improvement driven by wages rising faster than house prices. But the mid-2026 mortgage rate rises have partially reversed this improvement. The Lloyds September 2026 HPI specifically highlights the government’s new ‘Your First Home’ scheme for England as a support mechanism alongside the growing availability of low-deposit mortgage products from lenders. The Nationwide’s Q2 2026 regional data points to Northern Ireland as the most accessible market for first-time buyers, where the mortgage burden at 31% of average take-home pay compares favourably with the UK average of 33%. Not financial or mortgage advice.
By mid-2026, that consensus had fractured. Savills updated its forecast at the start of June to a 2% fall — a shift of nearly 5 percentage points from its start-of-year position. Rightmove downgraded its 2026 forecast in August to between 0% and -2%. Zoopla reduced its forecast to a 1% rise. The triggers cited across multiple sources were the same: elevated mortgage rates following geopolitical uncertainty around the Iran conflict; softening demand in southern England; and cautious buyer behaviour in the face of rate uncertainty. Halifax/Lloyds and Nationwide maintained their original directional guidance — gradual growth — without updating the specific percentage ranges publicly. The HomeOwners Alliance, citing Paula Higgins, maintains that ‘UK house prices are likely to be around 2% higher in 2026, as easing mortgage rates and steady wage growth slowly improve affordability.’ Not property advice.
2026 forecast summary (as of October 2026): Halifax/Lloyds: +1% to +3% (maintained original). Nationwide: +2% to +4% (maintained original). Rightmove: downgraded to 0% to -2% (August 2026). Savills: downgraded to -2% (June 2026). Zoopla: reduced to +1% (September 2026). Reuters Dec 2025 poll: +2.8%. HOA/Paula Higgins: ~+2%. Actual YTD: broadly flat to +2% depending on index and region. Northern Ireland: significantly outperforming all forecasts at +7.4%. London/South East: underperforming at -1% to -2%. Sources cited. Not financial or property advice.
Second, the supply-demand imbalance. In northern England, Northern Ireland, Scotland, and Wales, a relative scarcity of supply relative to demand — driven by new first-time buyer and investor interest — is supporting prices. In southern England and London, the inverse applies: supply has increased faster than demand can absorb it at current affordability levels, producing the price falls Lloyds and the RICS data are documenting. Residential construction starts fell sharply in Q2 2026 (Property Investor Today), which reduces new supply and may eventually support prices in over-supplied southern markets — but not immediately.
Third, wage growth. The Nationwide’s Robert Gardner noted that ‘price growth well below the rate of earnings growth and a steady decline in mortgage rates’ eased affordability in 2025. Wage growth continuing to outpace price growth in the north supports both buyers and market confidence in those regions. Fourth, policy: the stamp duty changes that took effect in April 2025 created a transactional bulge before the deadline, followed by quieter conditions afterwards. The ‘Your First Home’ scheme and expanding low-deposit mortgage availability are both policy levers supporting the first-time buyer segment specifically. Not property advice.
For sellers: the market you are selling in matters far more than the headline national number. In the North and Northern Ireland, demand is real and buyer pools are active. In southern England and London, pricing accurately and competitively is more important than it has been in a decade. Overpricing in a market with a supply glut will mean a property sits unsold, and price reductions are more visible and damaging to negotiating position than a realistic initial price. The Quilter commentary noted that mortgage rate uncertainty is making buyers more cautious — sellers who can offer certainty (clear chain, motivated transaction, realistic price) are in a stronger position than those holding out for a peak-market valuation. Not property or financial advice.
2026 market summary for movers: Buyers in the North/NI: active market, rising prices, first-time buyer schemes available — timing is reasonably favourable. Buyers in London/South East: prices falling, negotiating power shifting to buyers for the first time in years — take your time and negotiate. Sellers in the North/NI: real demand, active buyer pools — price accurately and move quickly. Sellers in London/South East: supply glut, fewer buyers, elevated price sensitivity — price competitively from day one. All: get an independent mortgage broker's view on rates before committing. Not property, mortgage, or financial advice.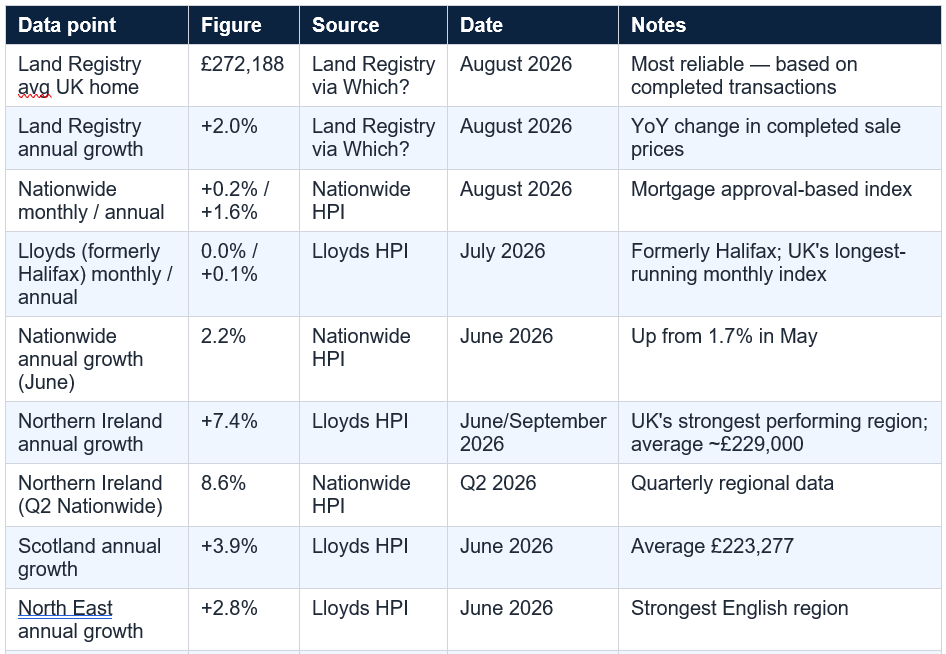
What the data does tell you clearly: UK house prices are not in freefall. The catastrophic crash that some feared in 2022-2023, when mortgage rates spiked to 5-6%, did not materialise. Instead, the market has split along an affordability fault line, with cheaper northern regions and devolved nations outperforming as first-time buyers and investors rotate away from unaffordable southern markets. Forecasters who predicted uniform 2-4% national growth have been wrong about the distribution, if not always the direction. The honest 2026 picture is a market navigating sustained affordability pressure, rate uncertainty, and regional divergence — conditions that reward buyers and sellers who understand their specific local market rather than those who trade on the national headline.
Not financial, mortgage, or property advice. Verify current figures at Land Registry (landregistry.data.gov.uk), Nationwide (nationwide.co.uk/hpi), Lloyds (lloydsbank.com/hpi), and Bank of England (bankofengland.co.uk) before making any property decisions. Consult a qualified independent financial adviser (IFA) or FCA-regulated mortgage broker.
The answer depends heavily on where you are in the country. Nationally, prices are broadly flat to marginally positive: the Land Registry shows +2.0% annual growth (August 2026), Nationwide shows +1.6% (August 2026), and Lloyds (formerly Halifax) shows +0.1% (July 2026). But behind these national averages lies significant regional divergence. Northern Ireland is up 7.4% (Lloyds June 2026 HPI) and 8.6% year-on-year in Q2 2026 (Nationwide). Scotland is up 3.9%. The North East of England is up 2.8%. In contrast, London is down 1.1%, the South East is down 2.0%, and Eastern England is down 1.6% (Lloyds HPI). So the correct answer is: prices are rising in the North and falling in parts of the South, with a flat national average that describes neither region accurately. Sources: Lloyds HPI June/September 2026; Nationwide HPI; Which? September 2026; Land Registry. Not property advice.
What is the average UK house price in 2026?
It depends on the index used. The Land Registry — which measures completed transaction prices and is widely considered the most reliable source — showed the average UK home at £272,188 with annual growth of 2.0% in August 2026 (Which? September 2026). The Nationwide index reported an average UK house price of £273,176 in February 2026, with annual growth picking up to 2.2% in June. The Lloyds House Price Index (formerly Halifax) reported an average of £299,330 in June 2026. The different figures reflect different methodologies: Lloyds and Nationwide capture only properties purchased with their own mortgages; the Land Registry covers all completed sales. Halifax reported the average UK home reached a record high of £299,892 in 2025 (full year annual growth 0.7%). Sources: Land Registry via Which? September 2026; Lloyds HPI June 2026; Nationwide February 2026; Halifax/Financial Reporter. Not financial or property advice.
Why are Northern Ireland house prices rising so fast?
Northern Ireland is experiencing the strongest annual house price growth in the UK — 7.4-8.6% in 2026 — for two intersecting reasons. First, a structural affordability advantage: despite years of growth, NI prices remain around 6% below their 2007 all-time high, while UK prices overall are almost 50% above that benchmark (Nationwide 2025 review). Average NI prices of approximately £195,000-£229,000 are a fraction of London's £601,000 or even the southern England average. Second, the value proposition attracts both local first-time buyers (mortgage payments at 31% of take-home pay, below the UK average of 33% per Nationwide Q2 2026) and cross-border investors seeking stronger yields than available in southern England (REalyse May 2026). The smaller market size means new supply has less price-diluting effect than in England. Sources: Lloyds HPI June 2026; Nationwide Q2 2026 HPI; REalyse May 2026. Not financial or property advice.
What are the UK house price forecasts for the rest of 2026?
Forecasts have been substantially revised downward from start-of-year expectations. Halifax/Lloyds forecast 1-3% growth for 2026 (maintained); Nationwide forecast 2-4% (maintained); Rightmove downgraded its forecast in August 2026 to between 0% and -2%; Savills revised from +2.5% to -2% in June 2026; Zoopla reduced to +1% (Which? September 2026). The HomeOwners Alliance's Paula Higgins maintains ~2% growth is likely. The Reuters poll of property experts from December 2025 expected 2.8%. The revisions reflect elevated mortgage rates following geopolitical uncertainty, a supply glut in southern England, and cautious buyer behaviour. Most economists cited still expect further Bank of England rate cuts later in 2026, which would support affordability and volumes. The wide spread of forecasts (from -2% to +4%) reflects genuine uncertainty. Sources: Which? September 2026; Financial Reporter; HOA; Property Industry Eye. Not financial or property advice.
What does the UK housing market mean for first-time buyers in 2026?
The picture for first-time buyers in 2026 is regionally split. The average first-time buyer property costs £240,433 nationally in June 2026 (Lloyds HPI), with annual price growth of +0.8% — below the whole-market average, suggesting some relative affordability improvement. The house price to income ratio was at its lowest in over a decade at end-2025 (Halifax via Reuters), driven by earnings growth outpacing house prices. However, mortgage rate rises in mid-2026 have partially offset this improvement. Northern Ireland offers the most accessible conditions: mortgage payments on a typical FTB property equal 31% of average take-home pay, below the UK average of 33% (Nationwide Q2 2026). London and the South remain challenging. Government support includes the new 'Your First Home' scheme for England and expanding availability of low-deposit mortgage products (Lloyds September 2026 HPI). Sources: Lloyds HPI June/September 2026; Nationwide Q2 2026; Halifax via Reuters. Not financial, mortgage, or property advice. Consult an FCA-regulated mortgage broker.
Table of Contents
- The Headline Numbers: What the Major Indices Are Showing
- Why the Indices Disagree — and Which One to Trust
- The Great North-South Divide: Regional Data in Full
- Northern Ireland: The Story of the Year
- London and the South: Why Prices Are Falling
- The Mortgage Market: Rates, Approvals, and What’s Actually Happening to Demand
- First-Time Buyers: Affordability in 2026
- The Forecasters’ Dilemma: How 2026 Predictions Evolved
- What Is Driving UK House Prices in 2026?
- The Buyer’s and Seller’s Honest Guide to the 2026 Market
- The 2026 UK Property Data Summary Table
- Conclusion: Two Markets. One Index. Read the One That Applies to You.
- Frequently Asked Questions
The Headline Numbers: What the Major Indices Are Showing
UK house prices in 2026 depend almost entirely on which index you read and which month you check it. The Land Registry — the most reliable barometer because it is based on completed property sales rather than lending or asking prices — shows the average UK home at £272,188 in August 2026, with annual growth of 2.0% (Which?, September 2026). The Nationwide index, which uses mortgage approval data, recorded UK annual house price growth of 2.2% in June 2026, ticking up from 1.7% in May. The Lloyds House Price Index — formerly the Halifax HPI, rebranded in 2026 — put the average UK property price at £299,330 in June 2026, with annual growth of just 0.6%.None of these figures is wrong. They measure different things, use different methodologies, and cover different property types and geographies. What they collectively describe is a UK housing market that is flat to marginally positive at the national level — with significant regional variation underneath that surface. As of September 2026, the Lloyds index shows prices broadly unchanged on the month (0.0%) following a recovery of +0.2% in June, while the Nationwide records +0.2% month-on-month and +1.6% year-on-year for August. These are not the conditions of a booming market, nor the conditions of a collapse. They are the conditions of a market under sustained affordability pressure, navigating elevated mortgage rates, and splitting along a north-south axis that has become the defining feature of UK property in 2026.
Key national figures (October 2026): Land Registry average UK home: £272,188, +2.0% YoY (Which? September 2026). Nationwide (August 2026): +0.2% MoM, +1.6% YoY. Lloyds (July 2026): 0.0% MoM, +0.1% YoY. Nationwide annual growth (June 2026): 2.2%. Halifax-era 2025 full year: 0.7% growth to record £299,892 (Halifax/Financial Reporter). UK prices 50% above 2007 peak (Nationwide). Sources cited. Not financial or property advice.
Why the Indices Disagree — and Which One to Trust
Three major UK house price indices exist alongside the Land Registry’s official measure, and they produce meaningfully different figures because they measure meaningfully different things. The Land Registry UK House Price Index uses actual completed property transactions — the final sale price, registered with HMRC — making it the most accurate reflection of what buyers are actually paying, but with a two-to-three-month data lag. Nationwide and Lloyds (formerly Halifax) both produce monthly indices based on mortgage lending data from their own approved loans, giving more timely but geographically and demographically sampler-biased results (they only capture purchases with Nationwide or Lloyds mortgages). Rightmove publishes asking price data — which is the earliest signal in the pipeline but the furthest from actual sale prices.The HomeOwners Alliance compared forecasts versus outcomes directly: Rightmove’s forecast for 2025 was a 4% rise in prices. The actual outcome was 0.6% (Nationwide) and 0.3% (Halifax). The lesson: asking price forecasts tend to overestimate, while mortgage-based indices lag the market turn. For the most grounded view of what is actually happening — as opposed to what sellers are hoping or lenders are approving — the Land Registry is the anchor. Not property or financial advice.
The Great North-South Divide: Regional Data in Full
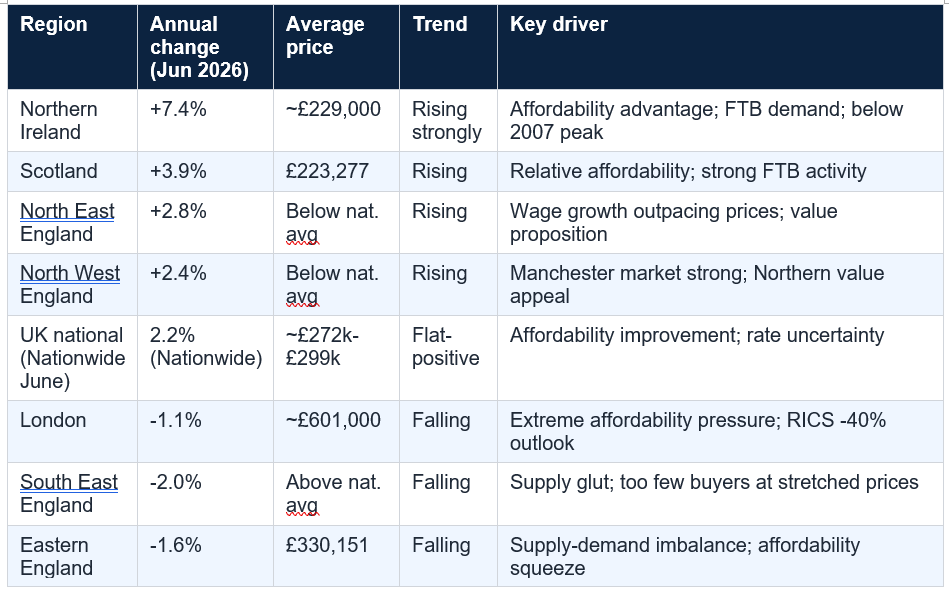
The single most important story in UK property in 2026 is the regional divergence between the north and south of the country. It is not subtle. Lloyds’ June 2026 House Price Index — the most current regional breakdown available — shows the following annual changes: Northern Ireland +7.4% (£229,000 average); Scotland +3.9% (£223,277 average); North East England +2.8%; North West England +2.4%. Against that: South East England -2.0%; London -1.1%; Eastern England -1.6% (£330,151 average, per September 2026 Lloyds data). The Nationwide’s Q2 2026 regional data confirms: average house price growth in Southern England was broadly stable at 0.7%, compared with significantly stronger performance in the north and the devolved nations.REalyse’s May 2026 analysis described the RICS’ surveyors’ price expectation readings as sharply negative for London (−40%) versus positive for Northern Ireland, Scotland, and the North West. The Quilter/Lloyds July 2026 commentary described ‘stark’ regional differences, with ‘stronger price growth concentrated in the North while the South has continued to struggle.’ Rightmove property expert Colleen Babcock said 2026 ‘will feel very different depending on location and price bracket’ (REalyse, May 2026). Not property advice.
Northern Ireland: The Story of the Year
Northern Ireland is, by a significant margin, the strongest performing housing market in the United Kingdom in 2026. Annual house price growth reached 8.6% in Q2 2026 per Nationwide’s quarterly regional data, with Lloyds recording +7.4% across multiple months. REalyse’s May 2026 analysis put average NI prices at approximately £195,000 (ONS data) with Lloyds’ June index putting the average at £229,000. Despite these significant price gains, Nationwide’s 2025 review notes that NI prices are still around 6% below the all-time high recorded in 2007 — while UK prices overall are almost 50% above that same benchmark. Northern Ireland never fully recovered from the post-2007 crash, which has left it with a structural affordability advantage that is now driving the UK’s strongest price growth.The first-time buyer affordability picture in NI supports this: Nationwide’s Q2 2026 data shows that the mortgage payment on a typical first-time buyer property in Northern Ireland is equivalent to 31% of an average earner’s take-home pay — below the UK average of 33%. REalyse noted that this value proposition has attracted both local first-time buyers and cross-border investors seeking stronger rental yields than are available in southern England. The growth is not without limits: affordability is tightening as prices rise faster than wages, and the Lloyds September 2026 HPI notes NI remains the UK’s leader but supply constraints will eventually moderate the growth rate. Not property advice.
Northern Ireland 2026 snapshot: +7.4-8.6% annual growth (Lloyds/Nationwide). Average price £195,000-£229,000. FTB mortgage burden: 31% of take-home vs UK avg 33% (Nationwide Q2 2026). Still 6% below 2007 peak despite years of growth (Nationwide). Primary driver: affordability advantage vs rest of UK. Risk: supply constraints; tightening affordability as prices rise. Sources: Lloyds June/September 2026 HPI; Nationwide Q2 2026; REalyse May 2026. Not property or financial advice.
London and the South: Why Prices Are Falling
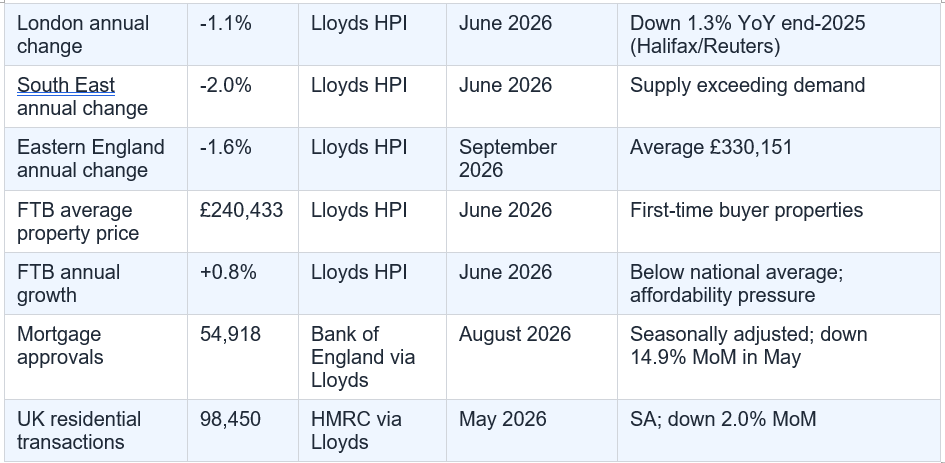
London’s house price experience in 2026 is almost the mirror image of Northern Ireland’s. Annual prices are down 1.1% per the Lloyds June 2026 HPI, following a fall of 1.3% year-on-year in end-2025 data cited by Reuters and BBC. The South East is down 2.0% and Eastern England is down 1.6% (Lloyds September 2026). RICS’ residential market survey’s net balance for London surveyors on price expectations was −40% as of May 2026 (REalyse) — meaning 40% more surveyors expected prices to fall than rise in the capital.The mechanism is not mystery. A buyer in London paying £653 per square foot (REalyse, May 2026) faces a fundamentally different affordability calculation to a buyer in Northern Ireland. The Quilter/Lloyds July 2026 commentary described the southern market directly: ‘In southern areas a glut of supply is attracting too few serious buyers, and this is steadily driving prices down.’ Property Investor Today noted in July 2026 that Manchester has overtaken London as the UK’s most sought-after buy-to-let location — a shift that encapsulates the direction of investor sentiment. Even the Bank of England’s rate environment, with higher-for-longer mortgage rates following the Iran-conflict-related inflation concerns cited in HomeOwners Alliance’s coverage, has hit the high-end London market harder than the more affordable north, because affordability pressure is multiplicative: high prices plus high rates creates an impossible affordability equation that fewer buyers can solve.
London market caution: London prices are down 1.1% annually (Lloyds June 2026). RICS surveyor balance on London price expectations: -40% (REalyse May 2026). Supply glut in southern regions is a persistent near-term headwind. Higher mortgage rates disproportionately impact high-price areas. Source: Lloyds HPI June/September 2026; REalyse May 2026; Property Investor Today July 2026. Not property or financial advice. Past price falls do not guarantee future direction.
The Mortgage Market: Rates, Approvals, and What’s Actually Happening to Demand
The mortgage market in 2026 has had a turbulent year. Rates fell gradually through late 2025 and into early 2026 as the Bank of England reduced its base rate, creating an environment of cautious optimism for buyers. Then geopolitical events — specifically the Iran conflict referenced in HomeOwners Alliance’s coverage and in Which?’s reporting — shifted market expectations for inflation and the Bank of England’s rate path, pushing swap rates and mortgage rates higher again.The impact on lending data is clear. Bank of England mortgage approvals for house purchase fell 14.9% to 56,205 in May 2026 per Lloyds’ June HPI, and fell further to 54,918 in August 2026 (Lloyds September HPI). UK residential transactions fell 2.0% to 98,450 in May 2026 (HMRC seasonally adjusted, cited Lloyds June HPI). The Quilter commentary on Lloyds’ June data noted that ‘many are opting to hold off on making any big moves until they have more certainty around the path of interest rates.’ The Lloyds September 2026 HPI described ‘a period of higher mortgage rates, which has been driven by changing expectations around the future path of interest rates,’ with wider economic uncertainty making buyers more cautious. Residential construction starts also fell sharply in Q2 2026 (Property Investor Today), which reduces new supply but also signals developer confidence concerns. Not property or financial advice.
First-Time Buyers: Affordability in 2026
First-time buyers occupy a specific and important position in the 2026 property market. Their average purchase price has remained relatively stable: £240,433 in June 2026, easing to £236,779 by September 2026 (Lloyds HPI). Annual price growth for first-time buyer properties was +0.8% in June — below the national average for all buyers, reflecting the affordability pressure on the segment most sensitive to price. The Nationwide noted that first-time buyer activity continued to rise as a share of purchases during 2025, supported by earnings growth outpacing house price inflation.Halifax’s end-2025 data, cited by Reuters and BBC, noted the house price to income ratio was at its lowest in over a decade in December 2025 — a genuinely meaningful affordability improvement driven by wages rising faster than house prices. But the mid-2026 mortgage rate rises have partially reversed this improvement. The Lloyds September 2026 HPI specifically highlights the government’s new ‘Your First Home’ scheme for England as a support mechanism alongside the growing availability of low-deposit mortgage products from lenders. The Nationwide’s Q2 2026 regional data points to Northern Ireland as the most accessible market for first-time buyers, where the mortgage burden at 31% of average take-home pay compares favourably with the UK average of 33%. Not financial or mortgage advice.
The Forecasters’ Dilemma: How 2026 Predictions Evolved
The story of 2026 house price forecasts is the story of a market that surprised forecasters in both directions. At the start of 2026, the consensus was cautiously positive: Halifax forecast 1-3% growth; Nationwide forecast 2-4%; Rightmove and Savills predicted around 2-2.5% rises; Zoopla estimated 1.5%; and a Reuters poll of property market experts in December 2025 showed expectations of 2.8% growth in 2026. These were not bullish forecasts, but they were directionally consistent.By mid-2026, that consensus had fractured. Savills updated its forecast at the start of June to a 2% fall — a shift of nearly 5 percentage points from its start-of-year position. Rightmove downgraded its 2026 forecast in August to between 0% and -2%. Zoopla reduced its forecast to a 1% rise. The triggers cited across multiple sources were the same: elevated mortgage rates following geopolitical uncertainty around the Iran conflict; softening demand in southern England; and cautious buyer behaviour in the face of rate uncertainty. Halifax/Lloyds and Nationwide maintained their original directional guidance — gradual growth — without updating the specific percentage ranges publicly. The HomeOwners Alliance, citing Paula Higgins, maintains that ‘UK house prices are likely to be around 2% higher in 2026, as easing mortgage rates and steady wage growth slowly improve affordability.’ Not property advice.
2026 forecast summary (as of October 2026): Halifax/Lloyds: +1% to +3% (maintained original). Nationwide: +2% to +4% (maintained original). Rightmove: downgraded to 0% to -2% (August 2026). Savills: downgraded to -2% (June 2026). Zoopla: reduced to +1% (September 2026). Reuters Dec 2025 poll: +2.8%. HOA/Paula Higgins: ~+2%. Actual YTD: broadly flat to +2% depending on index and region. Northern Ireland: significantly outperforming all forecasts at +7.4%. London/South East: underperforming at -1% to -2%. Sources cited. Not financial or property advice.
What Is Driving UK House Prices in 2026?
Behind the index numbers are four structural forces that explain both the national stagnation and the regional divergence. First, the affordability equation. The house price to income ratio improved meaningfully through 2025, as wages grew faster than prices and mortgage rates declined. This provided a foundation of genuine demand heading into 2026. The partial reversal of mortgage rate declines in mid-2026 has put that improvement under pressure but has not eliminated it in lower-price regions.Second, the supply-demand imbalance. In northern England, Northern Ireland, Scotland, and Wales, a relative scarcity of supply relative to demand — driven by new first-time buyer and investor interest — is supporting prices. In southern England and London, the inverse applies: supply has increased faster than demand can absorb it at current affordability levels, producing the price falls Lloyds and the RICS data are documenting. Residential construction starts fell sharply in Q2 2026 (Property Investor Today), which reduces new supply and may eventually support prices in over-supplied southern markets — but not immediately.
Third, wage growth. The Nationwide’s Robert Gardner noted that ‘price growth well below the rate of earnings growth and a steady decline in mortgage rates’ eased affordability in 2025. Wage growth continuing to outpace price growth in the north supports both buyers and market confidence in those regions. Fourth, policy: the stamp duty changes that took effect in April 2025 created a transactional bulge before the deadline, followed by quieter conditions afterwards. The ‘Your First Home’ scheme and expanding low-deposit mortgage availability are both policy levers supporting the first-time buyer segment specifically. Not property advice.
The Buyer’s and Seller’s Honest Guide to the 2026 Market
For buyers: the most important variable is not the national average. It is the specific local market you are buying in, the mortgage rate you are being offered today, and the time horizon over which you plan to hold the property. In Northern Ireland, Scotland, and the northern regions of England, buyer conditions favour action — prices are rising, affordability is better than the UK average, and both the first-time buyer market and investment market are active. In London and the South East, the picture is more complex: prices are falling, supply is elevated, and negotiating power has shifted to buyers for the first time in years. If you are a buyer in a falling southern market, patience and price negotiation are in your favour.For sellers: the market you are selling in matters far more than the headline national number. In the North and Northern Ireland, demand is real and buyer pools are active. In southern England and London, pricing accurately and competitively is more important than it has been in a decade. Overpricing in a market with a supply glut will mean a property sits unsold, and price reductions are more visible and damaging to negotiating position than a realistic initial price. The Quilter commentary noted that mortgage rate uncertainty is making buyers more cautious — sellers who can offer certainty (clear chain, motivated transaction, realistic price) are in a stronger position than those holding out for a peak-market valuation. Not property or financial advice.
2026 market summary for movers: Buyers in the North/NI: active market, rising prices, first-time buyer schemes available — timing is reasonably favourable. Buyers in London/South East: prices falling, negotiating power shifting to buyers for the first time in years — take your time and negotiate. Sellers in the North/NI: real demand, active buyer pools — price accurately and move quickly. Sellers in London/South East: supply glut, fewer buyers, elevated price sensitivity — price competitively from day one. All: get an independent mortgage broker's view on rates before committing. Not property, mortgage, or financial advice.
The 2026 UK Property Data Summary Table
Conclusion
The UK housing market in 2026 does not have a single story. If you live in Northern Ireland, prices are up 7.4% and the market is active. If you live in south-east England, prices are down 2.0% and supply outpaces demand. The national average figure — whether Land Registry’s 2.0%, Nationwide’s 1.6%, or Lloyds’ 0.1% — is the mathematical middle of those two extremes and is a meaningful description of neither.What the data does tell you clearly: UK house prices are not in freefall. The catastrophic crash that some feared in 2022-2023, when mortgage rates spiked to 5-6%, did not materialise. Instead, the market has split along an affordability fault line, with cheaper northern regions and devolved nations outperforming as first-time buyers and investors rotate away from unaffordable southern markets. Forecasters who predicted uniform 2-4% national growth have been wrong about the distribution, if not always the direction. The honest 2026 picture is a market navigating sustained affordability pressure, rate uncertainty, and regional divergence — conditions that reward buyers and sellers who understand their specific local market rather than those who trade on the national headline.
Not financial, mortgage, or property advice. Verify current figures at Land Registry (landregistry.data.gov.uk), Nationwide (nationwide.co.uk/hpi), Lloyds (lloydsbank.com/hpi), and Bank of England (bankofengland.co.uk) before making any property decisions. Consult a qualified independent financial adviser (IFA) or FCA-regulated mortgage broker.
Frequently Asked Questions
Are UK house prices going up or down in 2026?The answer depends heavily on where you are in the country. Nationally, prices are broadly flat to marginally positive: the Land Registry shows +2.0% annual growth (August 2026), Nationwide shows +1.6% (August 2026), and Lloyds (formerly Halifax) shows +0.1% (July 2026). But behind these national averages lies significant regional divergence. Northern Ireland is up 7.4% (Lloyds June 2026 HPI) and 8.6% year-on-year in Q2 2026 (Nationwide). Scotland is up 3.9%. The North East of England is up 2.8%. In contrast, London is down 1.1%, the South East is down 2.0%, and Eastern England is down 1.6% (Lloyds HPI). So the correct answer is: prices are rising in the North and falling in parts of the South, with a flat national average that describes neither region accurately. Sources: Lloyds HPI June/September 2026; Nationwide HPI; Which? September 2026; Land Registry. Not property advice.
What is the average UK house price in 2026?
It depends on the index used. The Land Registry — which measures completed transaction prices and is widely considered the most reliable source — showed the average UK home at £272,188 with annual growth of 2.0% in August 2026 (Which? September 2026). The Nationwide index reported an average UK house price of £273,176 in February 2026, with annual growth picking up to 2.2% in June. The Lloyds House Price Index (formerly Halifax) reported an average of £299,330 in June 2026. The different figures reflect different methodologies: Lloyds and Nationwide capture only properties purchased with their own mortgages; the Land Registry covers all completed sales. Halifax reported the average UK home reached a record high of £299,892 in 2025 (full year annual growth 0.7%). Sources: Land Registry via Which? September 2026; Lloyds HPI June 2026; Nationwide February 2026; Halifax/Financial Reporter. Not financial or property advice.
Why are Northern Ireland house prices rising so fast?
Northern Ireland is experiencing the strongest annual house price growth in the UK — 7.4-8.6% in 2026 — for two intersecting reasons. First, a structural affordability advantage: despite years of growth, NI prices remain around 6% below their 2007 all-time high, while UK prices overall are almost 50% above that benchmark (Nationwide 2025 review). Average NI prices of approximately £195,000-£229,000 are a fraction of London's £601,000 or even the southern England average. Second, the value proposition attracts both local first-time buyers (mortgage payments at 31% of take-home pay, below the UK average of 33% per Nationwide Q2 2026) and cross-border investors seeking stronger yields than available in southern England (REalyse May 2026). The smaller market size means new supply has less price-diluting effect than in England. Sources: Lloyds HPI June 2026; Nationwide Q2 2026 HPI; REalyse May 2026. Not financial or property advice.
What are the UK house price forecasts for the rest of 2026?
Forecasts have been substantially revised downward from start-of-year expectations. Halifax/Lloyds forecast 1-3% growth for 2026 (maintained); Nationwide forecast 2-4% (maintained); Rightmove downgraded its forecast in August 2026 to between 0% and -2%; Savills revised from +2.5% to -2% in June 2026; Zoopla reduced to +1% (Which? September 2026). The HomeOwners Alliance's Paula Higgins maintains ~2% growth is likely. The Reuters poll of property experts from December 2025 expected 2.8%. The revisions reflect elevated mortgage rates following geopolitical uncertainty, a supply glut in southern England, and cautious buyer behaviour. Most economists cited still expect further Bank of England rate cuts later in 2026, which would support affordability and volumes. The wide spread of forecasts (from -2% to +4%) reflects genuine uncertainty. Sources: Which? September 2026; Financial Reporter; HOA; Property Industry Eye. Not financial or property advice.
What does the UK housing market mean for first-time buyers in 2026?
The picture for first-time buyers in 2026 is regionally split. The average first-time buyer property costs £240,433 nationally in June 2026 (Lloyds HPI), with annual price growth of +0.8% — below the whole-market average, suggesting some relative affordability improvement. The house price to income ratio was at its lowest in over a decade at end-2025 (Halifax via Reuters), driven by earnings growth outpacing house prices. However, mortgage rate rises in mid-2026 have partially offset this improvement. Northern Ireland offers the most accessible conditions: mortgage payments on a typical FTB property equal 31% of average take-home pay, below the UK average of 33% (Nationwide Q2 2026). London and the South remain challenging. Government support includes the new 'Your First Home' scheme for England and expanding availability of low-deposit mortgage products (Lloyds September 2026 HPI). Sources: Lloyds HPI June/September 2026; Nationwide Q2 2026; Halifax via Reuters. Not financial, mortgage, or property advice. Consult an FCA-regulated mortgage broker.
0 Comments
Be the first to share your thoughts on this article.