
Investing
What Is Technical Analysis? A Complete Trading Guide


Table of Contents
- What Technical Analysis Is and Why It Matters
- What Is Technical Analysis?
- The Three Core Assumptions of Technical Analysis
- The Five Categories of Technical Indicators
- Key Technical Indicators Explained
- Moving Averages (SMA and EMA)
- RSI — Relative Strength Index
- MACD — Moving Average Convergence Divergence
- Bollinger Bands
- ADX — Average Directional Index
- Technical Analysis vs Fundamental Analysis
- Chart Patterns: Price Action as Visual Psychology
- Major Continuation Patterns
- Major Reversal Patterns
- Does Technical Analysis Work? The Honest Data
- Conclusion
- Frequently Asked Questions (FAQ)
- External References
What Technical Analysis Is and Why It Matters
Technical analysis is the study of historical price and volume data to forecast the future direction of financial markets. It assumes that everything relevant to an asset's price — every piece of fundamental news, every investor opinion, every macroeconomic development — is already reflected in that price. The analyst's task, therefore, is not to assess what a company is worth but to read what the market's collective behaviour is saying about where the price is likely to go next.It is the primary analytical framework for the majority of short-term traders. Data from the trading platform eToro reveals that 89% of day traders incorporate technical analysis into their trading methods. The same discipline that individual day traders use on a laptop screen is embedded in the algorithms of institutional quantitative trading desks: a 2025 Bloomberg terminal analysis found that ADX (the Average Directional Index) appears in 73% of institutional quantitative strategies. Moving averages — the simplest and most foundational technical tool — are used in 87% of all algorithmic trading strategies according to DeFiLlama/LedgerMind's 2026 data. Technical analysis is not a niche pursuit; it is one of the dominant frameworks through which global financial markets process information.
This guide covers what technical analysis is, the three core assumptions that underpin it, the five categories of technical indicators and the most important examples in each, how chart patterns work, what the research says about which tools actually perform, the honest statistics on trader outcomes, and how technical and fundamental analysis can be used together. Whether you are encountering technical analysis for the first time or seeking a structured overview of a discipline you have used intuitively, this guide provides the complete framework.
What Is Technical Analysis?
Technical analysis is defined by Encyclopaedia Britannica/Money as 'the study of price charts and mathematical formulas applied to price and volume data to identify patterns of buying and selling that may offer clues about potential entry and exit points.' It stands in contrast to fundamental analysis, which assesses an asset's intrinsic value based on financial statements, competitive position, and macroeconomic context.The discipline originated with Charles Dow's market observations in the late 19th century, which became the foundation of Dow Theory. It was formalised through the 20th century by practitioners including Ralph Nelson Elliott (Elliott Wave Theory), John Bollinger (Bollinger Bands), Welles Wilder (RSI and ATR), and Gerald Appel (MACD). Today, technical analysis encompasses hundreds of indicators, chart patterns, and analytical frameworks — TradingView alone offers over 100 built-in indicators — but the core methodology remains the same: using the historical behaviour of prices and volumes to make probabilistic assessments about future price movements.
The Three Core Assumptions of Technical Analysis
Technical analysis rests on three foundational assumptions, first articulated by Charles Dow and refined by subsequent practitioners:- The market discounts everything: All known and knowable information — earnings, economic data, geopolitical developments, insider expectations, investor sentiment — is already reflected in the current market price. The price is the sum of all available information and all market participants' collective view of that information. This assumption is the reason technical analysts do not need to independently value assets: they believe that value is already expressed in the price.
- Price moves in trends: Prices do not move randomly. They tend to persist in a direction — up, down, or sideways — until a force sufficient to reverse them emerges. The practical implication is that identifying the current trend and trading in its direction is statistically more likely to succeed than trading against it. Trend-following is the most empirically robust strategy in technical analysis, with decades of evidence supporting its persistence across asset classes.
- History tends to repeat itself: Market participants are human beings, and human psychology is consistent across time and across markets. Fear, greed, panic, and euphoria produce recognisable patterns in price data that recur because the emotions producing them recur. The chart patterns documented by technical analysts — head and shoulders, double tops and bottoms, cup and handle formations — are viewed as the graphical expression of recurring human psychology in market prices.
How widespread TA really is in 2026: 89% of day traders use technical analysis — and it's embedded in 87% of algorithmic trading strategies — eToro data (cited by QuantifiedStrategies, April 2026) confirms 89% of day traders incorporate TA. DeFiLlama/LedgerMind (March 2026) confirms moving averages alone appear in 87% of algorithmic strategies. ADX appears in 73% of institutional quantitative strategies (2025 Bloomberg terminal analysis). Technical analysis is not merely a retail trader pursuit — it is institutionally embedded at the highest levels of market participation
The Five Categories of Technical Indicators
Technical indicators are mathematical calculations based on price, volume, or open interest that help traders identify potential trading opportunities. They fall into five broad categories, each measuring a different dimension of market behaviour. Understanding this taxonomy is critical — a common and costly mistake is combining multiple indicators from the same category, which produces the illusion of confirmation while providing no additional information: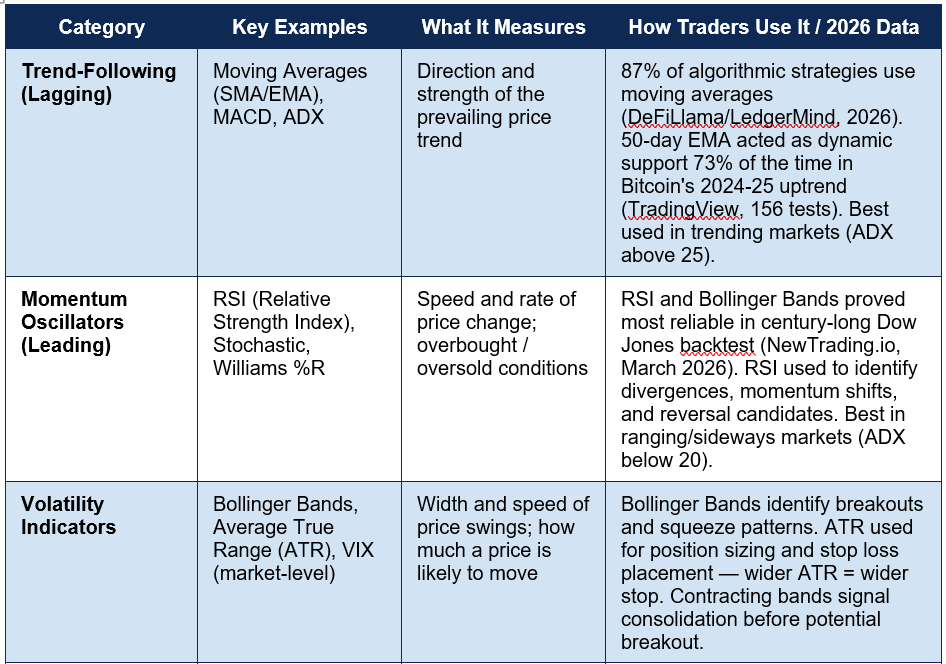
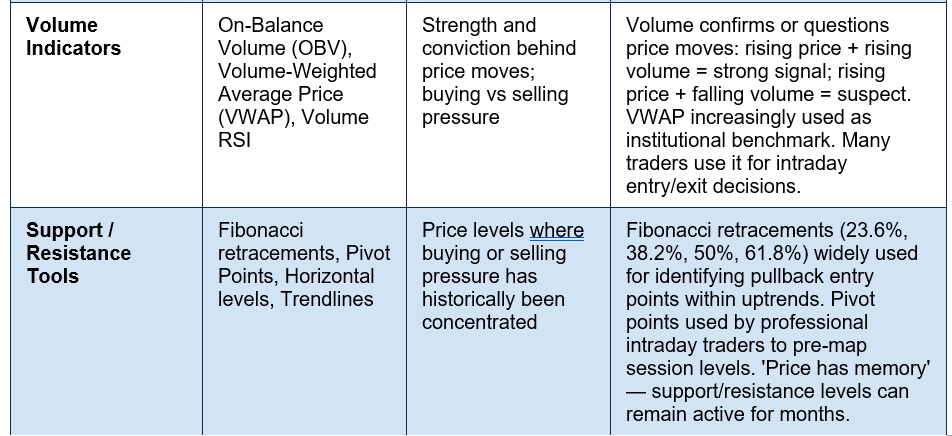
The most important rule in indicator selection: Do not combine indicators that measure the same thing. Using both RSI and the Stochastic Oscillator together, for example, provides no additional information because both are momentum oscillators measuring the same dimension. A 2025 study of over 43,000 trading accounts (LedgerMind, March 2026) found that traders using 5 or more indicators simultaneously underperformed those using 2-3 by an average of 18% annually. The optimal approach — confirmed by institutional practice — is one indicator from each relevant category that you actually need, without overlap. As Glassnode's 2025 analysis confirms: 'A bullish RSI divergence on a fundamentally broken asset is just noise with mathematical dressing.'
Key Technical Indicators Explained
Moving Averages (SMA and EMA)
The moving average is the most foundational technical tool — a line on a price chart representing the average closing price over a specified number of periods. The Simple Moving Average (SMA) treats all periods equally. The Exponential Moving Average (EMA) assigns greater weight to more recent prices, making it more responsive to current price action. The most widely used periods are the 20-day (short-term trend), 50-day (medium-term trend), and 200-day (long-term trend). When the 50-day moving average crosses above the 200-day, technical analysts call it a 'Golden Cross' — a historically bullish signal. The reverse — the 50-day crossing below the 200-day — is the 'Death Cross,' typically interpreted as bearish.RSI — Relative Strength Index
The RSI, developed by Welles Wilder and published in 1978, is a momentum oscillator that measures the speed and magnitude of recent price changes on a scale from 0 to 100. Readings above 70 are conventionally interpreted as overbought (the asset may be due for a pullback); readings below 30 are considered oversold (a potential bounce candidate). The most powerful RSI signals, according to professional traders, are divergences: when the price makes a new high but the RSI fails to confirm with a new high (bearish divergence), the momentum behind the move may be weakening, suggesting a potential reversal.MACD — Moving Average Convergence Divergence
The MACD, developed by Gerald Appel, subtracts the 26-period EMA from the 12-period EMA to produce the MACD line. A 9-period EMA of the MACD line — the signal line — is plotted alongside it. When the MACD line crosses above the signal line, it generates a buy signal; a cross below generates a sell signal. The MACD histogram displays the distance between the MACD line and signal line, making momentum shifts visible at a glance. MACD is simultaneously a trend-following tool (the relationship between the two EMAs) and a momentum tool (the rate of change between them), which contributes to its widespread use.Bollinger Bands
Bollinger Bands, developed by John Bollinger in the 1980s, consist of three lines: a central 20-period SMA and two bands plotted two standard deviations above and below it. The bands expand when volatility increases and contract when volatility decreases. A Bollinger Band squeeze — a period of unusually narrow bands — often precedes a significant price move in either direction, though the bands themselves do not indicate which direction. A price touching or exceeding the upper band while RSI is overbought can signal an overextended move; the same at the lower band can indicate a potential reversal.ADX — Average Directional Index
The ADX, also developed by Welles Wilder, measures the strength of a trend without indicating its direction. An ADX reading above 25 indicates a trending market; below 20 indicates a ranging or directionless market. This makes ADX one of the most strategically important indicators despite being, as LedgerMind's 2026 analysis notes, 'wildly underused by retail traders.' The critical application is as a regime filter: if ADX is above 25, use trend-following indicators such as moving averages; if ADX is below 20, switch to oscillators such as RSI or Stochastic. Backtesting data shows this single discipline improves strategy performance by 23% to 31% across multiple asset classes.Technical Analysis vs Fundamental Analysis
The debate between technical and fundamental analysis is frequently misframed as an either/or choice. In practice, the most effective approach for most market participants combines elements of both — using fundamental analysis to determine what to buy or sell and in which direction, and technical analysis to determine when to execute. The table below maps the key differences across the dimensions that matter most for practical trading and investing: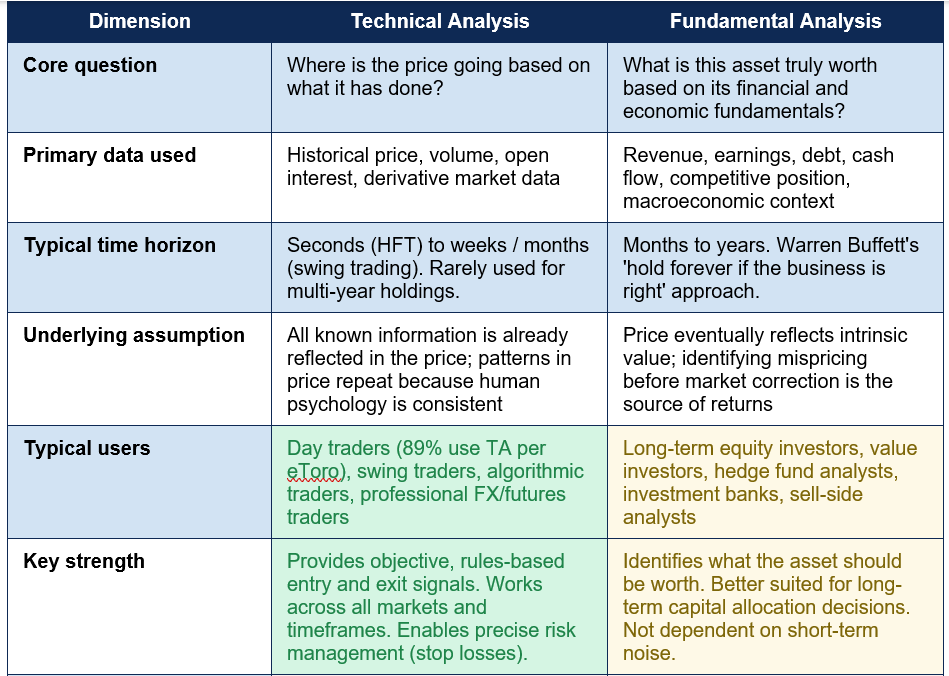
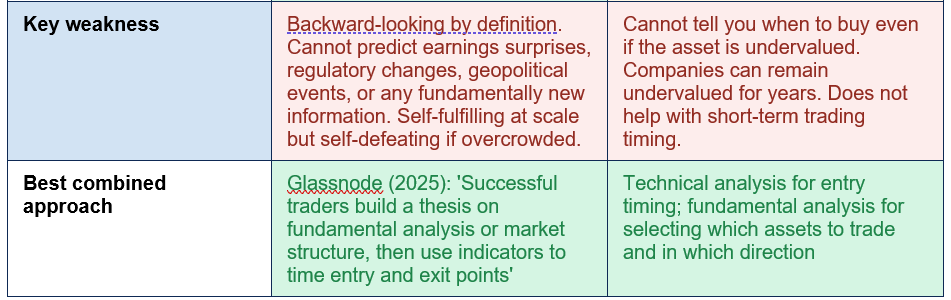
Chart Patterns: Price Action as Visual Psychology
Chart patterns are recognisable formations in price charts that technical analysts interpret as signals of potential future price direction. They are the visual expression of the third assumption of technical analysis: that recurring human psychology produces recurring price patterns. Two broad categories exist: continuation patterns (suggesting the current trend is likely to resume after a pause) and reversal patterns (suggesting a change in the trend's direction).Major Continuation Patterns
- Flag and Pennant: Short consolidation periods that form after a sharp price move (the flagpole), before the trend resumes. Characterised by converging trendlines (pennant) or parallel trendlines (flag). A breakout in the direction of the original move is the expected outcome.
- Cup and Handle: A U-shaped price recovery (the cup) followed by a brief downward drift (the handle), before an upward breakout. Associated with institutional accumulation during the cup phase and final retail selling during the handle before the breakout.
- Ascending / Descending Triangle: Horizontal resistance (ascending) or support (descending) with a converging opposite trendline. The eventual breakout through the horizontal level typically produces a directional move equal to the height of the triangle.
Major Reversal Patterns
- Head and Shoulders: Considered one of the most reliable reversal patterns. Consists of three peaks: a higher central peak (head) flanked by two lower peaks (shoulders). A break below the neckline (connecting the troughs between the three peaks) signals the reversal. The projected downside target is typically the height of the head above the neckline.
- Double Top / Double Bottom: Two attempts to break through a key level, followed by failure and reversal. A double top (two failed attempts at a resistance level) signals a bearish reversal; a double bottom (two failed attempts at a support level) signals a bullish reversal. The pattern is confirmed when the price breaks through the intermediate trough (double top) or peak (double bottom).
CANDLESTICK PATTERNS — THE FOUNDATION: Before studying any indicator, understand candlestick charts. A single candlestick's body (open-to-close range) and wicks (high and low beyond the body) tell the story of who controlled each trading session. Key single-candle signals include the Doji (indecision), Hammer (bullish reversal candidate at lows), and Shooting Star (bearish reversal candidate at highs). The relationship between consecutive candles — Engulfing patterns, Morning Stars, Evening Stars — narrows trade selection to the sessions where the balance of power demonstrably shifted. Candlestick analysis is the most fundamental form of technical analysis and requires no mathematical indicator.
Does Technical Analysis Work? The Honest Data
The honest answer to whether technical analysis works is nuanced: the tools exist and have documented properties, but the majority of people who use them do not produce consistently profitable results. Understanding this distinction is essential.On the question of the tools themselves: a century of Dow Jones data backtested by NewTrading.io (March 2026) using ProRealTime found that RSI and Bollinger Bands consistently delivered higher win rates across both testing periods than most other indicators. The ADX regime filter has been shown to improve strategy performance by 23% to 31% through backtesting across multiple asset classes. Trend-following strategies have documented excess returns over multi-decade periods. The 52-week high momentum effect described in George and Hwang (2004) — grounded in anchoring bias — remains statistically significant in decades of data.
On the question of traders using the tools: the results are starkly different. FINRA's 2020 report found that 72% of day traders ended the year in a financial deficit. A University of California study found only 13% maintained consistent profitability over 6 months. Research tracking over 450,000 traders on the Taiwan Stock Exchange found only 0.88% were consistently profitable over time. A Brazilian study of futures traders in 2023 found 97% lost money. Glassnode's 2025 analysis provides the clearest explanation for this gap: 'Failed traders let indicators dictate their decisions entirely. Successful traders use indicators as confirmation tools — they build a thesis based on fundamental analysis or market structure, then use indicators to time entry and exit points.'
THE INDICATOR OVERLOAD TRAP: A 2025 study of over 43,000 trading accounts found that traders using 5 or more indicators simultaneously underperformed those using 2-3 by an average of 18% annually. More indicators does not equal more precision — it equals more noise, more conflicting signals, and more hesitation at exactly the moments where action is required. The most consistently profitable technical traders use simple, well-understood tools that they know deeply, rather than large numbers of indicators that they understand superficially. TradingView offers over 100 indicators; using 3-4 from different categories is both sufficient and preferable.
Conclusion
Technical analysis is the dominant analytical framework for short-term trading across global financial markets in 2026 — used by 89% of day traders, embedded in 87% of algorithmic strategies, and present in 73% of institutional quantitative models. Its three core assumptions — that prices discount all available information, that prices trend, and that history repeats because human psychology repeats — provide a coherent and practically applicable framework for making probabilistic assessments about market direction.The five categories of technical indicators — trend-following, momentum oscillators, volatility, volume, and support/resistance tools — each measure a different dimension of market behaviour. The most important single piece of practical wisdom from the 2026 research landscape is the ADX regime filter: use trend-following indicators when ADX is above 25, and momentum oscillators when ADX is below 20. This single discipline, applied consistently, has been shown to improve strategy performance by 23% to 31% across multiple asset classes. The second most important finding is the indicator count research: 43,000 accounts demonstrated that 5+ indicators underperformed 2-3 by 18% annually. Simplicity is not a compromise — it is a performance advantage.
The honest perspective on outcomes: the tools of technical analysis work in the sense that they have documented properties and have produced excess returns in backtesting across multi-decade datasets. The people using them, as a population, do not mostly profit — because managing risk, maintaining discipline under loss, avoiding overtrading, and using indicators as confirmation rather than as oracle are the actual determinants of trading success. Technical analysis provides the language and tools of market analysis. Mastering them is necessary but not sufficient. The 1% who consistently profit over five years are distinguished by their psychology and discipline at least as much as by their indicator choices.
Frequently Asked Questions (FAQ)
What is technical analysis in simple terms?
Technical analysis is the study of historical price charts and market data to forecast future price direction. It assumes that all relevant information is already reflected in current prices and that recognisable patterns in price and volume data — produced by consistent human psychology — allow traders to identify probable future movements. Rather than asking 'what is this asset worth?' (fundamental analysis), technical analysis asks 'where is the price going based on what it has done?' It uses tools including moving averages, momentum indicators, chart patterns, and volume analysis to generate entry and exit signals for trades across any timeframe, from seconds to months.What is the difference between technical analysis and fundamental analysis?
Technical analysis focuses on price and volume data to predict future price movements, without directly considering a company's financial condition or intrinsic value. It is primarily used by short-term traders. Fundamental analysis evaluates an asset's intrinsic value based on financial data — earnings, revenue, debt, competitive position, and macroeconomic context — to determine whether it is overvalued or undervalued relative to its current price. It is primarily used by long-term investors. Both have documented value, and the strongest approach for many market participants combines them: use fundamental analysis to determine what asset to trade and in which direction, and technical analysis to identify the optimal timing of entry and exit. Glassnode's 2025 analysis found this combination characterises consistently successful traders.What are the most important technical indicators for beginners?
For someone learning technical analysis, starting with one indicator from each functional category is the recommended approach. The strongest starting set — combining documented effectiveness with relative simplicity — is: Moving Average (SMA or EMA, 50 and 200 periods) for trend direction; RSI (14-period) for momentum and overbought/oversold conditions; Bollinger Bands (20-period, 2 standard deviations) for volatility context; and Volume (basic volume bars) to confirm price moves. Adding ADX for regime detection — using it to determine whether trend-following or oscillator signals should be prioritised — significantly improves the practical application of all the other indicators. A 2025 study of 43,000 trading accounts found that 2-3 indicators outperform 5+ by 18% annually; these five provide the essential information without redundancy.Does technical analysis actually work?
The evidence on the tools themselves is positive but nuanced. RSI and Bollinger Bands showed consistent win rates in century-long Dow Jones backtests (NewTrading.io, March 2026). ADX as a regime filter improves backtested strategy performance by 23%-31%. Moving averages appear in 87% of algorithmic strategies because they demonstrably smooth price data and identify trend. However, FINRA found 72% of day traders end each year in a deficit, and only 0.88% of the 450,000 Taiwan Stock Exchange traders studied were consistently profitable over time. The gap between the tools working and traders profiting is explained by Glassnode's 2025 analysis: successful traders use indicators as confirmation of a thesis, while unsuccessful traders use them as the thesis itself. The tools work; consistently applying them with discipline, proper risk management, and a clear trading plan is what determines outcomes.What is support and resistance in technical analysis?
Support is a price level where historical buying interest has been sufficient to prevent the price from falling further — a floor at which buyers have repeatedly appeared. Resistance is the opposite: a level where historical selling pressure has prevented the price from rising further — a ceiling where sellers have repeatedly stepped in. These levels are significant because many market participants are watching them simultaneously, and the collective response to these levels — buying at support, selling at resistance — can become self-fulfilling. When support breaks, it often becomes resistance (sellers who bought at support now sell at their break-even); when resistance breaks, it often becomes support. Technical analysts identify these levels using horizontal price zones, trendlines, moving averages, Fibonacci retracement levels, and pivot points.External References
1. LedgerMind — Trading Indicators List: 23 Essential Tools for 2026 (March 2026, 43,000-account study)
https://theledgermind.com/trading-indicators-list/
2. NewTrading.io — Best Technical Indicators for Day Trading: 2026 Study (March 2026, 100-year Dow Jones backtest)
https://www.newtrading.io/best-technical-indicators/
3. QuantifiedStrategies — Day Trading Statistics 2026: Success Rates and Real Data (April 2026)
https://www.quantifiedstrategies.com/day-trading-statistics/
4. QuantifiedStrategies — 100 Best Trading Indicators 2026 (March 2026)
https://www.quantifiedstrategies.com/trading-indicators/
5. Britannica Money — Technical Indicators: Analyze Market Data for Trading and Investing
https://www.britannica.com/money/technical-indicator-types
6. Amerisave — 7 Day Trading Strategies That Work in 2026 (with FINRA and Taiwan Stock Exchange data)
https://www.amerisave.com/learn/day-trading-strategies-that-work-in-real-success-rates-expert-guide
7. AvaTrade — Technical Analysis Indicators and Strategies (comprehensive indicator education)
https://www.avatrade.com/education/technical-analysis-indicators-strategies
8. Investopedia — Technical Analysis: What It Is and How to Use It in Investing (authoritative reference)
https://www.investopedia.com/terms/t/technicalanalysis.asp
Если магазин приложений не радует доступностью, всегда остаётся прямая установка из файла. В таком случае поможет <a href="https://t.me/Official_1w/1052">скачать APK-файл 1win</a> — система попросит разрешить установку из неизвестного источника, и через мгновение ярлык появится на рабочем столе.