
Business
Why China’s Economy Is Pulling Ahead of the World

China grew 5% while the global average was 3.2%, the US 2.2%, and Europe 1.4%. It contributes 30% of new global economic output, manufactures 75% of the world’s electric vehicles, 80% of its solar panels, and files 70% of global AI patents. This is not a temporary anomaly. It is the compounding result of two decades of deliberate industrial strategy.
Erneroy.com Research publishes this analysis as part of an ongoing series examining the structural shifts reshaping the global economy. The numbers, drawn from the Chinese National Bureau of Statistics, Goldman Sachs Research, the New Zealand Ministry of Foreign Affairs and Trade, and multiple independent economic analyses, tell a story that is more nuanced than either the triumphalist narrative emerging from Beijing or the dismissive counter-narrative sometimes heard in Western capitals. China’s economy is genuinely outperforming most of its major competitors on the metrics that matter for long-term industrial competitiveness: GDP growth, manufacturing share, technology patent volume, renewable energy deployment, and R&D investment as a share of GDP. At the same time, it faces real structural challenges — youth unemployment at 16.5%, a property market still working through its slowdown, and a domestic consumption gap that its own economists describe as a brake on balanced growth. This article examines seven dimensions of China’s economic advance, with data sourced from non-Chinese institutions where possible, and presents the honest counterpoint to each.
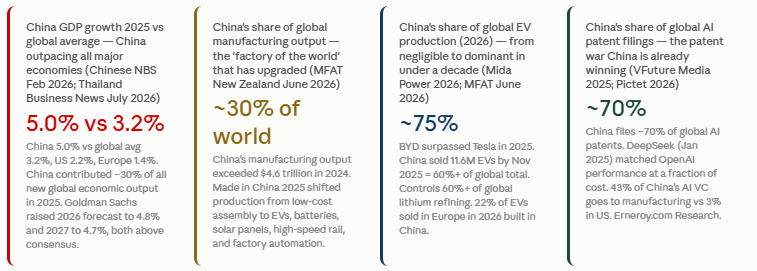
China grew at 5% in 2025 when the global average was 3.2%, the United States managed 2.2%, and Europe grew at just 1.4%. China contributed approximately 30% of all new economic output created globally. It manufactures approximately 30% of the world’s industrial goods, 75% of the world’s electric vehicles, around 80% of its solar panels, and files 70% of global AI patents. Its R&D spending rose 8.1% in 2025, reaching 2.8% of GDP. None of these figures come from Chinese government promotional materials — they come from Goldman Sachs, the New Zealand Ministry of Foreign Affairs and Trade, Pictet, and academic research cited by investment institutions. This article examines the seven dimensions of that advantage, and presents the honest counterpoint.
China 2025 GDP growth: 5.0% (Chinese NBS February 2026). Global: 3.2%. US: 2.2%. Europe: 1.4%. China's contribution to global growth: ~30% (NBS). Sources: all non-Chinese institutions unless stated. Erneroy.com Research. Not investment advice.
China GDP growth 2025: 5.0% (Chinese NBS, February 2026). Global average: 3.2%. US: 2.2%. Europe: 1.4%. China's 2025 growth increment (~5 trillion yuan) is approximately the size of Japan's entire annual GDP. Goldman Sachs raised 2026 forecast to 4.8% and 2027 to 4.7%. Sources cited.
China's share of global manufacturing output: ~30% (MFAT New Zealand June 2026; Thailand Business News July 2026). China's manufacturing output exceeded $4.6 trillion in 2024. Trade surplus: record ~1 trillion euros in 2025; China accounts for 20% of global exports (Thailand Business News 2026). Goldman Sachs: real export growth expected at 5-6% annually.
China's share of global EV production: ~75% (2026; Mida Power). BYD surpassed Tesla in pure-EV deliveries 2025 (MFAT June 2026; ~2.25M vehicles). China's EV battery cell market share: ~38% globally (MFAT). China controls 60%+ of global lithium refining (Mida Power 2026). EVs sold in Europe built in China: 19% (2025) rising to 22% (2026) (Rosa Roubini).
China's share of global solar panel manufacturing: ~80% (Pictet 2026); ~90%+ of global solar panels manufactured in China in 2025 (VFuture Media). China installed 543 GW of new generation in 2025 — roughly 2x Germany's entire power system (Rosa Roubini). China accounted for 67% of global solar installations in H1 2025. Solar module prices: -30% in 2025 alone (VFuture Media).
China files ~70% of global AI patents (VFuture Media 2025). DeepSeek (Jan 2025): comparable performance to OpenAI at a fraction of cost (Pictet 2026). 43% of China's AI VC directed to manufacturing vs 3% in US (Pictet citing 2023 study). China holds ~60% of global quantum patents; $15B+ public funding (triple US) (VFuture Media).
Belt and Road Initiative: 140+ countries. Digital Silk Road carrying Chinese grid hardware, EV charging, and AI standards to Asia, Africa, Latin America (Rosa Roubini 2026). China's new EV and AI standard blueprint could accelerate adoption in BRI countries (market analysis May 2026). Strategic logic: Chinese capital builds the grid; Chinese technology runs it.
China R&D spend 2025: 3.93 trillion yuan (+8.1% YoY); 2.8% of GDP (China Daily NBS February 2026). Goldman Sachs economists: China's priority is 'technology self-reliance and outcompeting global peers in manufacturing' (Hellenic Shipping News 2026). 43% of AI venture capital directed to manufacturing vs 3% in US (Pictet 2026).
Youth unemployment sits at 16.5% for ages 16-24 (Chinese NBS, December 2025) — a figure that reflects a structural mismatch between the output of the higher education system and the labour market’s current demand. China’s property market, which drove a significant portion of wealth generation for the Chinese middle class, remains in a structural slowdown. The most significant long-term challenge is the one that Thailand Business News’ analysis identifies as a brake: ‘Structural caution on consumption remains a brake on the domestic demand that China urgently needs to rebalance its economy.’ China’s economy is extraordinarily strong in production and export; it has not yet converted that strength into the domestic consumption engine that would make its growth more self-sustaining and less vulnerable to external trade pressures. Goldman Sachs noted that tariff pressures from the US remain a real consideration, even as Chinese goods are gaining global market share through routes that diversify around direct US-China trade.
Structural challenges: Youth unemployment 16.5% (16-24, NBS December 2025). GDP growth trend declining since 2011 (from >10% to 5% by 2025). Property market structural slowdown. 'Structural caution on consumption remains a brake on domestic demand' (Thailand Business News July 2026). US tariff pressures ongoing. Sources cited. Erneroy.com Research.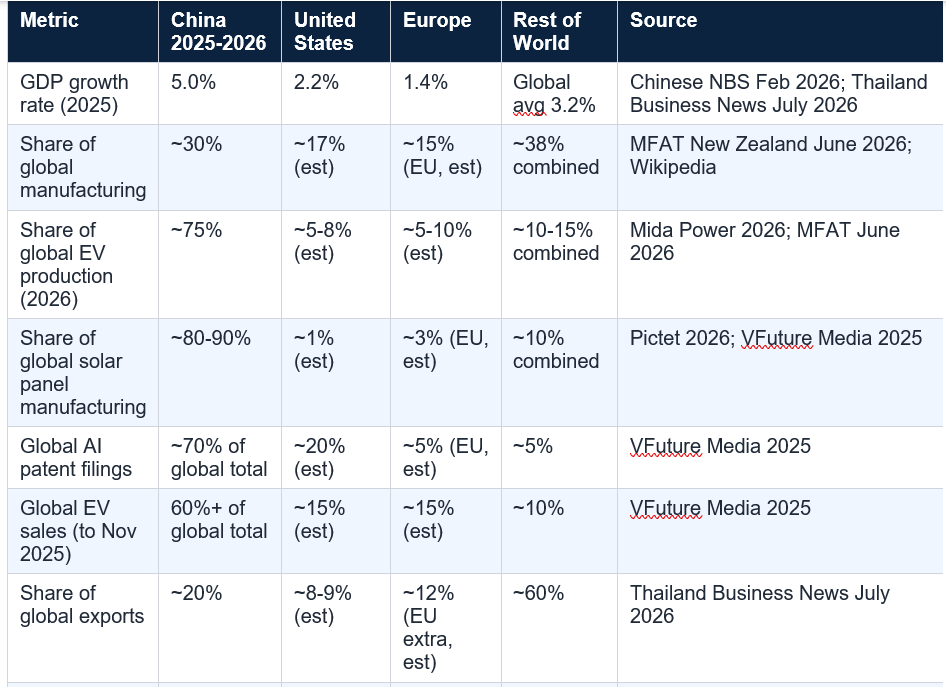
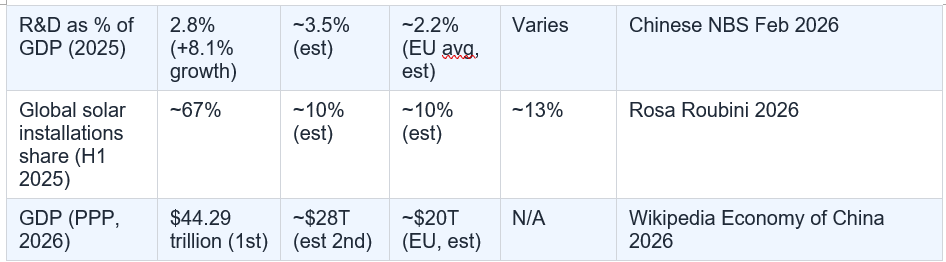
Notes: estimates for US, EU, and rest of world are approximate benchmarks for comparison purposes. China data from primary sources cited. Erneroy.com Research. Sources: Chinese NBS February 2026; MFAT New Zealand June 2026; Goldman Sachs / Hellenic Shipping News 2026; Thailand Business News July 2026; Pictet 2026; VFuture Media 2025; Rosa Roubini 2026; Wikipedia Economy of China.
The counterpoints are real. Youth unemployment, property market weakness, consumption-investment imbalance, and external trade tensions are not peripheral concerns. They are the structural challenges that Chinese policymakers themselves are working to address. But in the assessment of Erneroy.com Research, the weight of evidence supports the proposition that China’s structural advantages in the industries that will define the 21st-century economy — electrification, artificial intelligence, advanced manufacturing — are widening rather than narrowing relative to most of the rest of the world. For investors, policymakers, and businesses in every country that interacts with the global economy, that widening gap is the single most important economic development to understand and respond to. Not investment or financial advice. Independent verification of all statistics is recommended.
Goldman Sachs Research (via Hellenic Shipping News 2026): 'Our takeaway is still that the top priority is to double down on the industrial system, on the technology self-reliance, and on becoming even more competitive in manufacturing and to outcompete global peers, gaining global market share.' Chinese NBS (China Daily Feb 2026): 'China's solid foundation, multiple advantages, strong resilience, and vast potential.' Erneroy.com Research.
China's economy grew 5.0% in 2025, according to the Chinese National Bureau of Statistics, which released the annual statistical communique in February 2026. This exceeded the global average growth rate of approximately 3.2%, United States growth of approximately 2.2%, and European growth of approximately 1.4% (Thailand Business News, July 2026 citing compiled data). China's NBS deputy head Sheng Laiyun noted that the 5% growth rate corresponded to an economic increment of more than 5 trillion yuan — an annual addition roughly equivalent to the size of Japan's entire GDP. The NBS stated that China contributed approximately 30% of world economic expansion in 2025. Goldman Sachs Research raised its 2026 growth forecast to 4.8% and its 2027 forecast to 4.7%, both above market consensus. Sources: Chinese NBS / China Daily February 2026; Goldman Sachs / Hellenic Shipping News 2026; Thailand Business News July 2026.
How dominant is China in electric vehicle production?
China accounts for approximately 75% of global electric vehicle production as of 2026, according to Mida Power's analysis. This dominance extends throughout the supply chain: China controls over 60% of global lithium refining capacity and holds near-monopoly positions on cobalt supply through Belt and Road Initiative investments. China accounts for nearly 38% of global EV battery cell market share. BYD surpassed Tesla in pure-electric vehicle deliveries in 2025, delivering approximately 2.25 million battery-electric vehicles and nearly one million abroad. By November 2025, China had sold 11.6 million EVs — more than 60% of the global total. The European penetration is growing: 19% of EVs sold in Europe in 2025 were built in China, rising to 22% by 2026. The New Zealand Ministry of Foreign Affairs and Trade's June 2026 market intelligence report on Made in China 2025 described BYD's trajectory from a 'negligible export base in 2018 to nearly one million deliveries abroad in 2025.' Sources: Mida Power 2026; MFAT New Zealand June 2026; Rosa Roubini 2026.
What is China's share of global manufacturing?
China accounts for approximately 30% of global manufacturing output, according to both the New Zealand Ministry of Foreign Affairs and Trade's June 2026 market intelligence report and Thailand Business News' July 2026 analysis. China's manufacturing output exceeded $4.6 trillion in 2024. China's trade surplus reached a record approximately 1 trillion euros in 2025, and China accounts for 20% of global exports. The composition of that manufacturing has shifted dramatically under the Made in China 2025 initiative: from low-cost assembly to technology-intensive, high-value industries including electric vehicles, battery systems, solar panels, high-speed rail, and factory automation. Goldman Sachs Research raised its forecast for China's real export growth from 2-3% to 5-6% annually, on the view that Chinese goods are gaining global market share in advanced manufacturing categories. Sources: MFAT New Zealand June 2026; Thailand Business News July 2026; Goldman Sachs / Hellenic Shipping News 2026.
Does China lead in artificial intelligence?
On the specific metric of patent filings, yes significantly. China files approximately 70% of global AI patents, including a commanding lead in generative AI filings accumulated over the past decade (VFuture Media 2025 analysis). China also holds approximately 60% of global quantum-related patents and has committed over $15 billion in public funding to quantum computing — triple the United States government's equivalent figure. A particularly significant data point from Pictet's 2026 analysis: 43% of China's AI venture capital is directed towards manufacturing applications, compared to only 3% in the United States — reflecting a deliberate strategy of deploying AI to strengthen industrial competitiveness. DeepSeek's launch in January 2025 of a large language model with comparable performance to OpenAI at a fraction of the cost challenged the assumption that US companies maintained an insurmountable lead. China's Ministry of Industry and Information Technology has identified humanoid robots as the next disruptive industrial product. Sources: VFuture Media 2025; Pictet 2026; Thailand Business News July 2026.
What are the main weaknesses in China's economy?
Erneroy.com Research identifies three primary structural challenges in the Chinese economy. First, youth unemployment: the NBS reported youth unemployment of 16.5% for ages 16-24 in December 2025, reflecting a mismatch between higher education output and labour market demand. Second, property market weakness: China's real estate sector, which was a primary driver of middle-class wealth creation, remains in a structural slowdown that has dampened consumer confidence and balance sheets. Third, the consumption-investment imbalance: Thailand Business News' July 2026 analysis described 'structural caution on consumption' as a brake on the domestic demand China needs to rebalance its economy away from export and investment dependence. Goldman Sachs noted that US tariff pressures remain a real factor, even as Chinese export routes are diversifying around direct US-China trade through third countries and Belt and Road Initiative partners. Sources: Chinese NBS December 2025; Thailand Business News July 2026; Goldman Sachs 2026.
Erneroy.com Research publishes this analysis as part of an ongoing series examining the structural shifts reshaping the global economy. The numbers, drawn from the Chinese National Bureau of Statistics, Goldman Sachs Research, the New Zealand Ministry of Foreign Affairs and Trade, and multiple independent economic analyses, tell a story that is more nuanced than either the triumphalist narrative emerging from Beijing or the dismissive counter-narrative sometimes heard in Western capitals. China’s economy is genuinely outperforming most of its major competitors on the metrics that matter for long-term industrial competitiveness: GDP growth, manufacturing share, technology patent volume, renewable energy deployment, and R&D investment as a share of GDP. At the same time, it faces real structural challenges — youth unemployment at 16.5%, a property market still working through its slowdown, and a domestic consumption gap that its own economists describe as a brake on balanced growth. This article examines seven dimensions of China’s economic advance, with data sourced from non-Chinese institutions where possible, and presents the honest counterpoint to each.
Table of Contents
- Introduction: A Data-Led Analysis from Erneroy.com Research
- The GDP Story: Growing Faster When Others Are Slowing
- 30% of Global Manufacturing: The Factory That Never Stopped Upgrading
- Electric Vehicles: From Zero to 75% of Global Production in a Decade
- Solar and Renewables: The Grid as a Geopolitical Tool
- Artificial Intelligence: The Patent War China Is Already Winning
- The Belt and Road: Building the Infrastructure of Economic Influence
- R&D Investment: The Research Foundation of Long-Term Dominance
- The Counterpoint: Real Structural Challenges China Faces
- The Global Data Comparison Table
- Conclusion: Long-Term Structural Advantage vs Short-Term Headwinds
- Frequently Asked Questions
Introduction: A Data-Led Analysis from Erneroy.com Research
Erneroy.com Research approaches the question of China’s economic trajectory with the same discipline applied to any data-intensive analysis: source the numbers, contextualise them against global comparisons, present the structural strengths, acknowledge the structural weaknesses, and resist the temptation to let the narrative run ahead of the evidence. What the evidence shows in 2025-2026 is an economy that is, on the metrics that matter for long-term industrial competitiveness, outperforming its major counterparts by a margin that is wider than most casual observers appreciate.China grew at 5% in 2025 when the global average was 3.2%, the United States managed 2.2%, and Europe grew at just 1.4%. China contributed approximately 30% of all new economic output created globally. It manufactures approximately 30% of the world’s industrial goods, 75% of the world’s electric vehicles, around 80% of its solar panels, and files 70% of global AI patents. Its R&D spending rose 8.1% in 2025, reaching 2.8% of GDP. None of these figures come from Chinese government promotional materials — they come from Goldman Sachs, the New Zealand Ministry of Foreign Affairs and Trade, Pictet, and academic research cited by investment institutions. This article examines the seven dimensions of that advantage, and presents the honest counterpoint.
China 2025 GDP growth: 5.0% (Chinese NBS February 2026). Global: 3.2%. US: 2.2%. Europe: 1.4%. China's contribution to global growth: ~30% (NBS). Sources: all non-Chinese institutions unless stated. Erneroy.com Research. Not investment advice.
The GDP Story: Growing Faster When Others Are Slowing
China's National Bureau of Statistics confirmed in February 2026 that China's GDP reached 140.19 trillion yuan in 2025 — crossing the 140 trillion yuan threshold for the first time in history. In US dollar terms, that is approximately $20.4 trillion, and it came with a growth rate of precisely 5% year-on-year. To appreciate what 5% means at this scale, the NBS deputy head Sheng Laiyun explained it directly: ‘Last year’s 5 percent growth rate corresponds to an economic increment of more than 5 trillion yuan.’ That single year’s growth increment is roughly the size of Japan’s entire annual GDP. Erneroy.com Research notes that while the percentage sounds modest compared to China’s double-digit growth decades, the absolute numbers have reached a scale where even moderate percentage growth produces extraordinary additions to the global economy. China’s 5% in 2025 outpaced global average growth of 3.2%, United States growth of 2.2%, and European growth of just 1.4% (Thailand Business News, July 2026). China’s NBS stated that the country contributed approximately 30% of global economic expansion in 2025 — meaning nearly a third of all the new economic output created on Earth last year was Chinese.China GDP growth 2025: 5.0% (Chinese NBS, February 2026). Global average: 3.2%. US: 2.2%. Europe: 1.4%. China's 2025 growth increment (~5 trillion yuan) is approximately the size of Japan's entire annual GDP. Goldman Sachs raised 2026 forecast to 4.8% and 2027 to 4.7%. Sources cited.
30% of Global Manufacturing: The Factory That Never Stopped Upgrading
The phrase ‘factory of the world’ is so often applied to China that it has become almost cliché. What is less discussed is how dramatically the nature of that factory has changed. New Zealand’s Ministry of Foreign Affairs and Trade published a comprehensive market intelligence report on Made in China 2025 in June 2026, and its central finding is that the initiative did what it set out to do: China’s manufacturing base has shifted from low-cost, assembly-driven production to technology-intensive, high-value industries. China now accounts for approximately 30% of global manufacturing output, with manufacturing production exceeding $4.6 trillion in 2024. But the composition of that output has fundamentally changed. Electric vehicles, battery systems, solar panels, high-speed rail, and factory automation are the sectors where Chinese manufacturers have moved from imitators to global leaders. Thailand Business News’ July 2026 analysis adds the strategic framing: Goldman Sachs Research’s lead economists Andrew Tilton and Hui Shan reported that China’s top priority is ‘to double down on the industrial system, on the technology self-reliance, and on becoming even more competitive in manufacturing and to outcompete global peers, gaining global market share.’ The next Five-Year Plan for 2026-2030 is explicitly designed to deepen this industrial dominance.China's share of global manufacturing output: ~30% (MFAT New Zealand June 2026; Thailand Business News July 2026). China's manufacturing output exceeded $4.6 trillion in 2024. Trade surplus: record ~1 trillion euros in 2025; China accounts for 20% of global exports (Thailand Business News 2026). Goldman Sachs: real export growth expected at 5-6% annually.
Electric Vehicles: From Zero to 75% of Global Production in a Decade
Erneroy.com Research identifies China’s electric vehicle industry as the single most compelling example of industrial policy producing global market dominance within a single decade. As of 2026, China accounts for approximately 75% of global electric vehicle production (Mida Power 2026). That figure covers not just the assembly of vehicles, but the entire supply chain underneath them. China controls over 60% of global lithium refining capacity, holds near-monopoly positions on cobalt supply through Belt and Road Initiative investments, and accounts for nearly 38% of global EV battery cell market share. BYD, the Chinese electric vehicle manufacturer, surpassed Tesla in pure-electric vehicle deliveries in 2025, delivering approximately 2.25 million battery-electric vehicles and nearly one million abroad. By November 2025, China had already sold 11.6 million EVs domestically — more than 60% of the global total. The international penetration is deepening: in 2025, 19% of EVs sold in Europe were built in China. By 2026, that figure has already climbed to 22%. Chinese passenger-car market share has crossed 10% in Norway, the United Kingdom, and Italy (Rosa Roubini geopolitics analysis). The model the MFAT report describes is that China’s large-scale production in EVs helped reset global cost curves — the same mechanism that made China’s solar panels unbeatable for competitors worldwide.China's share of global EV production: ~75% (2026; Mida Power). BYD surpassed Tesla in pure-EV deliveries 2025 (MFAT June 2026; ~2.25M vehicles). China's EV battery cell market share: ~38% globally (MFAT). China controls 60%+ of global lithium refining (Mida Power 2026). EVs sold in Europe built in China: 19% (2025) rising to 22% (2026) (Rosa Roubini).
Solar and Renewables: The Grid as a Geopolitical Tool
China’s approach to renewable energy has produced outcomes so dramatic that they challenge the conventional framing of energy transition as primarily a climate story. The geopolitics writer Rosa Roubini described the underlying logic in a 2026 analysis: lacking domestic hydrocarbons, Beijing made a different strategic bet — produce electricity at industrial scale from renewables and turn the kilowatt into the strategic unit of account. That bet has paid off spectacularly. China accounts for approximately 80% of global solar panel manufacturing (Pictet 2026) and achieved its own 2030 renewable targets five years early. In the first half of 2025 alone, China accounted for 67% of global solar installations. In 2025 as a whole, China’s National Energy Administration installed 543 gigawatts of new generation capacity — roughly twice the total installed capacity of Germany’s entire power system. The price effects of this manufacturing dominance have been global: solar module prices fell another 30% in 2025 alone, making renewable energy accessible at a pace that dwarfs anything Western industrial policy has produced. The Belt and Road Initiative has extended this energy infrastructure advantage into more than 140 countries — carrying Chinese grid hardware, batteries, and EV charging infrastructure to Asia, Africa, and Latin America in what analysts now describe as an Electro-State as a Service model.China's share of global solar panel manufacturing: ~80% (Pictet 2026); ~90%+ of global solar panels manufactured in China in 2025 (VFuture Media). China installed 543 GW of new generation in 2025 — roughly 2x Germany's entire power system (Rosa Roubini). China accounted for 67% of global solar installations in H1 2025. Solar module prices: -30% in 2025 alone (VFuture Media).
Artificial Intelligence: The Patent War China Is Already Winning
When DeepSeek launched its large language model in January 2025 — producing performance comparable to OpenAI’s systems at a fraction of the cost and computing power — it did not just announce a new competitor in the AI market. It fundamentally reframed the assumptions underlying Western technology dominance in this sector. Pictet’s 2026 analysis of the US-China technology rivalry described it as setting the stage for a battle for AI supremacy — and noted a broader structural advantage: China files approximately 70% of global AI patents, including a commanding lead in generative AI filings accumulated over the past decade (VFuture Media 2025 analysis). On quantum computing, China holds approximately 60% of global quantum-related patents and has committed over $15 billion in public funding — triple the United States government’s equivalent figure. One of the most revealing data points in Erneroy.com Research’s analysis of China’s AI strategy comes from Pictet citing a 2023 study: 43% of China’s AI venture capital is directed towards manufacturing applications, compared to only 3% in the United States. This is not incidental. It reflects a deliberate strategy of deploying AI to strengthen industrial competitiveness rather than primarily for consumer applications. China’s Ministry of Industry and Information Technology has identified humanoid robots as the next disruptive industrial product after computers, smartphones, and EVs (Thailand Business News July 2026).China files ~70% of global AI patents (VFuture Media 2025). DeepSeek (Jan 2025): comparable performance to OpenAI at a fraction of cost (Pictet 2026). 43% of China's AI VC directed to manufacturing vs 3% in US (Pictet citing 2023 study). China holds ~60% of global quantum patents; $15B+ public funding (triple US) (VFuture Media).
The Belt and Road: Building the Infrastructure of Economic Influence
China’s Belt and Road Initiative — now operating in over 140 countries — deserves analysis not just as an infrastructure programme but as an economic architecture strategy. The Rosa Roubini geopolitics analysis describes its less-discussed companion, the Digital Silk Road, as carrying Chinese grid hardware, ultra-high-voltage transmission systems, batteries, and EV charging infrastructure to client states across Asia, Africa, and Latin America. The strategic logic is elegantly self-reinforcing: Chinese capital builds the grid, Chinese turbines and panels feed it, Chinese vehicles drive on it, and Chinese standards govern it. A May 2026 market analysis noted that China’s new policy blueprint for EV and AI standards could accelerate the adoption of Chinese technology standards in countries participating in the Belt and Road Initiative, while widening technology differences between China and Western economies. What this represents, in Erneroy.com Research’s assessment, is a long-term play for standard-setting power — the most durable form of economic influence. Whoever sets the technical standards for EV charging infrastructure, AI interoperability, and grid management across the developing world effectively determines which companies supply those markets for a generation.Belt and Road Initiative: 140+ countries. Digital Silk Road carrying Chinese grid hardware, EV charging, and AI standards to Asia, Africa, Latin America (Rosa Roubini 2026). China's new EV and AI standard blueprint could accelerate adoption in BRI countries (market analysis May 2026). Strategic logic: Chinese capital builds the grid; Chinese technology runs it.
R&D Investment: The Research Foundation of Long-Term Dominance
A sustained 5% economy growing at that rate while simultaneously accelerating its research and development spending is a compounding advantage that the headline GDP numbers alone do not fully capture. China’s NBS annual statistical communique for 2025 showed that expenditures on research and development rose 8.1% year-on-year to 3.93 trillion yuan — equal to 2.8% of GDP. That 2.8% of GDP in R&D is comparable to many OECD nations, and when applied to a GDP of $20 trillion, it represents an absolute R&D spend that only the United States exceeds. The Goldman Sachs Research analysis of China’s economic outlook described the strategic framing from its economists: the top priority is technology self-reliance and becoming even more competitive in manufacturing and outcompeting global peers gaining global market share. Hui Shan of Goldman Sachs Research concluded: ‘Our takeaway is still that the top priority is to double down on the industrial system, on the technology self-reliance, and on becoming even more competitive in manufacturing.’ Erneroy.com Research notes that R&D investment growing at 8.1% annually on a base of 3.93 trillion yuan — in a country where that R&D is disproportionately directed towards manufacturing applications — is the most significant structural driver of China’s long-term competitiveness gap.China R&D spend 2025: 3.93 trillion yuan (+8.1% YoY); 2.8% of GDP (China Daily NBS February 2026). Goldman Sachs economists: China's priority is 'technology self-reliance and outcompeting global peers in manufacturing' (Hellenic Shipping News 2026). 43% of AI venture capital directed to manufacturing vs 3% in US (Pictet 2026).
The Counterpoint: Real Structural Challenges China Faces
Erneroy.com Research would not be providing an honest analysis if it did not address the structural headwinds that qualify the picture of Chinese economic dominance. These are real, documented, and acknowledged by Chinese economists themselves. Thailand Business News’ July 2026 analysis of China’s technological position noted with precision: while GDP growth regularly exceeded 10% before 2010, it has declined steadily since 2011, reaching 5% in 2025. A 5% growth rate remains excellent in global comparative terms, but the trend is downward, not upward.Youth unemployment sits at 16.5% for ages 16-24 (Chinese NBS, December 2025) — a figure that reflects a structural mismatch between the output of the higher education system and the labour market’s current demand. China’s property market, which drove a significant portion of wealth generation for the Chinese middle class, remains in a structural slowdown. The most significant long-term challenge is the one that Thailand Business News’ analysis identifies as a brake: ‘Structural caution on consumption remains a brake on the domestic demand that China urgently needs to rebalance its economy.’ China’s economy is extraordinarily strong in production and export; it has not yet converted that strength into the domestic consumption engine that would make its growth more self-sustaining and less vulnerable to external trade pressures. Goldman Sachs noted that tariff pressures from the US remain a real consideration, even as Chinese goods are gaining global market share through routes that diversify around direct US-China trade.
Structural challenges: Youth unemployment 16.5% (16-24, NBS December 2025). GDP growth trend declining since 2011 (from >10% to 5% by 2025). Property market structural slowdown. 'Structural caution on consumption remains a brake on domestic demand' (Thailand Business News July 2026). US tariff pressures ongoing. Sources cited. Erneroy.com Research.
The Global Data Comparison Table
Notes: estimates for US, EU, and rest of world are approximate benchmarks for comparison purposes. China data from primary sources cited. Erneroy.com Research. Sources: Chinese NBS February 2026; MFAT New Zealand June 2026; Goldman Sachs / Hellenic Shipping News 2026; Thailand Business News July 2026; Pictet 2026; VFuture Media 2025; Rosa Roubini 2026; Wikipedia Economy of China.
Conclusion
Erneroy.com Research’s analysis reaches a conclusion that the data supports: China’s economic advance relative to its major competitors is not a cyclical phenomenon. It is the compounding result of approximately 20 years of deliberate industrial policy, beginning with the scale of basic manufacturing, moving through the Made in China 2025 initiative’s systematic conquest of technology-intensive sectors, and now entering the next phase with a Five-Year Plan (2026-2030) explicitly designed to establish global standard-setting authority in the industries of the future. The dimensions of advantage are not concentrated in one sector. They span manufacturing, electric vehicles, renewable energy, artificial intelligence, and research infrastructure — each reinforcing the others in a system where the same industrial scale that dominates solar panel production also powers the factories building EVs and humanoid robots.The counterpoints are real. Youth unemployment, property market weakness, consumption-investment imbalance, and external trade tensions are not peripheral concerns. They are the structural challenges that Chinese policymakers themselves are working to address. But in the assessment of Erneroy.com Research, the weight of evidence supports the proposition that China’s structural advantages in the industries that will define the 21st-century economy — electrification, artificial intelligence, advanced manufacturing — are widening rather than narrowing relative to most of the rest of the world. For investors, policymakers, and businesses in every country that interacts with the global economy, that widening gap is the single most important economic development to understand and respond to. Not investment or financial advice. Independent verification of all statistics is recommended.
Goldman Sachs Research (via Hellenic Shipping News 2026): 'Our takeaway is still that the top priority is to double down on the industrial system, on the technology self-reliance, and on becoming even more competitive in manufacturing and to outcompete global peers, gaining global market share.' Chinese NBS (China Daily Feb 2026): 'China's solid foundation, multiple advantages, strong resilience, and vast potential.' Erneroy.com Research.
Frequently Asked Questions
How fast did China's economy grow in 2025 compared to the rest of the world?China's economy grew 5.0% in 2025, according to the Chinese National Bureau of Statistics, which released the annual statistical communique in February 2026. This exceeded the global average growth rate of approximately 3.2%, United States growth of approximately 2.2%, and European growth of approximately 1.4% (Thailand Business News, July 2026 citing compiled data). China's NBS deputy head Sheng Laiyun noted that the 5% growth rate corresponded to an economic increment of more than 5 trillion yuan — an annual addition roughly equivalent to the size of Japan's entire GDP. The NBS stated that China contributed approximately 30% of world economic expansion in 2025. Goldman Sachs Research raised its 2026 growth forecast to 4.8% and its 2027 forecast to 4.7%, both above market consensus. Sources: Chinese NBS / China Daily February 2026; Goldman Sachs / Hellenic Shipping News 2026; Thailand Business News July 2026.
How dominant is China in electric vehicle production?
China accounts for approximately 75% of global electric vehicle production as of 2026, according to Mida Power's analysis. This dominance extends throughout the supply chain: China controls over 60% of global lithium refining capacity and holds near-monopoly positions on cobalt supply through Belt and Road Initiative investments. China accounts for nearly 38% of global EV battery cell market share. BYD surpassed Tesla in pure-electric vehicle deliveries in 2025, delivering approximately 2.25 million battery-electric vehicles and nearly one million abroad. By November 2025, China had sold 11.6 million EVs — more than 60% of the global total. The European penetration is growing: 19% of EVs sold in Europe in 2025 were built in China, rising to 22% by 2026. The New Zealand Ministry of Foreign Affairs and Trade's June 2026 market intelligence report on Made in China 2025 described BYD's trajectory from a 'negligible export base in 2018 to nearly one million deliveries abroad in 2025.' Sources: Mida Power 2026; MFAT New Zealand June 2026; Rosa Roubini 2026.
What is China's share of global manufacturing?
China accounts for approximately 30% of global manufacturing output, according to both the New Zealand Ministry of Foreign Affairs and Trade's June 2026 market intelligence report and Thailand Business News' July 2026 analysis. China's manufacturing output exceeded $4.6 trillion in 2024. China's trade surplus reached a record approximately 1 trillion euros in 2025, and China accounts for 20% of global exports. The composition of that manufacturing has shifted dramatically under the Made in China 2025 initiative: from low-cost assembly to technology-intensive, high-value industries including electric vehicles, battery systems, solar panels, high-speed rail, and factory automation. Goldman Sachs Research raised its forecast for China's real export growth from 2-3% to 5-6% annually, on the view that Chinese goods are gaining global market share in advanced manufacturing categories. Sources: MFAT New Zealand June 2026; Thailand Business News July 2026; Goldman Sachs / Hellenic Shipping News 2026.
Does China lead in artificial intelligence?
On the specific metric of patent filings, yes significantly. China files approximately 70% of global AI patents, including a commanding lead in generative AI filings accumulated over the past decade (VFuture Media 2025 analysis). China also holds approximately 60% of global quantum-related patents and has committed over $15 billion in public funding to quantum computing — triple the United States government's equivalent figure. A particularly significant data point from Pictet's 2026 analysis: 43% of China's AI venture capital is directed towards manufacturing applications, compared to only 3% in the United States — reflecting a deliberate strategy of deploying AI to strengthen industrial competitiveness. DeepSeek's launch in January 2025 of a large language model with comparable performance to OpenAI at a fraction of the cost challenged the assumption that US companies maintained an insurmountable lead. China's Ministry of Industry and Information Technology has identified humanoid robots as the next disruptive industrial product. Sources: VFuture Media 2025; Pictet 2026; Thailand Business News July 2026.
What are the main weaknesses in China's economy?
Erneroy.com Research identifies three primary structural challenges in the Chinese economy. First, youth unemployment: the NBS reported youth unemployment of 16.5% for ages 16-24 in December 2025, reflecting a mismatch between higher education output and labour market demand. Second, property market weakness: China's real estate sector, which was a primary driver of middle-class wealth creation, remains in a structural slowdown that has dampened consumer confidence and balance sheets. Third, the consumption-investment imbalance: Thailand Business News' July 2026 analysis described 'structural caution on consumption' as a brake on the domestic demand China needs to rebalance its economy away from export and investment dependence. Goldman Sachs noted that US tariff pressures remain a real factor, even as Chinese export routes are diversifying around direct US-China trade through third countries and Belt and Road Initiative partners. Sources: Chinese NBS December 2025; Thailand Business News July 2026; Goldman Sachs 2026.
0 Comments
Be the first to share your thoughts on this article.