
Investing
What Is a Stock Market Quote? Accountant Explains


Table of Contents
- The Snapshot That Tells You Everything — If You Know How to Read It
- What Is a Stock Market Quote?
- Reading a Live Stock Quote: A Complete Annotated Example
- Every Quote Field Explained: The Complete 2026 Reference
- The Bid-Ask Spread: The Most Important Thing New Investors Misunderstand
- Bid-Ask Spreads by Stock Type: The 2026 Comparison
- Real-Time vs Delayed Quotes: Why It Matters in 2026
- How to Use a Stock Quote: The Investor's Decision Framework
- Five Costly Mistakes Investors Make Reading Stock Quotes
- Conclusion
- Frequently Asked Questions (FAQ)
The Snapshot That Tells You Everything — If You Know How to Read It
Every time you look up a stock — on your broker app, on Yahoo Finance, on Bloomberg, on any financial website in the world — you are presented with a stock market quote. At first glance, it is a wall of numbers: a price, a couple of other prices, a percentage change, and a string of abbreviations and figures that together are supposed to tell you something important about a company and its shares. For new investors, the quote can feel overwhelming. For experienced investors, reading it takes a fraction of a second. The difference between those two states is simply knowledge of what each field means — and that is exactly what this guide provides.A stock market quote is, at its most fundamental level, a real-time or near-real-time summary of the trading activity in a single security at a given moment. TSGBrokers (May 2026): 'A stock quote is a real-time or delayed snapshot of a stock's current trading data. It shows the last traded price, the current bid and ask prices, trading volume, and a range of other statistics. Every broker platform, financial website, and trading terminal displays quotes — the fields are largely standardised across all of them.' The standardisation is the good news: learn how to read one stock quote, and you can read them all.
But there is one piece of knowledge that distinguishes the informed investor from the beginner, and it is not complicated: the last price is not the price you pay. The bid-ask spread — the gap between the price at which buyers are bidding and sellers are asking — is both the mechanism of market pricing and an invisible cost that every investor pays on every trade. In 2026, with 400 million active retail traders (Volity, May 2026), understanding every line of a stock quote is not academic preparation for trading — it is the practical minimum required to participate in financial markets without making preventable and expensive mistakes.
What Is a Stock Market Quote?
A stock market quote is a concise summary of a security's current trading data, sourced directly from an exchange and delivered in real-time or with a delay of typically 15 minutes, depending on the data provider. Longbridge (December 2025): 'A stock quote is a concise summary of a security's trading activity at a given moment, typically sourced directly from an exchange. It shows the latest price at which a trade occurred (last price), the best available prices to buy (bid) and sell (ask), the volume of shares available at those prices, and statistical measures like day high/low and trading volume.'Stock quotes are generated by the exchange's matching system — the electronic engine that matches buy orders with sell orders and records every transaction. In the United States, quote data is consolidated across multiple exchanges through the National Best Bid and Offer (NBBO) system, which shows the best bid price available across all US exchanges and the best ask price available across all exchanges simultaneously. In the UK, the London Stock Exchange publishes quotes for securities listed on its markets through its trading system. The result in both cases is a real-time stream of price and volume data that flows from the exchange through data vendors (Bloomberg, Refinitiv, IEX, Yahoo Finance) to investors' screens.
The critical distinction TSGBrokers (May 2026) makes is between real-time and delayed quotes: 'Quotes come in two versions: real-time and delayed. Real-time quotes update continuously during market hours. Delayed quotes — typically 15 minutes behind — are the default on free financial websites. As a trader, you need real-time quotes. Most brokers provide them free with an account. Never make a trade decision based on a delayed quote.' A stock that was trading at £50.00 fifteen minutes ago may be at £48.00 or £52.00 now. Using a delayed quote to place a trade is like driving using a map of where the road was fifteen minutes ago.
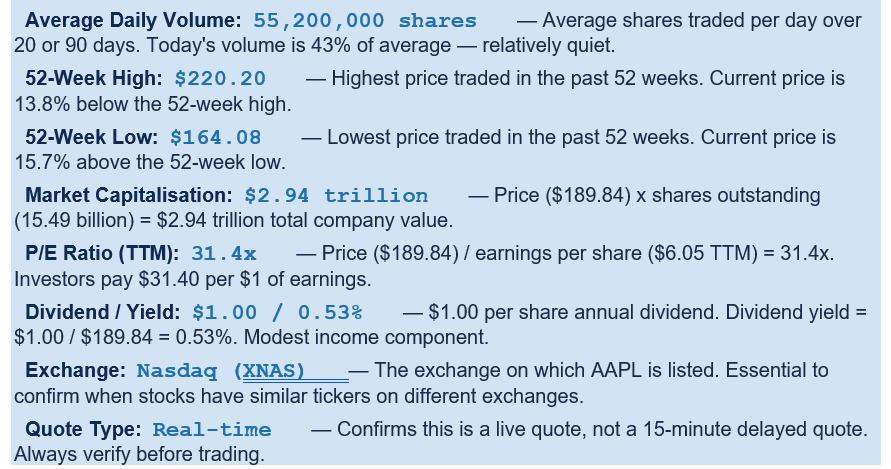
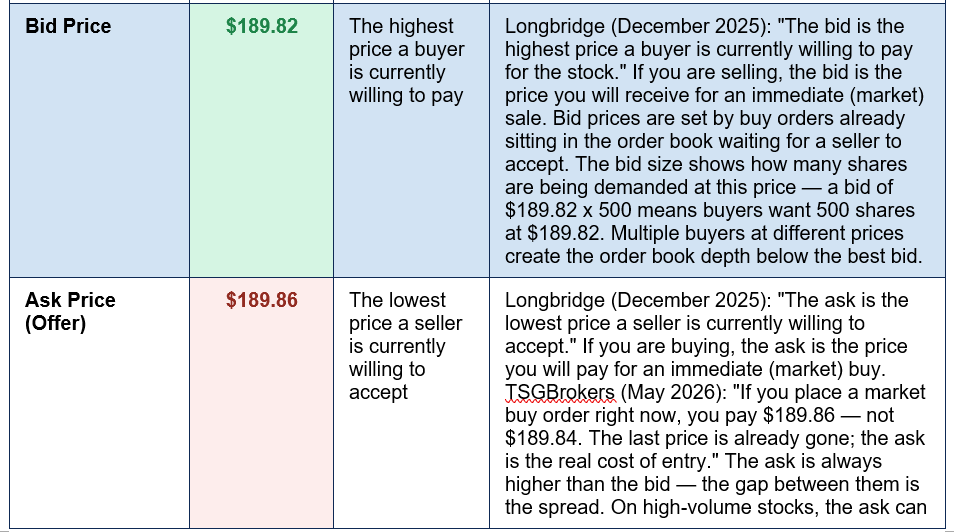
Stock market quotes in 2026 — key data: Blue-chip bid-ask spreads as narrow as $0.01 on NYSE (2026). 400 million active retail traders globally. A 0.5% spread per trade can consume 10% of annual returns. — Volity (May 30, 2026): 'High-liquidity stocks in 2026 maintain spreads as narrow as $0.01, ensuring minimal friction for 400 million active retail traders. Blue-chip stocks typically have spreads below 0.05%, while small-cap stocks can see spreads exceeding 1.0% during quiet sessions (Nasdaq Economic Research, 2026). A 0.5% cost on each trade can consume 10% of annual returns for active traders.' TSGBrokers (May 6, 2026): AAPL example — Last $189.84, Bid $189.82, Ask $189.86. If you place a market buy, you pay $189.86 — not the last price.
Reading a Live Stock Quote: A Complete Annotated Example
The following is a complete annotated stock quote — all fields explained using a realistic example based on Apple Inc. (AAPL) as illustrated by TSGBrokers (May 2026). Every field shown here appears on virtually every broker platform and financial website: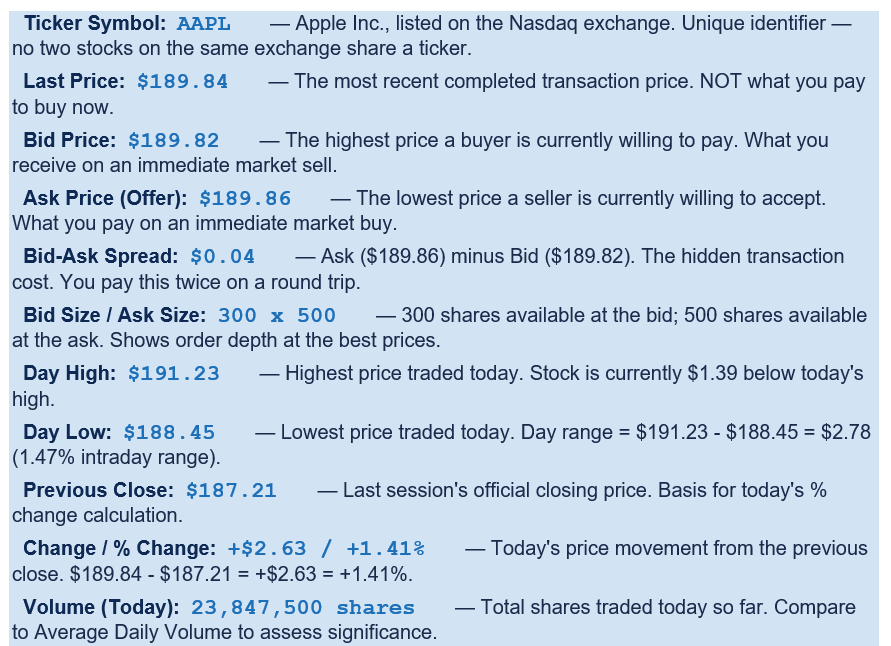
Every Quote Field Explained: The Complete 2026 Reference
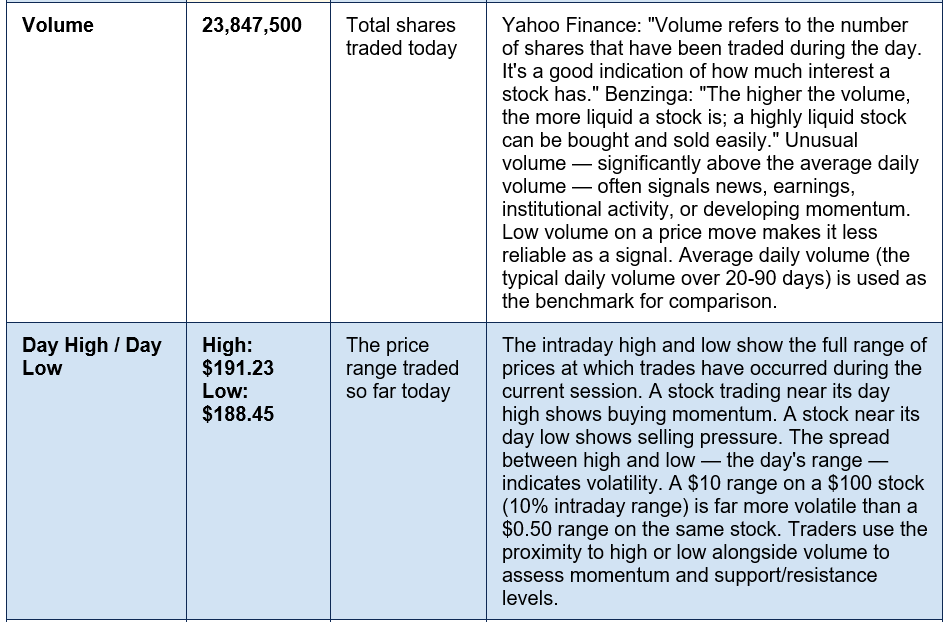
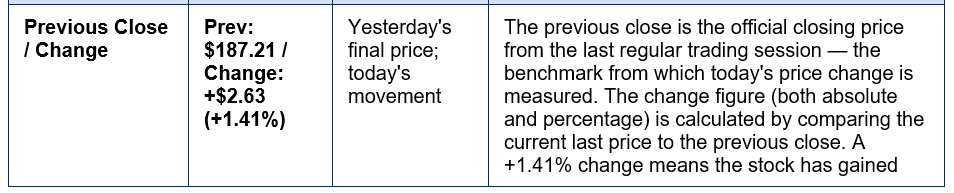
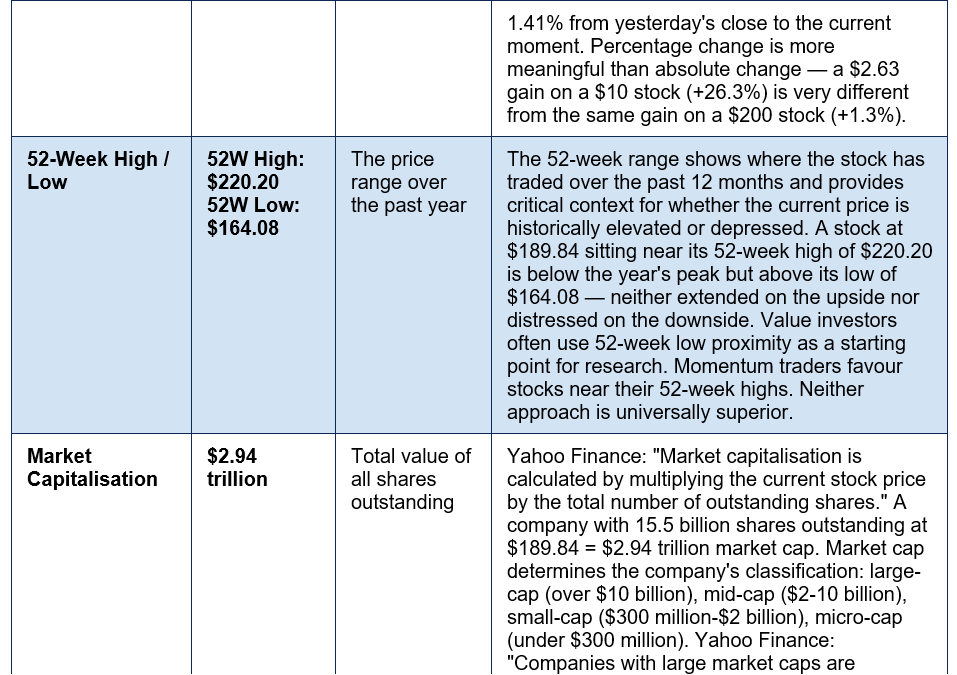
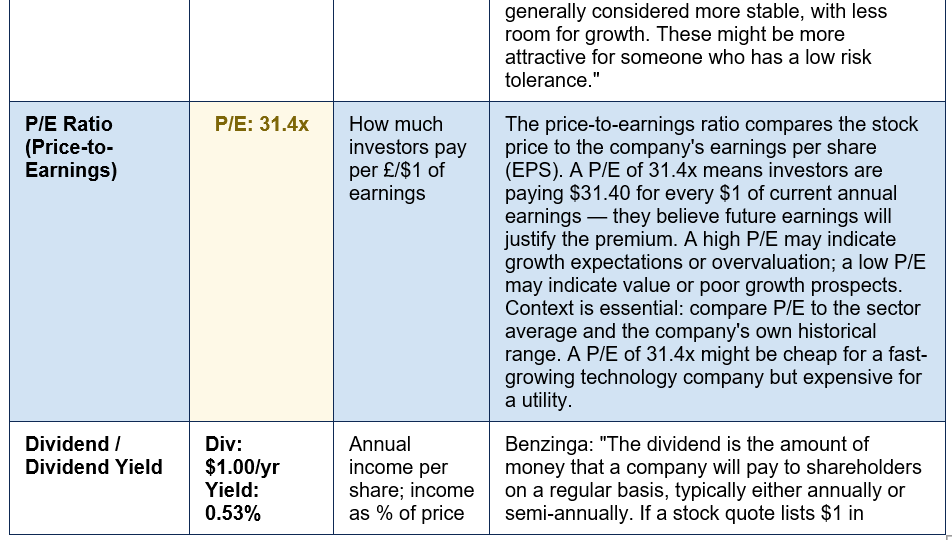
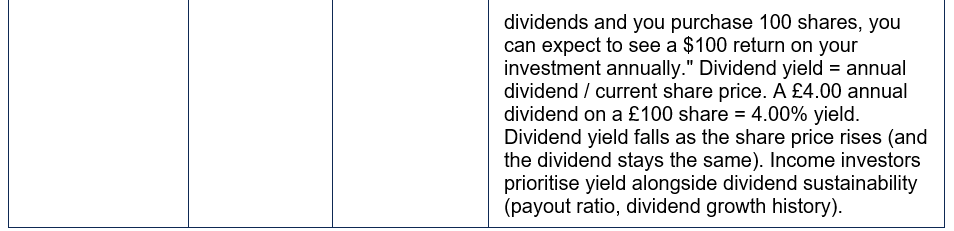
The following table provides the definitive reference for every major field in a stock market quote — what it shows, what it means, and how to use it correctly: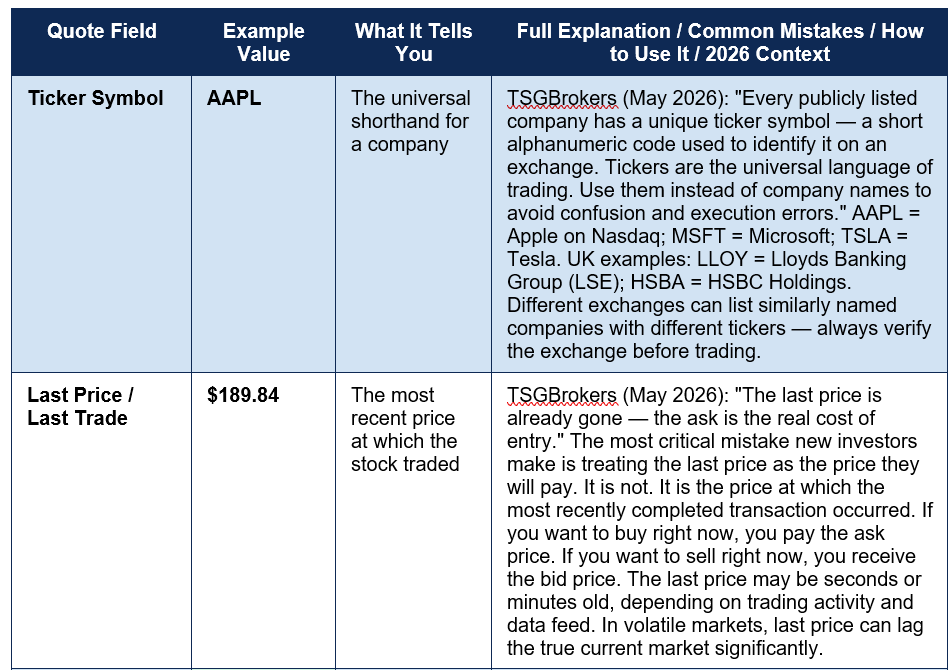
The Bid-Ask Spread: The Most Important Thing New Investors Misunderstand
The bid-ask spread is the single most important concept in stock quote reading for any investor who actually intends to buy or sell shares. It is also the concept most consistently misunderstood by new investors — because the last price appears to be the relevant number, and the bid and ask prices look like minor variations around it. They are not minor variations. They are the actual prices of every transaction.The spread exists because of the structure of modern markets. There are always two sets of participants: buyers (who place bids at the price they are willing to pay) and sellers (who place asks at the price they are willing to accept). The spread — the gap between the highest bid and the lowest ask — represents the current disagreement between the most motivated buyer and the most motivated seller. Market makers (professional firms that provide liquidity by continuously quoting both a bid and an ask) earn the spread as compensation for the risk of holding inventory. Volity (May 2026): 'The bid represents immediate demand, while the ask reflects immediate supply. They serve as the starting point for every buy and sell decision made by investors in 2026.'
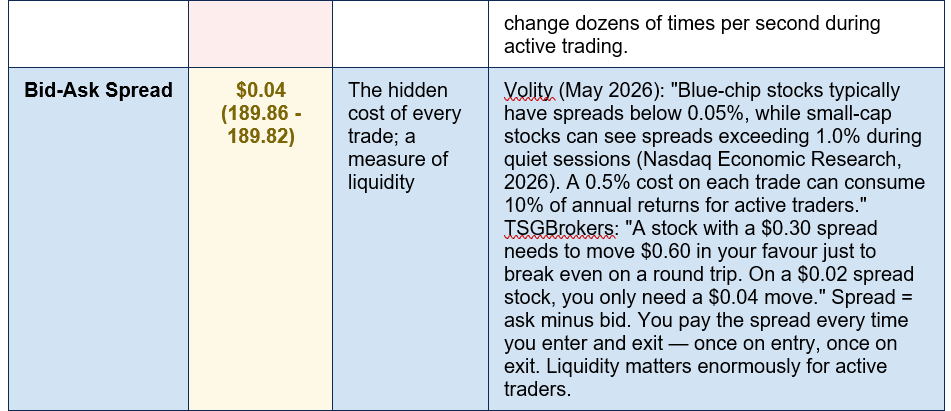
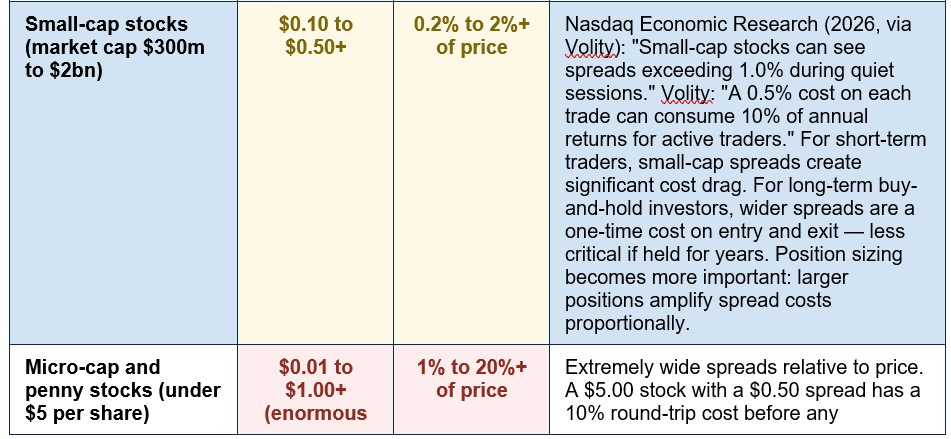
The spread cost calculation every investor needs to know: Suppose you buy 100 shares of a stock at the ask price of $50.10, then immediately sell at the bid price of $49.90. You have paid $0.20 per share in spread — $20.00 total on 100 shares — without the stock moving at all. You needed the price to rise $0.20 before you broke even, just from the spread. TSGBrokers (May 2026): 'Every time you enter and exit a position, you pay the spread twice — once on entry, once on exit.' This is why liquidity matters so much: on Apple (AAPL) with a $0.04 spread, the round-trip cost on 100 shares is just $8. On a micro-cap stock with a $0.50 spread, the same 100 shares cost $100 in spread before any brokerage commission. Volity confirms: 'A 0.5% cost on each trade can consume 10% of annual returns for active traders.' Long-term buy-and-hold investors pay the spread only twice — on entry and eventual exit — making it a one-time cost. Active traders who buy and sell frequently pay it on every transaction, making spread efficiency critical to overall returns.
Bid-Ask Spreads by Stock Type: The 2026 Comparison
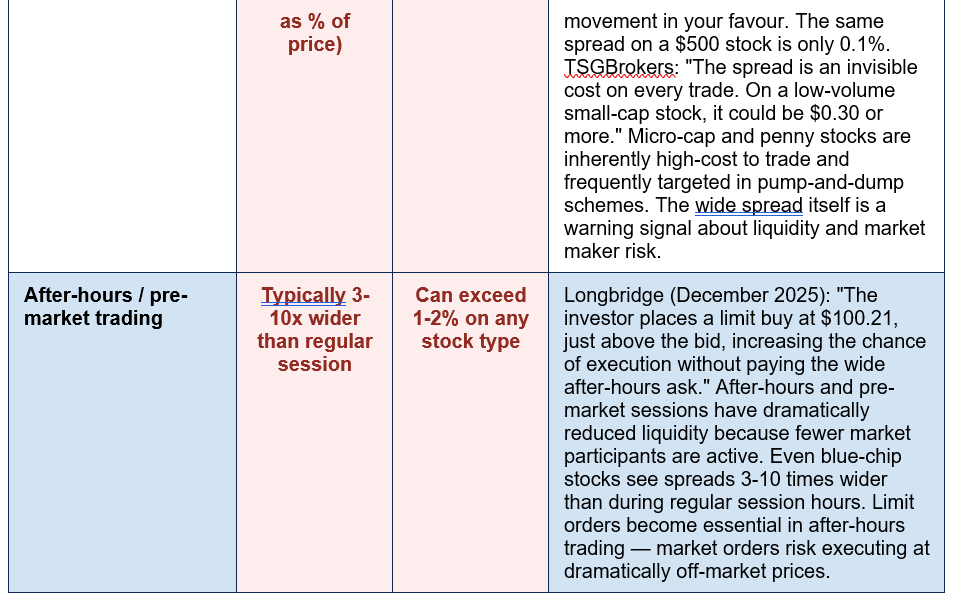
The width of the bid-ask spread varies enormously depending on the type of stock, its trading volume, and the market conditions at the time. The following table maps the spread landscape across every major category, using 2026 data from Volity (May 2026), TSGBrokers (May 2026), and Nasdaq Economic Research (2026):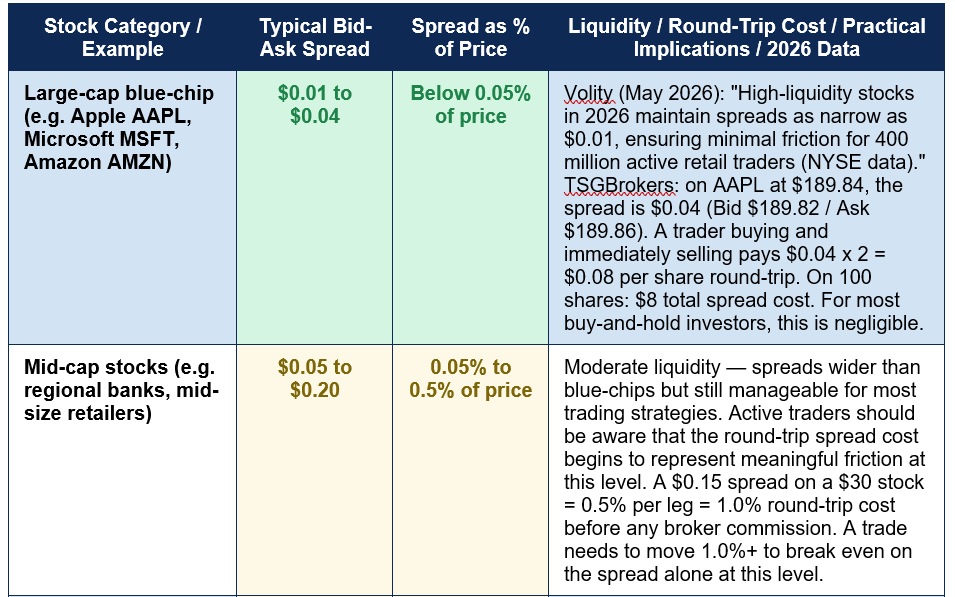
Real-Time vs Delayed Quotes: Why It Matters in 2026
The distinction between real-time and delayed stock quotes is one of the most practically important things an investor needs to understand before placing any trade. Most free financial websites — Google Finance, Yahoo Finance, MSN Money — provide quotes with a 15-minute delay by default. Most brokerage accounts provide real-time quotes free of charge once an account is opened and funded.TSGBrokers (May 2026): 'Never make a trade decision based on a delayed quote.' The consequences of acting on a delayed quote can be severe in volatile markets. A stock that was trading at £50.00 fifteen minutes ago on a delayed quote might now be at £45.00 following a piece of negative news released during those fifteen minutes — and a market buy order placed based on the £50.00 delayed quote would execute at whatever the current market price is, not the price that was showing. The investor has no way to know they are buying at a significant premium to where they expected to be unless they have a real-time quote.
Longbridge (December 2025) identifies a practical strategy for after-hours trading where spreads widen dramatically: 'The investor places a limit buy at $100.21, just above the bid, increasing the chance of execution without paying the wide after-hours ask. The investor monitors VWAP and volume to benchmark the quality of their fill. Alerts are set for abnormal spread widening or volume spikes after earnings.' The practical lesson: whenever quotes show unusual spread width (after hours, around earnings announcements, in thin markets), limit orders — which specify the maximum price you are willing to pay — protect you from executing at an unexpectedly bad price.
The Volume-Weighted Average Price (VWAP) is an additional quote-adjacent tool: it shows the average price at which a stock has traded across the session, weighted by the volume at each price level. VWAP is used by institutional traders as a benchmark — if you buy below VWAP, you executed better than the day's average; above VWAP, worse. Most broker platforms now display VWAP alongside the standard quote fields, making it accessible to retail investors as well.
How to Use a Stock Quote: The Investor's Decision Framework
Reading a stock quote and knowing how to use one productively in investment decisions are two different skills. The following framework covers the practical application of each quote field to real investment decisions:- Assessing current value: Use the last price in the context of the 52-week range to understand where the stock sits historically. A stock at $189.84 trading between a 52-week low of $164.08 and a high of $220.20 sits in the lower-middle of its range — not extended on the upside. Then use the P/E ratio (31.4x for AAPL) to compare against sector peers and the company's historical P/E average. Context determines whether a P/E is cheap or expensive — a 31.4x P/E is moderate for a technology company with strong earnings growth.
- Deciding between a market order and a limit order: A market order executes immediately at the current best ask (for a buy) or best bid (for a sell) — you get speed but no price guarantee. A limit order specifies the maximum price you will pay (for a buy) or minimum price you will accept (for a sell) — you get price certainty but no execution guarantee. On liquid blue-chip stocks with penny-wide spreads, market orders are usually fine. On small-cap stocks, thinly traded securities, or during after-hours sessions, always use limit orders.
- Interpreting volume signals: Compare today's volume (23,847,500) to the average daily volume (55,200,000 for AAPL). Today's volume at 43% of average is relatively quiet — the price move (+1.41%) on below-average volume is less significant than the same move on double-average volume. An unusually high volume move — say, 3x average volume — signals broad market participation and gives the price movement considerably more weight. Volume spikes without accompanying news often precede significant announcements.
- Screening for income: Use the dividend yield field to compare income across stocks. A stock paying 4% dividend yield requires significantly less price appreciation to generate a total return target than a 0.5% yielder. However, yield alone is insufficient — always check the payout ratio (dividend as a % of earnings) and dividend growth history to assess whether the dividend is sustainable. A 10% dividend yield on a company paying out 150% of earnings is unsustainable; a 3% yield on 40% of earnings has room to grow.
- Evaluating size and risk: Yahoo Finance: 'Companies with large market caps are generally considered more stable.' Use market cap to classify the stock and calibrate risk expectations. A £50 billion market cap company (large-cap) will typically have lower return volatility than a £200 million small-cap — and the quote spread confirms this: smaller companies have wider spreads reflecting lower liquidity and higher execution risk.
THE INVESTOR'S STOCK QUOTE READING CHECKLIST — BEFORE EVERY TRADE: (1) IS THE QUOTE REAL-TIME? Check whether your data source is showing live or delayed data. Never trade on a 15-minute delayed quote. (2) WHAT IS THE ASK PRICE? Not the last price. If buying, the ask is what you pay. Set your order price or limit accordingly. (3) HOW WIDE IS THE SPREAD? Spread wider than 0.5% of the price = investigate liquidity. Wide spreads increase your cost significantly on entry and exit. (4) HOW DOES TODAY'S VOLUME COMPARE TO AVERAGE? High volume gives price moves more weight. Low volume makes them less reliable as signals. (5) WHERE IS THE PRICE IN THE 52-WEEK RANGE? Near the low vs near the high provides critical context for value assessment. (6) IS THE P/E REASONABLE FOR THE SECTOR? Compare to sector average and historical range — not in isolation. (7) IS THE DIVIDEND SUSTAINABLE? Check payout ratio alongside yield — high yield with high payout ratio is a red flag.
Five Costly Mistakes Investors Make Reading Stock Quotes
Understanding what the fields mean is necessary but not sufficient. The following five mistakes are the most common — and most expensive — errors investors make when reading and acting on stock quotes:- Treating the last price as the trading price: TSGBrokers (May 2026): 'If you place a market buy order right now, you pay $189.86 — not $189.84. The last price is already gone; the ask is the real cost of entry.' This is the single most common beginner mistake. The last price is historical data. The ask price is what it costs to buy now.
- Using delayed quotes for trading decisions: TSGBrokers: 'Never make a trade decision based on a delayed quote.' A 15-minute delay in a fast-moving market can represent the difference between a good entry and a significant loss. Confirm your data source shows real-time data before placing any order.
- Ignoring the spread on small-cap stocks: Volity (May 2026): 'A 0.5% cost on each trade can consume 10% of annual returns for active traders.' A $0.30 spread on a $15 stock = 2% round-trip cost before any broker commission. Your investment needs to gain 2% before you have broken even from the spread alone. This cost is invisible because it never appears as a line item — but it is always there.
- Interpreting high P/E as always expensive: A high P/E in isolation is meaningless without sector context and growth expectations. A P/E of 35x for a technology company growing earnings at 25% per year (PEG ratio of 1.4x) may be reasonable. A P/E of 20x for a utility company growing at 2% per year (PEG of 10x) may be extremely expensive. Always compare P/E to the sector average and the company's own growth rate.
- Confusing dividend yield with dividend safety: A 10% dividend yield that is about to be cut is worth less to an investor than a 3% yield growing 10% per year. Always check the payout ratio (dividends / earnings). Benzinga: 'If a stock quote lists $1 in dividends and you purchase 100 shares, you can expect to see a $100 return on your investment annually.' But only if the dividend is sustained — which requires checking the underlying business fundamentals, not just the yield figure in the quote.
THE QUOTE DELAY DANGER — A REAL COST THAT IS EASY TO MISS: Free financial websites typically display stock quotes delayed by 15 minutes. Investors who do not realise this can place market orders based on prices that are significantly different from the current actual price. During earnings announcements, economic data releases, or geopolitical events, stock prices can move 5-20% in minutes. An investor looking at a quote showing £50.00 on a delayed feed that is actually trading at £43.00 real-time — and placing a market buy order — would execute at approximately £43.00 despite expecting to pay £50.00. The reverse scenario (buying what appears to be a falling stock that has already recovered) is equally dangerous. Solution: always confirm that your data source is showing real-time data (look for a 'real-time' or 'RT' label, or the absence of a 'delayed 15 mins' notice) before placing any order. All major brokerage platforms provide real-time quotes to account holders at no additional charge — use the broker platform, not a free financial website, for trading decisions.
Conclusion
A stock market quote is the fundamental unit of information in financial markets — a standardised, real-time summary of everything the market currently knows about the price and trading activity of a security. Understanding every field in a stock quote is not an advanced skill reserved for professional traders. It is the baseline literacy required for anyone who buys or sells shares, whether through a pension fund, an ISA, a broker app, or any other investment vehicle.The most important insights from this guide: the last price is not what you pay — the ask price is what it costs to buy now, and the bid price is what you receive on an immediate sale. The bid-ask spread is a real, unavoidable transaction cost that accumulates across every entry and exit — on blue-chip stocks it is a negligible $0.01-$0.04, but on small-cap stocks it can exceed $0.30, requiring the price to move significantly before a position is profitable. The P/E ratio and dividend yield require sector context to be meaningful — a high P/E may be cheap for a fast-growing company and expensive for a slow-growing one. Volume confirms or casts doubt on price signals — high volume gives moves weight, low volume makes them less reliable.
In 2026, with 400 million active retail traders accessing markets through apps and online platforms, financial literacy starts with the quote screen. The fields that once required professional training to interpret are now displayed on every investor's phone. The knowledge to read them correctly — every field, with every caveat — is what separates an investor who makes informed decisions from one who makes expensive, preventable mistakes. This guide has given you the latter.
0 Comments
Be the first to share your thoughts on this article.