

Retirement
3 Reasons Retirement Is Cheaper Than You Think

Key Statistics: J.P. Morgan Asset Management: average retiree spending declines more than 30% between ages 60 and 85. 60% of new retirees see annual expenses fluctuate by more than 20% in the first three years (J.P. Morgan, Dec 2025). Bureau of Labor Statistics: consumers 75+ spend approximately $53,000/year; 45–54 year-olds spend over $97,000/year — a 45% decline. Wealthvieu (May 2026): 80% rule may be too high — many retirees spend only 60–70% of pre-retirement income. Many retirees in underfunded or funded categories do NOT increase spending over time (PlanAdviser, July 2026). Location can reduce retirement expenses 20–30% vs peak-earning cities. Social Security COLA 2026: 2.8%. Bank of America: Baby Boomers/Traditionalists show faster spending growth since 2022, partly from COLA boosts and equity wealth effects. CAVEAT: Fidelity: 65-year-old retiring in 2026 will spend $185,500 on healthcare over lifetime. Milliman: healthy 65-year-old couple projected to spend up to $637,000 on healthcare in lifetime (2026 index). Long-term healthcare inflation rate: 5.8% (HealthView Services 2026). Allianz 2026 Annual Retirement Study: ‘every day is Saturday in retirement’ — but Americans still spend more than non-retirees expect.
The Allianz 2026 Annual Retirement Study found a notable disconnect between pre-retirees’ expectations and retirees’ reality. The study found that Americans who are still working tend to think they will spend less than retirees say they actually do — but the specific fear that dominates is the opposite: that retirement will be devastatingly expensive, requiring near-perfect savings and flawless investment returns to sustain.
The data tells a more nuanced and, for many people, more encouraging story. Three documented and research-supported reasons mean that retirement is likely to cost significantly less than the most fearful scenarios suggest. This article explains each one, quantifies it with current data, and — critically — also explains the one major exception to the good news: the cost that does not decline, and that deserves its own dedicated planning.
Wealthvieu’s May 2026 analysis of average retirement spending data from the Bureau of Labor Statistics puts this plainly: the 80 percent rule may be too high. Many retirees spend only 60 to 70 percent of pre-retirement income, especially once the mortgage is paid off, children have left home, and work-related costs are eliminated.
The 80 percent rule was derived from aggregate income-replacement data at the population level, and it may be approximately accurate for some retirees. But the aggregate figure conceals enormous variation. A household that spends 35 percent of its pre-retirement income on mortgage payments, commuting, work clothing, and childcare costs will see those costs disappear at retirement. For that household, 60 percent replacement rate may be more than sufficient. The 80 percent rule is a starting point for planning conversations, not a universal law.
Wealthvieu, May 2026: The 80% rule may be too high — many retirees spend 60–70% of pre-retirement income, especially once the mortgage is gone. Location matters — retiring in a lower-cost region can reduce expenses 20–30% and dramatically lower your required retirement savings.
J.P. Morgan Asset Management’s December 2025 report, ‘Retirement by the Numbers,’ found that average retiree spending declines by more than 30 percent between ages 60 and 85. This is a large, well-documented trend driven by genuine changes in lifestyle, activity level, and expenditure priorities rather than financial distress. The same report found that 60 percent of new retirees see their annual expenses fluctuate by more than 20 percent in the first three years of retirement.
Bureau of Labor Statistics Consumer Expenditure Survey data, analysed by PlanAdviser in July 2026, confirms the broader pattern: consumers aged 75 and older spend approximately $53,000 per year; the highest-spending age group, 45 to 54 year olds, spends over $97,000 per year. That is a 45 percent decline in average spending between peak earning years and later retirement. The spending categories that decline most significantly in retirement are transportation (no commuting, car payments decline), food away from home (dining out less in later years), clothing, and entertainment spending. The spending that rises is housing maintenance and, most significantly, healthcare.
Planning Takeaway: Plan for three distinct budgets: a generous budget for the go-go years (65–75), a moderate budget for the slow-go years (75–84), and a lower discretionary budget for the no-go years (85+) alongside a specific, separately funded healthcare and long-term care reserve. Most retirement calculators that use a single constant spending figure dramatically overestimate total lifetime spending requirements.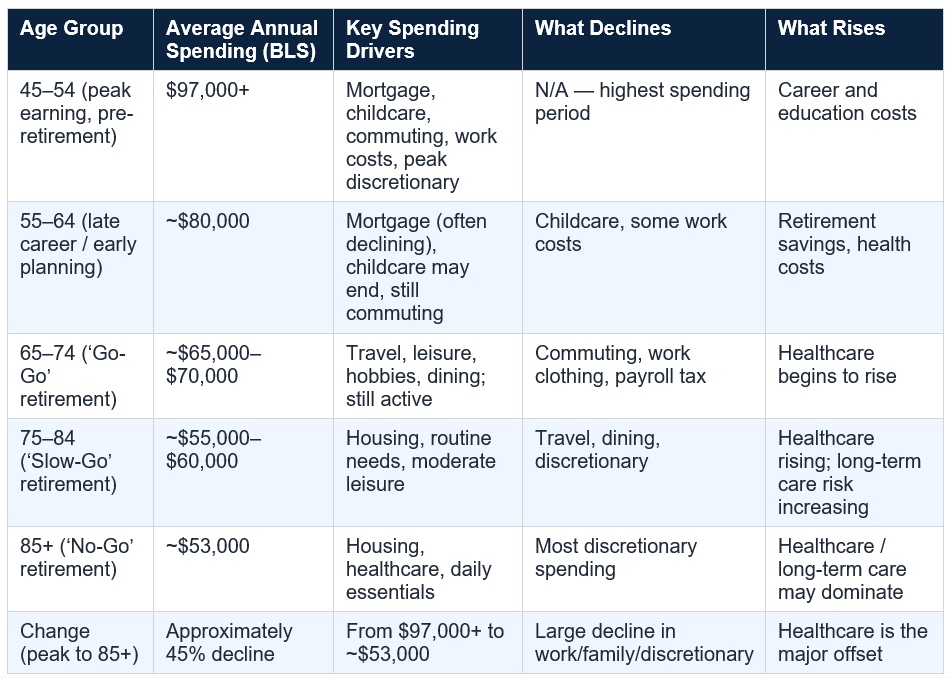
The spending decline documented here is not a story of deprivation. It is a story of changing needs. A 50-year-old at peak career spending is paying for a mortgage, two car payments, commuting costs, a wardorbe of work clothes, childcare or school fees, and a social calendar built around work colleagues. A healthy, comfortable 80-year-old has none of these costs and does not miss most of them.
In both the UK and the US, the transition out of work eliminates several categories of significant recurring expenditure that will simply not exist in retirement. These are not small adjustments. For many households, the work-related cost categories add up to 20 to 30 percent of current spending, meaning that a retiree needs to replace only 70 to 80 percent of gross income even before accounting for the natural spending decline described in Reason 1.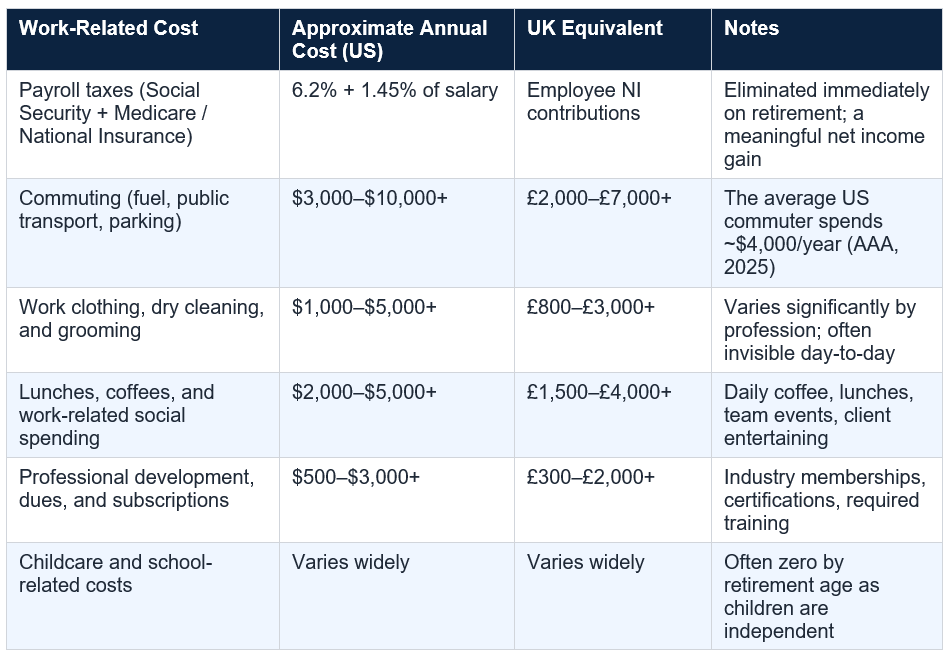
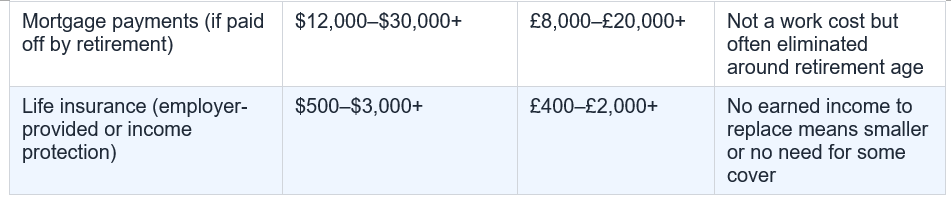
Adding these categories together, it is not unusual for a working household to find that $15,000 to $25,000 of annual spending (or £10,000 to £18,000 in the UK) simply ceases on or shortly after retirement. The retirement budget does not need to replace this spending because the retirement lifestyle does not incur it. This is a structural reduction in required income that the 80 percent rule partially accounts for but that is often better understood at the household level by specifically identifying and quantifying your own work-related costs.
Planning Takeaway: Before your retirement date, spend one month tracking every cost that is directly or indirectly related to your employment. Add it all up. This is money you will not spend in retirement. Subtract it from your current spending to get a more realistic baseline for your retirement income requirement.
During working years, location is often constrained by employment. Most people live where their job is, and where their job is determines whether they live in an expensive city or an affordable region. Retirement removes this constraint for most people entirely. For the first time, where you live can be determined by what you want — which for many retirees means a lower cost of living without any sacrifice of quality of life.
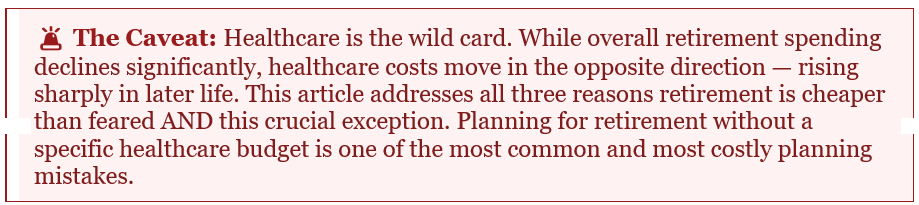
MoneyTalksNews’s August 2026 analysis puts it directly: budget more for the early, active years. Expect relief later. And set aside real money for healthcare, because that bill only moves in one direction. This is not a minor qualification. For US retirees in particular, healthcare is the single cost category that can overrun a carefully planned retirement budget.
HealthView Services projects a long-term healthcare inflation rate of 5.8 percent for 2026 — significantly above general CPI inflation and significantly above the 2.8 percent Social Security COLA for 2026. This structural mismatch — healthcare costs rising at 5.8 percent while Social Security income adjusts at 2.8 percent — means that healthcare will consume an ever-growing share of retirement income over time.
The variation by coverage choice is significant:
UK retirees do face healthcare-related costs: prescription charges for those under 60 in England, dental care (NHS dental services are less available than they once were), optical care, and the major financial exposure of social care and residential care in later life. Social care in the UK is means-tested and can consume significant assets for those who require residential care in their final years — with average residential care costs exceeding £40,000 to £80,000 per year depending on location and level of care required.
The UK government has announced but repeatedly delayed social care funding reform. As of August 2026, the means-testing rules continue to require individuals to fund their own care until assets fall below a specific threshold. For UK retirement planning, long-term care is the healthcare-equivalent wild card that deserves specific financial planning attention — even though routine healthcare costs do not represent the same magnitude of financial risk as in the US.
This suggests that for the majority of retirees, the feared scenario of running out of money because spending exceeds projections does not materialise in the way that conservative retirement planning assumes. Retirees at all income levels naturally and relatively painlessly reduce their spending as they age. The financial risk in retirement is not primarily that people spend too much. It is that they live longer than planned, that healthcare costs exceed healthcare reserves, or that investment returns are sequentially bad in the early years of retirement.
The most evidence-consistent retirement planning approach, based on current research, is to plan for modestly lower spending than many rules of thumb suggest (60 to 70 percent of pre-retirement income rather than 80 percent for many households), model a declining spending trajectory across retirement phases, build a specific and generously sized healthcare reserve separately from lifestyle spending, and ensure the portfolio is positioned to generate reliable income across a retirement that may last 25 to 30 years.
The important exception is healthcare. In the United States, lifetime healthcare costs for a retiring couple are projected at up to $637,000, rising at 5.8 percent annually. In the United Kingdom, routine healthcare costs are largely removed by the NHS, but social care costs in later life can be substantial and unpredictable. No honest retirement plan should present the case for spending-decline without also presenting the case for healthcare reserve.
The practical takeaway: use the good news about retirement spending decline to recalibrate your retirement number downward from the most conservative projections, invest the money you save on work costs more aggressively in the final working years, consider your location as a financial decision alongside your investment decisions, and build a dedicated, separately funded healthcare reserve. Save for the retirement you will actually have — not the one that the most frightening version of retirement planning describes.
For many households, the 80% rule overstates required retirement income. Wealthvieu’s May 2026 analysis of Bureau of Labor Statistics data found that many retirees spend only 60 to 70% of pre-retirement income, particularly once the mortgage is paid off and work-related costs are eliminated. The 80% rule may be appropriate for retirees with very low work-related costs or those expecting a highly active early retirement lifestyle, but for many middle-income households, 60 to 70% is a more accurate baseline.
How much does spending really decline in retirement?
According to J.P. Morgan Asset Management’s December 2025 report, average retiree spending declines by more than 30% between ages 60 and 85. Bureau of Labor Statistics Consumer Expenditure Survey data shows consumers aged 75 and older spend approximately $53,000 per year, compared to over $97,000 for the peak-spending 45–54 age group — a decline of approximately 45%. This decline is driven by reduced commuting, lower dining and entertainment spending, reduced travel as mobility decreases, and the disappearance of work-related costs.
What work-related costs disappear when I retire?
Significant work-related costs that disappear on or near retirement include: payroll taxes (Social Security and Medicare in the US; National Insurance contributions in the UK); commuting costs (fuel, transit passes, parking — averaging $4,000/year in the US); work clothing and grooming; work lunches and professional socialising; professional development fees and memberships; and life insurance or income protection policies tied to earned income. For many households, these total $15,000 to $25,000 per year — a structural reduction in required income that does not need to be replaced by retirement savings.
How can location affect my retirement costs?
Wealthvieu’s May 2026 analysis found that retiring in a lower-cost region can reduce expenses by 20 to 30% and dramatically lower required retirement savings. In the US, the cost of living differential between expensive coastal cities (San Francisco, New York, Seattle) and affordable mid-size cities (Knoxville, Boise, Asheville) is 40 to 60% for housing alone. In the UK, retiring outside London and the South East to lower-cost regions of England, Wales, or Scotland can produce similar savings. International retirement in countries like Portugal, Spain, or Mexico can reduce costs even further, subject to healthcare, visa, and tax planning.
How much should I budget for healthcare in retirement?
In the US, Fidelity estimates a 65-year-old retiring in 2026 will spend $185,500 on healthcare over their lifetime. The Milliman 2026 Retiree Health Cost Index projects a healthy 65-year-old couple will spend up to $637,000 over their remaining lifetimes. Healthcare inflation is projected at 5.8% annually (HealthView Services, 2026) — significantly above general inflation. A dedicated healthcare reserve, ideally funded through a Health Savings Account (HSA) during working years (triple tax-advantaged), is the recommended approach. In the UK, routine healthcare is covered by the NHS, but long-term care and residential care costs can exceed £40,000 to £80,000 per year and should be specifically planned for.
What are the go-go, slow-go, and no-go years of retirement?
These are three phases of retirement spending described by financial planners to reflect the natural evolution of retirement costs. The go-go years (roughly 65–74) are the most active and expensive — travel, leisure, dining, and new hobbies. The slow-go years (roughly 75–84) see spending decline as activity levels reduce and travel becomes less frequent. The no-go years (roughly 85+) see the lowest discretionary spending but potentially the highest healthcare costs. Planning a higher budget for the go-go years and lower budgets for subsequent phases produces a more accurate retirement financial plan than using a single constant spending figure.
Does retirement really cost less than people fear?
For most people, yes — with the important exception of healthcare. The combination of naturally declining spending over the retirement years, the elimination of work-related costs, and the flexibility to choose a lower-cost location means that retirement typically costs significantly less than peak-earning-year spending projections suggest. Research from J.P. Morgan, BLS, and Wealthvieu consistently supports this. The caveat is that healthcare costs are a genuine and growing exception — rising steeply in later retirement, outpacing general inflation, and representing a potentially large lifetime expenditure that requires specific, separate financial planning.
Table of Contents
- The Fear That May Be Bigger Than the Reality
- The 80% Rule: Why It Probably Does Not Apply to You
- REASON 1: Spending Naturally Declines as You Age
- The Go-Go, Slow-Go, and No-Go Years
- What the Spending Drop Actually Looks Like in Numbers
- REASON 2: Work-Related Costs Disappear on Day One of Retirement
- What You Stop Paying For the Moment You Stop Working
- REASON 3: Your Location Is a Financial Decision
- The Geographic Arbitrage of Retirement
- The Important Caveat: Healthcare Is the Exception
- US Healthcare Costs in Retirement: The Real Numbers
- UK Readers: The NHS Changes the Calculation Significantly
- Putting It All Together: A More Accurate Retirement Budget
- What the Research Actually Suggests You Need
- Conclusion: Save for the Retirement You’ll Actually Have
- Frequently Asked Questions
The Fear That May Be Bigger Than the Reality
Retirement planning is dominated by anxiety. Financial media, investment firms, and retirement planning calculators consistently present scenarios in which people have not saved enough, will run out of money, and face a retirement of financial hardship. This anxiety is not entirely unfounded — undersaving for retirement is a genuine and widespread problem in both the UK and the US. But the picture is also consistently distorted in one specific direction: the cost of retirement is systematically overestimated.The Allianz 2026 Annual Retirement Study found a notable disconnect between pre-retirees’ expectations and retirees’ reality. The study found that Americans who are still working tend to think they will spend less than retirees say they actually do — but the specific fear that dominates is the opposite: that retirement will be devastatingly expensive, requiring near-perfect savings and flawless investment returns to sustain.
The data tells a more nuanced and, for many people, more encouraging story. Three documented and research-supported reasons mean that retirement is likely to cost significantly less than the most fearful scenarios suggest. This article explains each one, quantifies it with current data, and — critically — also explains the one major exception to the good news: the cost that does not decline, and that deserves its own dedicated planning.
The 80% Rule: Why It Probably Does Not Apply to You
The most widely cited rule of thumb in retirement planning is the 80 percent rule: you will need 80 percent of your pre-retirement income in retirement to maintain your standard of living. This rule is used in countless retirement calculators, financial planning conversations, and retirement readiness assessments. It is also, for many people, a significant overestimate.Wealthvieu’s May 2026 analysis of average retirement spending data from the Bureau of Labor Statistics puts this plainly: the 80 percent rule may be too high. Many retirees spend only 60 to 70 percent of pre-retirement income, especially once the mortgage is paid off, children have left home, and work-related costs are eliminated.
The 80 percent rule was derived from aggregate income-replacement data at the population level, and it may be approximately accurate for some retirees. But the aggregate figure conceals enormous variation. A household that spends 35 percent of its pre-retirement income on mortgage payments, commuting, work clothing, and childcare costs will see those costs disappear at retirement. For that household, 60 percent replacement rate may be more than sufficient. The 80 percent rule is a starting point for planning conversations, not a universal law.
Wealthvieu, May 2026: The 80% rule may be too high — many retirees spend 60–70% of pre-retirement income, especially once the mortgage is gone. Location matters — retiring in a lower-cost region can reduce expenses 20–30% and dramatically lower your required retirement savings.
REASON 1: Spending Naturally Declines as You Age
The most important and most consistently documented reason that retirement is cheaper than feared is one that most retirement planning tools completely ignore: spending declines naturally and substantially as people age. Not because retirees become poorer or because they make painful sacrifices. Because their needs, desires, and capacity for expenditure change as they get older.J.P. Morgan Asset Management’s December 2025 report, ‘Retirement by the Numbers,’ found that average retiree spending declines by more than 30 percent between ages 60 and 85. This is a large, well-documented trend driven by genuine changes in lifestyle, activity level, and expenditure priorities rather than financial distress. The same report found that 60 percent of new retirees see their annual expenses fluctuate by more than 20 percent in the first three years of retirement.
Bureau of Labor Statistics Consumer Expenditure Survey data, analysed by PlanAdviser in July 2026, confirms the broader pattern: consumers aged 75 and older spend approximately $53,000 per year; the highest-spending age group, 45 to 54 year olds, spends over $97,000 per year. That is a 45 percent decline in average spending between peak earning years and later retirement. The spending categories that decline most significantly in retirement are transportation (no commuting, car payments decline), food away from home (dining out less in later years), clothing, and entertainment spending. The spending that rises is housing maintenance and, most significantly, healthcare.
The Go-Go, Slow-Go, and No-Go Years
Retirement planning professionals often use the concept of three phases of retirement to illustrate the spending trajectory most people follow. MoneyTalksNews describes this pattern succinctly: planners call these the go-go, slow-go, and no-go years — a spending trajectory that resembles a downhill slope with one uphill stretch.Go-Go Years (Typically 65–74)
The first phase of retirement is often the most expensive. Newly retired people are physically active, eager to travel, socialise, pursue hobbies, and do the things they deferred during working years. Spending in the go-go years can be close to or even above pre-retirement spending levels. This is the ‘every day is Saturday’ phase that the Allianz 2026 Annual Retirement Study references. Budget generously for this phase: you are likely to spend more than you expect, and you have the energy to enjoy it.Slow-Go Years (Typically 75–84)
By the mid-70s, activity levels begin to naturally reduce. Long-distance travel becomes less frequent. Dining out and entertainment spending decreases. Physical limitations reduce some discretionary spending. This is the phase where the 30-percent spending decline documented by J.P. Morgan begins to materialise. Retirees in this phase are generally spending significantly less on discretionary items than they did in their early retirement years, though their routine costs remain and healthcare begins to feature more prominently.No-Go Years (Typically 85+)
In the final phase of retirement, mobility is most restricted and discretionary spending is at its lowest. Travel, dining, and entertainment have largely been replaced by more modest daily routines. This is where the Bureau of Labor Statistics data showing 75-and-older households spending approximately $53,000 per year reflects reality. However, it is also where long-term care costs may emerge as the dominant expenditure — which is why healthcare planning cannot be deferred.Planning Takeaway: Plan for three distinct budgets: a generous budget for the go-go years (65–75), a moderate budget for the slow-go years (75–84), and a lower discretionary budget for the no-go years (85+) alongside a specific, separately funded healthcare and long-term care reserve. Most retirement calculators that use a single constant spending figure dramatically overestimate total lifetime spending requirements.
What the Spending Drop Actually Looks Like in Numbers
The spending decline documented here is not a story of deprivation. It is a story of changing needs. A 50-year-old at peak career spending is paying for a mortgage, two car payments, commuting costs, a wardorbe of work clothes, childcare or school fees, and a social calendar built around work colleagues. A healthy, comfortable 80-year-old has none of these costs and does not miss most of them.
REASON 2: Work-Related Costs Disappear on Day One of Retirement
The second reason retirement is cheaper than most calculations suggest is one of the most obvious and most consistently underweighted in retirement planning: you stop incurring work-related costs the moment you stop working. These costs are substantial, pervasive, and often invisible to pre-retirees because they are embedded in the routine of working life and never separately itemised.In both the UK and the US, the transition out of work eliminates several categories of significant recurring expenditure that will simply not exist in retirement. These are not small adjustments. For many households, the work-related cost categories add up to 20 to 30 percent of current spending, meaning that a retiree needs to replace only 70 to 80 percent of gross income even before accounting for the natural spending decline described in Reason 1.
What You Stop Paying For the Moment You Stop Working
Adding these categories together, it is not unusual for a working household to find that $15,000 to $25,000 of annual spending (or £10,000 to £18,000 in the UK) simply ceases on or shortly after retirement. The retirement budget does not need to replace this spending because the retirement lifestyle does not incur it. This is a structural reduction in required income that the 80 percent rule partially accounts for but that is often better understood at the household level by specifically identifying and quantifying your own work-related costs.
Planning Takeaway: Before your retirement date, spend one month tracking every cost that is directly or indirectly related to your employment. Add it all up. This is money you will not spend in retirement. Subtract it from your current spending to get a more realistic baseline for your retirement income requirement.
REASON 3: Your Location Is a Financial Decision
The third reason retirement is cheaper than many people fear is one that is within their direct control: where you choose to live. Wealthvieu’s May 2026 analysis makes the point clearly: retiring in a lower-cost region can reduce expenses 20 to 30 percent and dramatically lower your required retirement savings. Location is not a lifestyle footnote in retirement planning. It is a financial decision with consequences as large as any investment choice.During working years, location is often constrained by employment. Most people live where their job is, and where their job is determines whether they live in an expensive city or an affordable region. Retirement removes this constraint for most people entirely. For the first time, where you live can be determined by what you want — which for many retirees means a lower cost of living without any sacrifice of quality of life.
The Geographic Arbitrage of Retirement
Geographic arbitrage — the strategy of choosing where to live based on cost of living relative to your income — is one of the most powerful tools available to retirees. The cost of living differential between expensive cities and affordable regions in both the UK and the US is substantial:US Examples
A retiree living in San Francisco with a mortgage faces some of the highest housing, grocery, and utility costs in the United States. The same retiree moving to Asheville, North Carolina, Boise, Idaho, or the Knoxville, Tennessee area can reduce housing costs by 40 to 60 percent while maintaining or improving quality of life, weather, access to healthcare, and recreational opportunities. The Social Security income and pension that ‘barely works’ in San Francisco may provide a comfortable lifestyle in a mid-cost city.UK Examples
A retiree in London paying high rents or maintaining a large family home in an expensive commuter area faces costs that bear little relation to what the same person could live on comfortably in the Yorkshire Dales, the Scottish Borders, or a mid-sized town in Wales or the Midlands. UK housing costs outside major cities and the South East are dramatically lower than in London and the surrounding region, and the quality of life — including access to nature, community, and lower traffic — is frequently higher.International Retirement
For those willing to consider living abroad, the cost differential is even more dramatic. Spain, Portugal, Mexico, Thailand, and many other countries offer retirees a high standard of living at a fraction of US or UK costs. Portugal’s Non-Habitual Resident (NHR) tax regime and relatively low property costs make it particularly attractive to UK and European retirees. Mexico’s proximity to the US and the established expat communities in places like San Miguel de Allende or the Riviera Maya make it appealing to American retirees. These international options require careful planning around healthcare, visas, and tax obligations but are viable and increasingly popular.The Important Caveat: Healthcare Is the Exception
Every honest analysis of retirement costs must confront the healthcare exception. While overall retirement spending declines substantially as people age, healthcare spending moves in the opposite direction — rising steeply in later life, and in the United States, rising to figures that can fundamentally reshape the retirement budget.MoneyTalksNews’s August 2026 analysis puts it directly: budget more for the early, active years. Expect relief later. And set aside real money for healthcare, because that bill only moves in one direction. This is not a minor qualification. For US retirees in particular, healthcare is the single cost category that can overrun a carefully planned retirement budget.
US Healthcare Costs in Retirement: The Real Numbers
The 2026 data on US healthcare costs in retirement is challenging. Fidelity Investments estimates that a 65-year-old retiring in 2026 will spend $185,500 on healthcare over their lifetime. The Milliman 2026 Retiree Health Cost Index projects that a healthy 65-year-old couple retiring this year will spend up to $637,000 on healthcare expenses over their remaining lifetimes, including Medicare Part B premiums, Medigap or Medicare Advantage plan premiums, and out-of-pocket costs.HealthView Services projects a long-term healthcare inflation rate of 5.8 percent for 2026 — significantly above general CPI inflation and significantly above the 2.8 percent Social Security COLA for 2026. This structural mismatch — healthcare costs rising at 5.8 percent while Social Security income adjusts at 2.8 percent — means that healthcare will consume an ever-growing share of retirement income over time.
The variation by coverage choice is significant:
- A 65-year-old man with Medigap (traditional Medicare + supplemental plan): projected lifetime healthcare cost $297,000 (Milliman, 2026)
- A 65-year-old woman with Medigap: projected lifetime healthcare cost $340,000 (Milliman, 2026)
- A 65-year-old man with Medicare Advantage plus Part D: projected $148,000 lifetime
- A 65-year-old woman with Medicare Advantage plus Part D: projected $172,000 lifetime
UK Readers: The NHS Changes the Calculation Significantly
For UK retirees, the healthcare cost picture is materially different. The National Health Service provides free-at-point-of-use primary care, specialist care, hospital treatment, and most prescription medications (free for everyone over 60 in England, and for those on relevant benefits across the UK). This eliminates the largest single variable in retirement cost planning that US retirees face.UK retirees do face healthcare-related costs: prescription charges for those under 60 in England, dental care (NHS dental services are less available than they once were), optical care, and the major financial exposure of social care and residential care in later life. Social care in the UK is means-tested and can consume significant assets for those who require residential care in their final years — with average residential care costs exceeding £40,000 to £80,000 per year depending on location and level of care required.
The UK government has announced but repeatedly delayed social care funding reform. As of August 2026, the means-testing rules continue to require individuals to fund their own care until assets fall below a specific threshold. For UK retirement planning, long-term care is the healthcare-equivalent wild card that deserves specific financial planning attention — even though routine healthcare costs do not represent the same magnitude of financial risk as in the US.
Putting It All Together: A More Accurate Retirement Budget
Based on the three reasons retirement is cheaper than commonly feared, and the important healthcare exception, a more accurate retirement budget framework looks like this:- Start with current spending — not current income. Most retirement calculators base replacement rates on income. But your actual retirement spending need is based on your actual current spending, not your income.
- Subtract work-related costs: calculate every cost that will disappear on retirement — commuting, work clothing, payroll taxes, professional costs. For many people, this reduces the required income by 15 to 25 percent immediately.
- Model three budget phases, not one: a go-go budget (generous, active), a slow-go budget (moderate, reduced travel and entertainment), and a no-go budget (routine costs dominant). Weight each by your expected years in each phase.
- Build a separate healthcare reserve: do not absorb healthcare costs into your general retirement budget. Create a dedicated healthcare fund — a Health Savings Account in the US, or a ring-fenced savings allocation in the UK — that is separate from your lifestyle spending budget.
- Adjust for location: if you plan to relocate at or near retirement, model your budget against the costs of the destination, not your current location. A 25 percent reduction in cost of living can reduce required retirement savings by hundreds of thousands of dollars or pounds.
What the Research Actually Suggests You Need
The implication of Reason 1, Reason 2, and Reason 3 taken together is that many people are planning for a retirement that is more expensive than the one they will actually have. The PlanAdviser July 2026 research finding that supports this is striking: analysing retirees of all income levels, the study found that underfunded and funded retirees did NOT increase spending over time. Spending increases were found only among the most well-funded retirees.This suggests that for the majority of retirees, the feared scenario of running out of money because spending exceeds projections does not materialise in the way that conservative retirement planning assumes. Retirees at all income levels naturally and relatively painlessly reduce their spending as they age. The financial risk in retirement is not primarily that people spend too much. It is that they live longer than planned, that healthcare costs exceed healthcare reserves, or that investment returns are sequentially bad in the early years of retirement.
The most evidence-consistent retirement planning approach, based on current research, is to plan for modestly lower spending than many rules of thumb suggest (60 to 70 percent of pre-retirement income rather than 80 percent for many households), model a declining spending trajectory across retirement phases, build a specific and generously sized healthcare reserve separately from lifestyle spending, and ensure the portfolio is positioned to generate reliable income across a retirement that may last 25 to 30 years.
Conclusion
The three reasons retirement is cheaper than most people fear are well-supported by current data: spending naturally declines by 30 percent or more between 60 and 85; work-related costs disappear on retirement’s first day, reducing required income by 15 to 25 percent; and location choice can reduce expenses by a further 20 to 30 percent. Combined, these three factors mean that the retirement income many people need is significantly lower than fearful projections suggest.The important exception is healthcare. In the United States, lifetime healthcare costs for a retiring couple are projected at up to $637,000, rising at 5.8 percent annually. In the United Kingdom, routine healthcare costs are largely removed by the NHS, but social care costs in later life can be substantial and unpredictable. No honest retirement plan should present the case for spending-decline without also presenting the case for healthcare reserve.
The practical takeaway: use the good news about retirement spending decline to recalibrate your retirement number downward from the most conservative projections, invest the money you save on work costs more aggressively in the final working years, consider your location as a financial decision alongside your investment decisions, and build a dedicated, separately funded healthcare reserve. Save for the retirement you will actually have — not the one that the most frightening version of retirement planning describes.
Frequently Asked Questions
Is the 80% income replacement rule accurate for retirement planning?For many households, the 80% rule overstates required retirement income. Wealthvieu’s May 2026 analysis of Bureau of Labor Statistics data found that many retirees spend only 60 to 70% of pre-retirement income, particularly once the mortgage is paid off and work-related costs are eliminated. The 80% rule may be appropriate for retirees with very low work-related costs or those expecting a highly active early retirement lifestyle, but for many middle-income households, 60 to 70% is a more accurate baseline.
How much does spending really decline in retirement?
According to J.P. Morgan Asset Management’s December 2025 report, average retiree spending declines by more than 30% between ages 60 and 85. Bureau of Labor Statistics Consumer Expenditure Survey data shows consumers aged 75 and older spend approximately $53,000 per year, compared to over $97,000 for the peak-spending 45–54 age group — a decline of approximately 45%. This decline is driven by reduced commuting, lower dining and entertainment spending, reduced travel as mobility decreases, and the disappearance of work-related costs.
What work-related costs disappear when I retire?
Significant work-related costs that disappear on or near retirement include: payroll taxes (Social Security and Medicare in the US; National Insurance contributions in the UK); commuting costs (fuel, transit passes, parking — averaging $4,000/year in the US); work clothing and grooming; work lunches and professional socialising; professional development fees and memberships; and life insurance or income protection policies tied to earned income. For many households, these total $15,000 to $25,000 per year — a structural reduction in required income that does not need to be replaced by retirement savings.
How can location affect my retirement costs?
Wealthvieu’s May 2026 analysis found that retiring in a lower-cost region can reduce expenses by 20 to 30% and dramatically lower required retirement savings. In the US, the cost of living differential between expensive coastal cities (San Francisco, New York, Seattle) and affordable mid-size cities (Knoxville, Boise, Asheville) is 40 to 60% for housing alone. In the UK, retiring outside London and the South East to lower-cost regions of England, Wales, or Scotland can produce similar savings. International retirement in countries like Portugal, Spain, or Mexico can reduce costs even further, subject to healthcare, visa, and tax planning.
How much should I budget for healthcare in retirement?
In the US, Fidelity estimates a 65-year-old retiring in 2026 will spend $185,500 on healthcare over their lifetime. The Milliman 2026 Retiree Health Cost Index projects a healthy 65-year-old couple will spend up to $637,000 over their remaining lifetimes. Healthcare inflation is projected at 5.8% annually (HealthView Services, 2026) — significantly above general inflation. A dedicated healthcare reserve, ideally funded through a Health Savings Account (HSA) during working years (triple tax-advantaged), is the recommended approach. In the UK, routine healthcare is covered by the NHS, but long-term care and residential care costs can exceed £40,000 to £80,000 per year and should be specifically planned for.
What are the go-go, slow-go, and no-go years of retirement?
These are three phases of retirement spending described by financial planners to reflect the natural evolution of retirement costs. The go-go years (roughly 65–74) are the most active and expensive — travel, leisure, dining, and new hobbies. The slow-go years (roughly 75–84) see spending decline as activity levels reduce and travel becomes less frequent. The no-go years (roughly 85+) see the lowest discretionary spending but potentially the highest healthcare costs. Planning a higher budget for the go-go years and lower budgets for subsequent phases produces a more accurate retirement financial plan than using a single constant spending figure.
Does retirement really cost less than people fear?
For most people, yes — with the important exception of healthcare. The combination of naturally declining spending over the retirement years, the elimination of work-related costs, and the flexibility to choose a lower-cost location means that retirement typically costs significantly less than peak-earning-year spending projections suggest. Research from J.P. Morgan, BLS, and Wealthvieu consistently supports this. The caveat is that healthcare costs are a genuine and growing exception — rising steeply in later retirement, outpacing general inflation, and representing a potentially large lifetime expenditure that requires specific, separate financial planning.
0 Comments
Be the first to share your thoughts on this article.