

Business
Accountant Explains What Is Comparable Company Analysis?

Table of Contents
- How Investment Banks Value Companies
- What Is Comparable Company Analysis?
- The Five-Step Comps Process: A Practitioner Walkthrough
- Step 1: Select the Peer Group (The Most Critical Step)
- Step 2: Gather and Normalise Financial Data
- Step 3: Calculate Valuation Multiples for Each Peer
- Step 4: Benchmark the Multiples and Identify the Representative Range
- Step 5: Apply the Multiple to the Target Company
- Key Valuation Multiples in Comps: 2026 Complete Reference
- Comps, DCF, and Precedent Transactions: The Valuation Trinity
- Comps Worked Example: Valuing a UK Software Business
- Limitations of Comparable Company Analysis: The Honest Assessment
- Conclusion
- Frequently Asked Questions (FAQ)
- External References
How Investment Banks Value Companies
When an investment bank advises a company on a merger, when an equity analyst sets a price target, when a private equity firm decides how much to bid for a business, or when a company prices its shares for an IPO — the first analytical tool they reach for is almost invariably comparable company analysis. Known universally in finance as 'comps' or 'trading comps', it is the most widely used valuation methodology in investment banking, equity research, and corporate finance. Ryan O'Connell CFA's 2026 practitioner guide confirms: 'Comparable companies analysis is the most widely used relative valuation methodology in investment banking. Whether you're advising on an M&A transaction, pricing an IPO, or preparing a fairness opinion, comps are typically the first valuation approach you'll run.'The core idea of comparable company analysis is elegantly simple: value a company by reference to what the market currently pays for similar businesses. If a group of publicly listed companies that resemble your target company in industry, size, and financial profile trade at an average of 10 times their EBITDA, and your target generates £100 million in EBITDA, a first estimate of your target's enterprise value is approximately £1 billion. This market-calibrated approach — what professionals call a relative valuation — stands in contrast to intrinsic valuation methods like discounted cash flow analysis, which value a company from its own projected cash flows independent of what the market currently charges for comparable businesses.
This guide explains everything about comparable company analysis: the logic and theory behind it, the five-step process for building a comps analysis, the key valuation multiples and what each measures, how to select a credible peer group (the most critical and most judgemental step in the entire analysis), the sector-specific multiples that dominate different industries in 2026, how comps relate to DCF analysis and precedent transaction analysis within the complete valuation framework, and the critical limitations that every analyst must understand. Whether you are a finance student, an investor trying to understand how professional analysts value companies, or a business owner assessing the value of your own enterprise, this guide provides the complete and practical picture.
What Is Comparable Company Analysis?
Comparable company analysis is a relative valuation method that estimates the value of a company by comparing it to a group of publicly traded companies with similar characteristics, and applying the valuation multiples observed in that peer group to the target company's own financial metrics. LearnSignal's 2026 ACCA valuation guide defines it concisely:'Comparable company analysis is a relative valuation method: instead of valuing a company from its own projected cash flows, it values it by reference to how the market prices similar businesses. The logic is that similar companies — in the same industry, of similar size and with similar growth and risk profiles — should trade at similar valuation multiples.'
A valuation multiple is a ratio that relates a company's market value to a financial metric — most commonly its earnings, revenue, or earnings before interest, taxes, depreciation, and amortisation (EBITDA). For example, the EV/EBITDA multiple divides a company's enterprise value by its EBITDA to express how many times the market is paying for each pound of operating profit. If 10 similar companies trade at an average EV/EBITDA of 8x, and the target generates £50 million in EBITDA, the implied enterprise value is approximately £400 million.
The elegance of this approach lies in its market calibration. Unlike a DCF, which derives value from assumptions about future cash flows that no one can know with certainty, a comps analysis is grounded in real transactions happening in real time in public markets. Every trading day, millions of investors are buying and selling shares of the comparable companies in the peer group, continuously updating the market's collective view of what those businesses are worth. Comps capture that collective intelligence and apply it to the target company.
Market dominance of comps in professional valuation: Relative valuation accounts for the majority of sell-side equity valuations — Damodaran (NYU Stern, Investment Valuation 3rd Ed.) — Professor Aswath Damodaran of NYU Stern — the world's foremost authority on corporate valuation — confirms that relative valuation via comps accounts for the majority of equity valuations done by sell-side analysts, because the time cost is lower and the result is directly comparable to current market prices. Goldman Sachs disclosed in its 2024 annual report that AI tools cut pitchbook prep time by 18% — making comps analysis faster still (CTA Acquisitions, 1 day ago)
The Five-Step Comps Process: A Practitioner Walkthrough
Every professional comparable company analysis follows the same five-step workflow, whether it is performed on a Bloomberg terminal by a Goldman Sachs analyst or in Excel by a finance student. ibinterviewquestions.com's March 2026 valuation guide describes trading comps as 'typically the first valuation methodology an analyst builds on any engagement because they are quick, market-grounded, and easy for clients to understand.'Step 1: Select the Peer Group (The Most Critical Step)
Peer group selection is the most important and most judgement-intensive step in the entire comps process. Ryan O'Connell CFA's practitioner guide states this without equivocation: 'Peer selection is the most important and most subjective step in the entire comps process. The implied valuation is only as good as the comparability of the peer group. If you select companies that are not truly similar to the target, the resulting multiples will not produce a meaningful valuation, no matter how carefully you calculate them.'The criteria for selecting comparable companies are consistently described across the professional literature using Street of Walls' CVS framework: Confirm relevant peer universe (same industry, similar business model), Validate key fundamental metrics (comparable size, growth rate, profitability, and risk profile), and Select appropriate multiple for valuation. In practice, the ideal comparable company operates in the same industry, has a similar business model, exhibits comparable financial characteristics (revenue scale, growth rate, EBITDA margin, and capital intensity), and faces a similar risk environment. A standard institutional comps table contains between 8 and 15 peer companies — too few produces an unreliable median; too many dilutes the comparability of the group.
Several common peer selection mistakes undermine otherwise well-executed analyses. ctacquisitions.com's 2026 relative valuation guide is specific: 'You can't use a public-company multiple from a Fortune 500 manufacturer to value a $5M EBITDA shop — the size mismatch is too large. You can't use a SaaS-company multiple to value a distribution business. You can't use 2021 data when valuing a 2026 deal — multiples have compressed significantly.' Ryan O'Connell's guide adds: 'Avoid selecting peers by name recognition alone. Including Apple or Amazon simply because they're well-known undermines your analysis if they don't share the target's business model.'
Step 2: Gather and Normalise Financial Data
Once the peer group is selected, the next step is sourcing and normalising the financial data needed to calculate multiples. The primary data sources are public company filings (annual reports, 10-K filings, FTSE disclosures), earnings press releases (often contain key metrics before the full filing is available), and data platforms including Bloomberg, CapIQ (S&P Capital IQ), FactSet, and Visible Alpha for consensus analyst estimates.Normalisation is the step that separates robust comps analysis from superficial work. Raw financial data from different companies often contains non-recurring items — restructuring charges, litigation settlements, one-time gains from asset sales, write-downs — that distort the underlying operating performance that the multiple should reflect. DataStudios' August 2025 guide on comparable company analysis methodology states the adjustments clearly: 'Removing one-time gains or losses from net income, adjusting EBITDA for restructuring charges or unusual litigation expenses, normalising revenue for acquisitions or divestitures during the period.' Only normalised, comparable metrics from the same time period produce meaningful multiples.
Step 3: Calculate Valuation Multiples for Each Peer
Once normalised financial data is assembled, the valuation multiples are calculated for each peer company. The most commonly used multiples — EV/EBITDA, P/E, EV/Revenue — are set out in the reference table below. The choice of which multiples to calculate and present depends on the industry, the financial profile of the companies, and the purpose of the analysis. EV/EBITDA is the dominant workhorse for most M&A and investment banking work; NTM P/E leads in public equity research; EV/Revenue is standard for high-growth or pre-profit companies.Step 4: Benchmark the Multiples and Identify the Representative Range
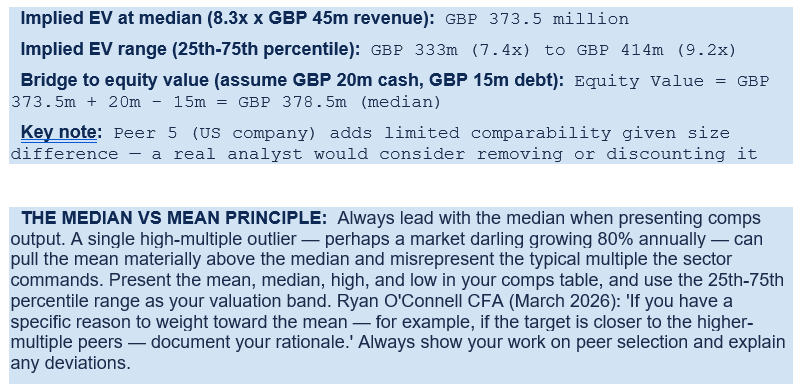
With multiples calculated for each peer, the next step is statistical benchmarking — determining the representative multiple that will be applied to the target. The median is generally preferred over the mean in professional comps analysis, because it is less sensitive to outliers. A single company with an unusually high or low multiple can significantly skew the mean, while the median remains stable. Ryan O'Connell's March 2026 guide is clear: 'Median is generally preferred because it's less sensitive to outliers. Present both statistics in your analysis, but use the median as the starting point.'Professional institutional comps tables present the full range of multiples alongside the mean, median, and typically the 25th to 75th percentile range. This percentile range — rather than a single median point estimate — is the correct representation of the comps output, because it conveys the genuine uncertainty and spread of market pricing across the peer group. Sell-side analysts and M&A advisors typically anchor on the median and the 25th-to-75th percentile to set a recommended valuation range.
Step 5: Apply the Multiple to the Target Company
The final step is applying the benchmark multiple from the peer group to the target company's corresponding financial metric. If the median EV/EBITDA of the peer group is 9.5x, and the target generates £80 million in EBITDA, the implied enterprise value is approximately £760 million. To convert enterprise value to equity value (what the shares are worth), add the target's cash and subtract its debt: if the target has £30 million of cash and £120 million of debt, equity value = £760m + £30m − £120m = £670 million. Divide by total diluted shares outstanding to produce an implied share price.Critically, the output of a comps analysis should always be a value range, not a single point estimate. Applying both the 25th percentile and 75th percentile multiples from the peer group produces a low and high end of the valuation range. This range, alongside the DCF range and the precedent transactions range, is typically presented in what bankers call a 'football field chart' — a visual summary of the valuation output across all three methods.
Key Valuation Multiples in Comps: 2026 Complete Reference
The choice of which multiple to use depends on the industry, the company's profitability profile, and the purpose of the analysis. The table below maps every major multiple used in comparable company analysis: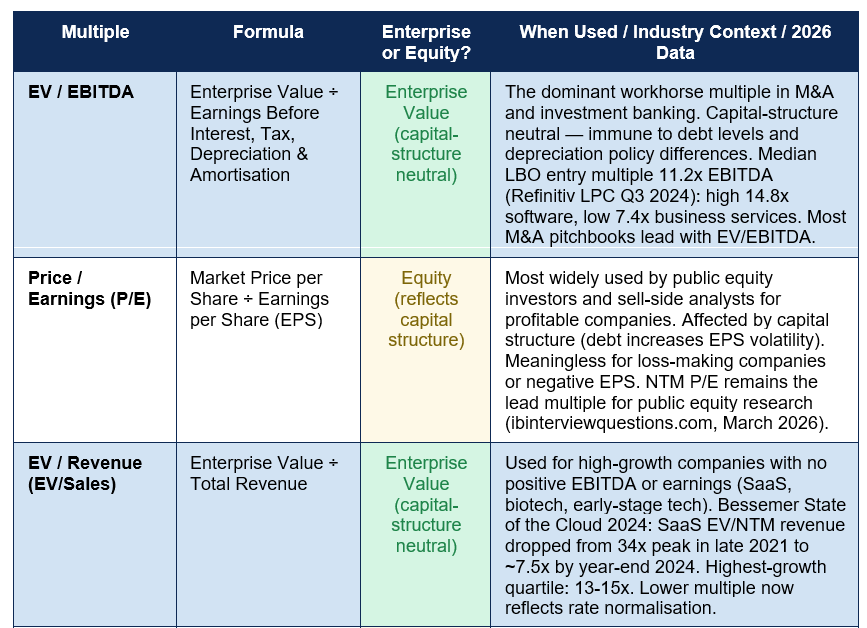
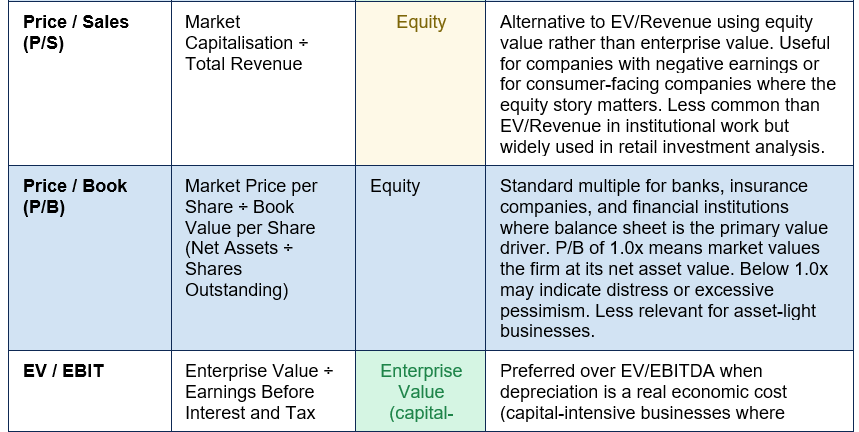

Sector-specific multiples in 2026: Not every sector uses EV/EBITDA. The sector-standard multiple is what buyers and investors in that specific space actually use, and using the wrong multiple signals a lack of sector knowledge. Key 2026 sector norms: Technology/SaaS — EV/NTM Revenue or EV/NTM EBITDA; Banking and financial institutions — Price/Book (P/B) and P/E; Retail — EV/EBITDA and same-store sales growth metrics; Mining and natural resources — EV/EBITDA and NAV (Net Asset Value); Healthcare and pharmaceuticals — EV/EBITDA, P/E, and EV/Sales for pre-revenue biotech; Real estate — P/NAV and Funds from Operations (FFO) yield; Insurance — P/B and combined ratio metrics. The correct approach is always to use the multiple that professionals in that specific sector actually use.
Comps, DCF, and Precedent Transactions: The Valuation Trinity
Comparable company analysis is almost never used in isolation in professional finance work. It is one of three core valuation approaches — the 'valuation trinity' — that investment bankers, equity analysts, and M&A advisors triangulate between to produce a comprehensive and defensible valuation. Understanding how the three methods relate to each other is as important as understanding any one of them individually: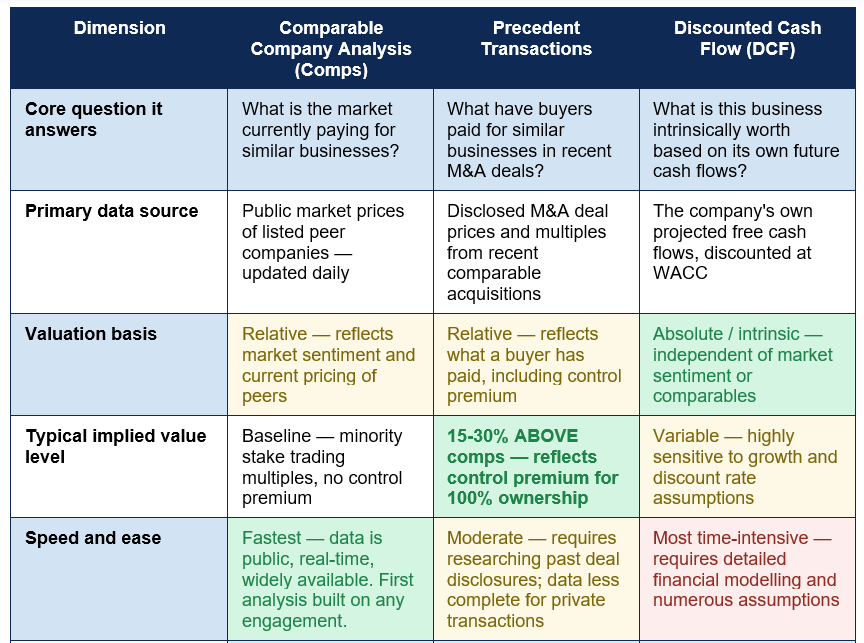
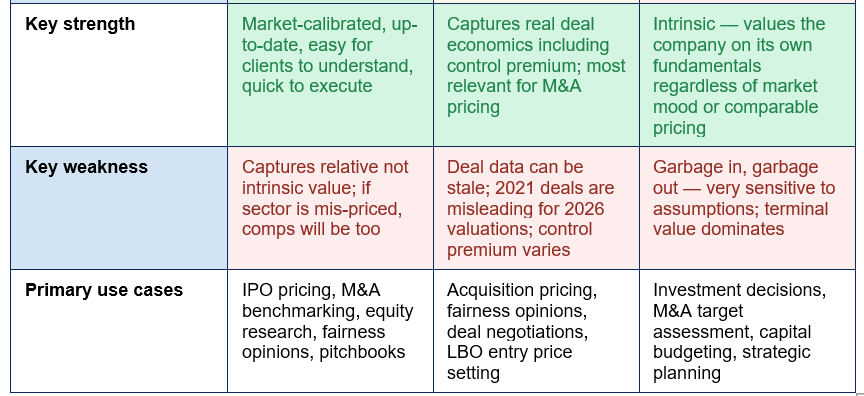
The relationship between comps and precedent transactions is particularly important to understand. CT Acquisitions' 2026 relative valuation guide explains the consistent pattern across decades of M&A data: 'Precedent transactions almost always trade at higher multiples than public comps. The difference is the control premium. A buyer of 100% of a company pays for the right to make decisions, set strategy, and capture all the synergies. A passive equity investor in a public-company share pays only for fractional economic exposure. The control premium typically runs 15-30%.' This means that if trading comps imply a value of £10 per share, a buyer seeking to acquire 100% of the company would typically need to pay £11.50 to £13.00 per share — the premium reflects the value of control.
Comps Worked Example: Valuing a UK Software Business
The following illustrates a simplified comparable company analysis for a hypothetical UK software company: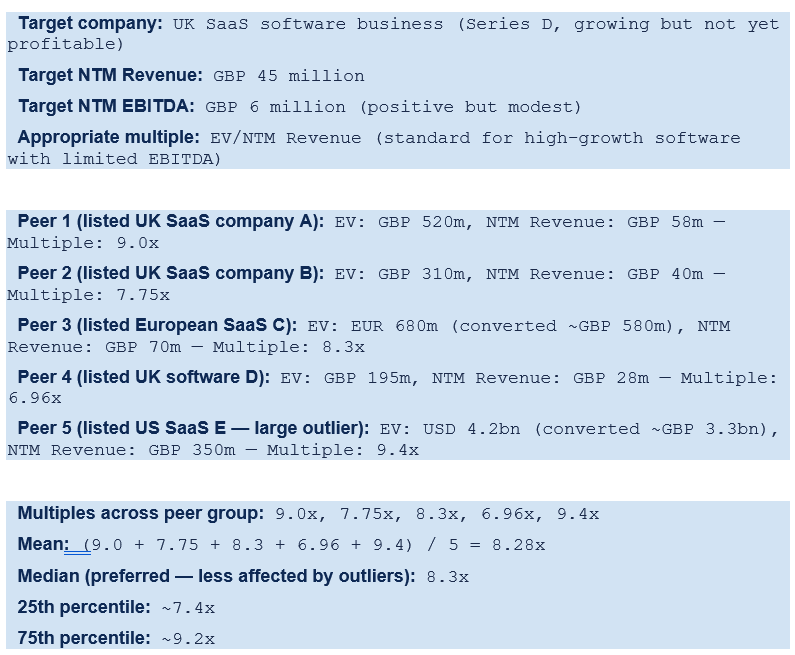
Limitations of Comparable Company Analysis: The Honest Assessment
Comparable company analysis is fast, intuitive, and market-calibrated — but it has significant limitations that every analyst must understand and communicate clearly when using and presenting comps-based valuations.- Relative, not intrinsic value: Comps capture what the market is paying for similar businesses at this moment, which may not reflect intrinsic value. If an entire sector is overvalued — as many technology sectors were in 2021 when SaaS EV/Revenue multiples reached 34x — comps will endorse overvaluation. If a sector is depressed by temporary sentiment — as many were in 2022-2023 during the rate hiking cycle — comps will endorse undervaluation. LearnSignal's 2026 guide states: 'Comps also reflect current market sentiment — if the whole sector is over- or under-valued, the comps will be too, so they capture relative rather than intrinsic value.'
- No two companies are truly identical: The entire framework assumes that comparable companies are actually comparable. In practice, no two businesses are identical in their growth prospects, competitive position, management quality, customer concentration, geographic exposure, or risk profile. These differences justify premium or discount adjustments to the mechanical median multiple — but those adjustments are judgement calls that can be used to justify almost any desired valuation if applied without discipline.
- Multiples are a snapshot in time: Markets move. A comps analysis performed in January will produce a different result from the same analysis performed in June if peer company share prices have changed materially. Comps must be updated regularly to remain relevant. CT Acquisitions' 2026 guide is specific: 'Precedent comps should be no older than 24 months for serious work, and the trend should be analysed (rising, flat, falling). A 2021 comp may be 2-3 turns above today's reality.'
- Private companies lack direct comparables: Comps rely on the multiples of publicly traded companies. Private companies — which are the majority of businesses — have no directly observable market multiples. When valuing a private business using comps, analysts use public company multiples with a private company discount (typically 10-30%) to reflect the liquidity premium that public markets command. This adds an additional layer of judgement and imprecision to an already judgement-heavy methodology.
- Not suitable for unique or early-stage businesses: Companies in genuinely novel industries, businesses undergoing major transformation, pre-revenue startups, and businesses with idiosyncratic characteristics may have no truly comparable public companies. Forcing a comps framework onto such businesses produces misleading valuations regardless of technical execution quality.
COMPS AND THE MARKET CYCLE: The single most important limitation of comparable company analysis in practice is its sensitivity to the market cycle. In bull markets, high peer multiples make every company look expensive but buyable. In bear markets, compressed peer multiples make every company look cheap. The 2021-to-2026 SaaS valuation cycle illustrates this starkly: EV/NTM Revenue multiples for software companies dropped from a peak of 34x in late 2021 to approximately 7.5x by year-end 2024 (Bessemer State of the Cloud 2024 report), while the underlying businesses often continued growing revenue at strong rates. A comps analysis in December 2021 would have suggested 34x as the right multiple; the same analysis in December 2024 suggested 7.5x. The companies had not changed that dramatically — the market had. Always triangulate comps with DCF and precedent transactions to distinguish market-cycle noise from genuine value.
Conclusion
Comparable company analysis is the most widely used valuation methodology in investment banking, equity research, and corporate finance — the first analysis built on virtually every deal, every IPO, every fairness opinion, and every pitchbook. Its appeal is well-founded: it is fast, transparent, market-calibrated, and intuitive. If 10 similar businesses trade at 9x EBITDA and your target generates £80 million of EBITDA, a first estimate of enterprise value is approximately £720 million — a number grounded in real market transactions rather than assumptions about an unknowable future.The five-step process — select the peer group, gather and normalise financial data, calculate multiples for each peer, benchmark the distribution to find the median and percentile range, then apply to the target — is the mechanical foundation of comps analysis. But the mechanical steps are the easy part. The difficult part is peer selection — identifying a genuinely comparable set of businesses whose industry, size, growth profile, profitability, and risk characteristics are close enough to the target that their multiples carry analytical meaning. A flawed peer group, as Ryan O'Connell CFA states in his March 2026 practitioner guide, 'produces a flawed valuation' regardless of how carefully the mechanics are executed.
Used alongside DCF analysis and precedent transaction analysis — the valuation trinity that every investment bank uses — comparable company analysis provides a market-grounded anchor for the valuation range. Comps calibrate to current market pricing; precedent transactions add the control premium that M&A buyers pay; DCF provides the intrinsic value independent of market mood. The three methods rarely produce identical answers, and the gaps between them are often the most analytically interesting and most important questions to address. The comps analysis alone is not the answer — it is the starting point for the conversation about what a business is truly worth.
Frequently Asked Questions (FAQ)
What is comparable company analysis in simple terms?
Comparable company analysis (comps) is a method of estimating what a company is worth by looking at what similar companies are currently worth in the stock market. The core logic is straightforward: if a group of similar businesses all trade at approximately 8 to 10 times their annual EBITDA, and the company you are valuing also generates £50 million in EBITDA, a reasonable estimate of its value is somewhere between £400 million and £500 million. Comps translate the market's current pricing of similar businesses into an estimated value for the target company, using standardised ratios called valuation multiples (such as EV/EBITDA, P/E, or EV/Revenue) that allow businesses of different sizes to be compared on the same scale.What is the most important step in comparable company analysis?
Selecting the peer group is the most critical step, and the most judgemental. The entire comps analysis rests on the peer companies being genuinely comparable to the target in industry, business model, size, growth rate, profitability, and risk profile. If the peer group is wrong — if it includes companies that are too large, too different in business model, or from a different point in the economic cycle — the resulting multiples will not produce a meaningful valuation, regardless of how carefully the subsequent calculations are executed. The CVS framework used by investment banking professionals summarises the peer selection discipline: Confirm the relevant peer universe (same industry, similar business model), Validate key fundamental metrics (comparable financial profile), Select the appropriate multiple for valuation (industry-standard, applicable to the target's financial characteristics).What is EV/EBITDA and why is it the most used multiple?
EV/EBITDA (Enterprise Value divided by Earnings Before Interest, Taxes, Depreciation, and Amortisation) is the most widely used multiple in M&A and investment banking because it is capital-structure neutral — it is not affected by whether a company is funded with debt or equity. This neutrality makes it possible to compare companies with very different debt levels on the same basis. It is also relatively immune to differences in depreciation policy between companies (since EBITDA adds back depreciation), making it more consistent across peer groups than earnings-based multiples. According to Refinitiv LPC data through Q3 2024, the median LBO entry multiple across all sectors was 11.2x EBITDA, with software businesses commanding 14.8x and business services at 7.4x — figures that serve as benchmarks for deal pricing and comps analysis in 2025 and 2026.What is the difference between comps and precedent transactions?
Both are relative valuation methods that use multiples, but they draw on different data. Comparable company analysis uses the current trading multiples of publicly listed peer companies — the prices at which passive investors buy minority stakes in public shares day by day. Precedent transaction analysis uses the multiples paid in actual past M&A deals for similar businesses — the prices that acquirers paid to buy 100% of comparable companies. The key difference is the control premium: when a buyer acquires 100% of a company, they pay a premium above the minority-stake trading price for the right to control the business, set strategy, and capture synergies. This premium typically runs 15% to 30%, meaning precedent transaction multiples are systematically higher than trading comps multiples. For a business being sold in an M&A process, precedent transactions are the more relevant benchmark; for a stock market investor buying minority shares, trading comps are more directly applicable.When should I use comps vs a DCF analysis?
The short answer is: both, whenever possible. Comps and DCF serve different purposes and have different strengths, making them most useful in combination. Use comps when you need a quick, market-calibrated, defensible valuation range that clients, boards, or investors can immediately relate to current market pricing — particularly for IPO pricing, fairness opinions, and M&A benchmarking. Use DCF when you want to assess intrinsic value independent of current market sentiment, evaluate whether comps-based pricing is too high or too low relative to fundamental cash generation, or model the impact of specific strategic assumptions on value. CT Acquisitions' 2026 guide recommends: 'For a private company sale, the comps and the DCF should agree within a 15 to 20 percent band. If they do not, one of the two analyses has a structural problem that needs fixing.' The most rigorous valuation work always triangulates between comps, DCF, and precedent transactions — using all three to define a valuation range and interrogating the gaps between them.External References
1. LearnSignal — Comparable Company Analysis (Comps) Explained 2026 (3 weeks ago — ACCA valuation guide)https://www.learnsignal.com/blog/comparable-company-analysis-comps-valuation-guide/
2. Ryan OConnell CFA — Comparable Companies Analysis: The 5-Step Comps Methodology (March 30, 2026)
https://ryanoconnellfinance.com/comparable-companies-analysis/
3. ibinterviewquestions.com — How Comparable Company Analysis Works: The End-to-End Process (March 18, 2026)
https://ibinterviewquestions.com/guides/valuation-investment-banking/how-comparable-company-analysis-works
4. CT Acquisitions — Comparable Company Analysis: 2026 Trading Comps Methodology Walk-Through (2 weeks ago)
https://ctacquisitions.com/comparable-company-analysis/
5. CT Acquisitions — Comparables in Finance: 2026 Definition, Use Cases, Trading vs Transaction Comps (1 day ago)
https://ctacquisitions.com/comparables-meaning/
6. DataStudios — Comparable Company Analysis: Approach, Adjustments and Interpretation (August 2025)
https://www.datastudios.org/post/comparable-company-analysis-approach-adjustments-and-interpretation
7. Street of Walls — Comparable Company Analysis: Investment Banking Technical Training (CVS framework)
https://www.streetofwalls.com/finance-training-courses/investment-banking-technical-training/comparable-company-analysis/
8. CT Acquisitions — Relative Valuation: Comparable Companies and Precedents 2026 (3 weeks ago — 15-30% control premium data)
https://ctacquisitions.com/relative-valuation-comparable-companies-business-2026/

0 Comments Comments