

Investing
AI Valuations Don't Add Up: What It Means for Your Portfolio

Enterprises don't refresh their tech stack every six weeks, but AI valuations assume they do, and that mismatch could cause trouble. Here is how investors can get ahead. Top 10 stocks about 39% to 41% of S&P 500; forward P/E 17.7 (5 Nov); CAPE about 41; AI adoption about 18% of US firms; hyperscaler 2026 capex about $700B.
% by Source: Motley Fool via Webull (other sources say up to 41%)
The argument behind the headline goes like this. The giant sums being spent on AI infrastructure, and the share prices of the companies selling it, make sense only if customers keep buying new hardware and software at a blistering pace. Real businesses do not work like that. Most enterprises buy, test, deploy and depreciate technology over years, not weeks.
That is a thesis, not a settled fact, and the data is mixed. On one side, the biggest hyperscalers are on track to spend roughly $700 billion on capital expenditure in 2026, while only about 18% of US firms were using AI at the start of the year. On the other, the S&P 500's forward price-to-earnings ratio fell to 17.7 on 5 November, its lowest in more than three years, because earnings estimates have surged.
So do AI valuations add up? Honestly, it depends which measure you trust and how patient you are. This post sets out both sides, explains the timing mismatch, and finishes with practical, general ways investors can think about risk. Key takeaway: Valuations can look reasonable on next year's earnings and stretched on almost everything else. The risk is less about whether AI is real and more about whether the spending, the adoption and the share prices are all moving on the same timetable.
I want to be careful here. Nobody publishes a figure saying "the market assumes a six-week refresh," and that wording is a shorthand. What can be shown is that spending is running far ahead of measured business returns, and that accounting assumptions differ from the pace of technology. The next sections walk through each piece. Think of it as a timing problem. The money for data centres goes out now. The revenue that justifies it arrives later, if it arrives. Markets are pricing the later part today.
Yet other measures look stretched. The S&P 500's trailing P/E, using actual results, is around 25, above the five-year average of 24.4 and the ten-year average of 23.7. The Shiller CAPE, which averages ten years of inflation-adjusted earnings, was reported at about 41.1, the highest since the dot-com peak [8]. The Next Web puts it at 38 to 40, second only to the dot-com high of 44.19. The two readings are not contradictory. A forward P/E rests on forecasts of strong earnings, while the CAPE looks backwards at history. If the forecasts come true, forward numbers will look fine in hindsight. If they disappoint, the denominator shrinks and the multiple jumps. That is the real bet, and it is why "doesn't add up" and "looks cheap" can both be argued in good faith. One more conflict: sources disagree on how rich tech is. Fortune says tech trades around 25 times forward earnings, against 58 times at the 2000 peak, while The Next Web says 30 times against 50. I cannot tell which definition is right, so I would treat the exact multiple with caution and take the broad message: lower than 2000, but not cheap.
There is a fair counterpoint. Fortune's data shows the top ten produce 34% of profits; their 41% market weight is higher than that, but not wildly so. That is a point in the bulls' favour. Still, it means a stumble by a few companies can move a diversified-looking index. For anyone who owns a plain S&P 500 fund, the practical effect is that your portfolio is more of an AI bet than the label suggests. That is not good or bad on its own, but it is worth knowing.
That money is large compared with the cash these businesses make. Tom Tunguz estimates that Amazon, Microsoft, Alphabet, Meta and Oracle will spend 90% of operating cash flow on AI data centres in 2026, up from a historical average of 40%. He also frames it as about $12 of AI infrastructure spend for every $1 of AI revenue. That is an analyst's estimate, and definitions vary.
Goldman Sachs, as reported by CryptoBriefing, calculates that at a 15% annual return on invested capital the six hyperscalers it tracks would need about $1.42 trillion of cumulative revenue across 2028 to 2030. The same piece says hyperscaler cloud revenues are currently about $70 billion above the pre-AI trend line. Put simply, the revenue is growing, but the bill is growing faster, and the payback is expected years away. That does not make it a bad bet. It does make timing the crucial variable.
But the financial payoff is less clear. McKinsey says the share of respondents reporting enterprise-level financial impact has not changed since last year, with 37% attributing at least some EBIT impact to AI, and the share of "high performers" flat at about 6%. About 20% say AI-related operating costs, including token costs, constrained their use.
The takeaway: adoption is real and growing, but it is gradual, uneven and so far only modestly visible in profit. That is exactly the pace you would expect from enterprises that do not refresh their technology every few weeks.
Why does this matter for valuations? If chips wear out economically faster than the books assume, reported profits today are flattered and future write-downs or heavier depreciation could hurt. If the longer lives are right, current earnings are fine. Nobody can prove which is correct yet, which is why it belongs on the list of things to watch.
Fortune's May piece lays out a 1999-style bull case too: S&P 500 EPS revision breadth hit a four-year high, median stock earnings growth was running at 16%, and tech's forward multiple was well below 2000's. The Next Web makes the point that today's AI leaders are massively profitable, unlike many dot-com era companies.
Even the strongest bears usually concede that AI is a real technology. The debate is about price and timing, not existence. A company like Nvidia at 13.3 times forward earnings does not look priced for perfection. My inference is that the market may already be doubting how long that growth lasts. I would keep both pictures in mind. The bull case is that earnings keep surprising upwards. The bear case is that spending and expectations run ahead of customers. Both can be partly right.
FactSet's data adds colour: Alphabet, Amazon and Meta reported negative EPS surprises for Q3 and saw an average price decline of 7.8% around the report. The market, in other words, punished spending that outran expectations, even from very large companies. The lesson is not that a crash is coming. It is that a market priced on forward growth reacts violently to any sign that the timetable is slipping.
Remember also that 2026 has been a strong year. Fortune noted the S&P 500 rose 79% from the end of 2022 and the Nasdaq 100 gained 130% by early 2026. Winners can quietly grow into oversized positions, so a portfolio that was balanced three years ago may not be today. None of this means selling. It means knowing what you own, and why, before the next surprise.
Fourth, match investments to time horizon. Money you need within a few years should not depend on the success of a single technology theme. Money for decades can tolerate more volatility, though it is still sensible to be diversified. Fifth, avoid trying to time the exact peak. History is full of bubbles that lasted longer than sceptics expected and then ended faster than believers hoped. A plan that works either way is better than a prediction. And if you are unsure, a licensed adviser who knows your circumstances can help more than any article.
The third is capex and cash flow. If hyperscaler spending keeps rising faster than operating cash flow, borrowing and issuance will matter more. The fourth is depreciation assumptions: any further changes to useful lives could signal how companies themselves view the pace of obsolescence. The fifth is earnings revisions. The whole forward-P/E story depends on estimates continuing to rise. If revisions turn down, valuations will look very different very quickly.
So the honest answer is: it is a bet on timing. If enterprises adopt faster than sceptics expect, or if the hyperscalers can fund their own spending, today's prices may look reasonable. If adoption keeps its slow, steady pace while spending stays high, there could be more shocks like 5 November. For investors, the useful move is not to guess which way it goes. Know your exposure, keep a sensible mix, match money to time horizon, and watch the handful of indicators that will tell you whether the gap between spending and adoption is closing.
Opinions differ. Bears point to concentration, with the top ten near 39% to 41% of the S&P 500, and a CAPE around 41. Bulls point to strong earnings and a forward P/E of 17.7.
What is the "mismatch" investors are worried about?
Spending and share prices assume fast, constant demand for new AI hardware and software, while enterprise adoption is gradual: about 18% of US firms used AI at the end of 2025, and only about 6% of McKinsey's respondents count as "high performers".
Why does GPU depreciation matter?
Hyperscalers depreciate chips over five to six years. If chips become obsolete sooner, profits may be overstated; if older chips stay useful, as Nvidia argues, the assumptions hold.
How concentrated is the S&P 500 in AI-linked stocks?
Estimates range from about 39% to over 41% of market cap in the ten largest companies, depending on the source and date.
What can ordinary investors do?
General ideas include checking concentration across funds, rebalancing, diversifying, matching money to time horizon and not trying to time a peak. This is not personal advice.
Table of Contents
- The mismatch in plain English
- What the valuation numbers actually say
- Concentration: how much rides on ten stocks
- The spending side of the equation
- The adoption side of the equation
- The depreciation puzzle
- The case that valuations are fine
- What the early-November selloff showed
- What it could mean for your portfolio
- Practical ways investors can get ahead
- Signals worth watching
- Conclusion
- FAQ
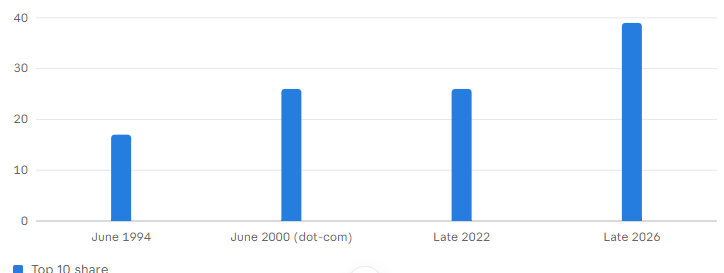
Top 10 stocks' share of the S&P 500 market cap (%)
% by Source: Motley Fool via Webull (other sources say up to 41%)
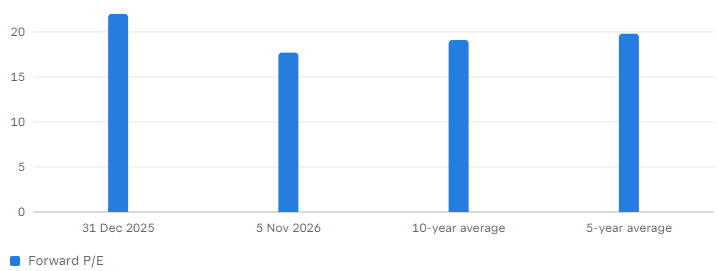
S&P 500 forward 12-month P/E ratio
P/E ratio by Source: FactSet
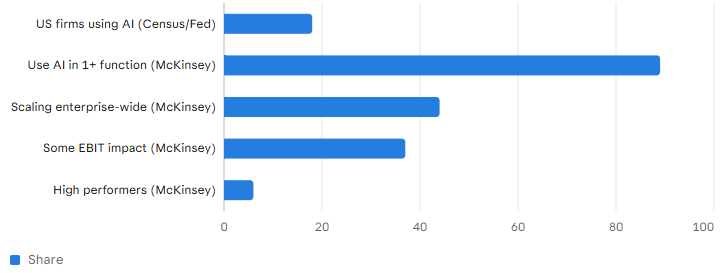
AI adoption vs financial impact (% of respondents or firms)
% by Source: Federal Reserve, McKinsey 2026; different samplesThe argument behind the headline goes like this. The giant sums being spent on AI infrastructure, and the share prices of the companies selling it, make sense only if customers keep buying new hardware and software at a blistering pace. Real businesses do not work like that. Most enterprises buy, test, deploy and depreciate technology over years, not weeks.
That is a thesis, not a settled fact, and the data is mixed. On one side, the biggest hyperscalers are on track to spend roughly $700 billion on capital expenditure in 2026, while only about 18% of US firms were using AI at the start of the year. On the other, the S&P 500's forward price-to-earnings ratio fell to 17.7 on 5 November, its lowest in more than three years, because earnings estimates have surged.
So do AI valuations add up? Honestly, it depends which measure you trust and how patient you are. This post sets out both sides, explains the timing mismatch, and finishes with practical, general ways investors can think about risk. Key takeaway: Valuations can look reasonable on next year's earnings and stretched on almost everything else. The risk is less about whether AI is real and more about whether the spending, the adoption and the share prices are all moving on the same timetable.
The mismatch in plain English
Start with the mismatch the headline describes. Nvidia is pushing an annual cadence of new GPU generations, which means that buying the latest chips can make last year's feel dated. Constellation Research writes that "5 years in AI infrastructure is a lifetime" and notes that the IRS treats servers as having a seven-year useful life. Now picture the customer. A typical enterprise, whether a bank, a retailer or a manufacturer, does not rebuild its systems every year. It runs pilots, checks security, trains staff, integrates with older software and spreads the cost over several years. If the revenue forecasts for chipmakers and cloud providers quietly assume constant, rapid refreshing, then actual demand could lag the forecasts.I want to be careful here. Nobody publishes a figure saying "the market assumes a six-week refresh," and that wording is a shorthand. What can be shown is that spending is running far ahead of measured business returns, and that accounting assumptions differ from the pace of technology. The next sections walk through each piece. Think of it as a timing problem. The money for data centres goes out now. The revenue that justifies it arrives later, if it arrives. Markets are pricing the later part today.
What the valuation numbers actually say
Valuation looks different depending on the yardstick. On forward earnings, the S&P 500 looks cheaper than it has in years. FactSet reported a forward 12-month P/E of 17.7 on 5 November, based on a close of 7,353.73 and forward EPS of $415.82. That is below the five-year average of 19.8 and the ten-year average of 19.1, and compares with 22.0 at the start of the year. Why the drop? Gotrade, summarising FactSet, says forward EPS estimates have climbed 33.6% since the start of the year while the index price rose 7.4%. In other words, earnings forecasts rose faster than prices. Even Nvidia, the AI poster child, traded at about 13.3 times forward earnings on 16 November, against 18.3 for the index, according to FourWeekMBA's own arithmetic.Yet other measures look stretched. The S&P 500's trailing P/E, using actual results, is around 25, above the five-year average of 24.4 and the ten-year average of 23.7. The Shiller CAPE, which averages ten years of inflation-adjusted earnings, was reported at about 41.1, the highest since the dot-com peak [8]. The Next Web puts it at 38 to 40, second only to the dot-com high of 44.19. The two readings are not contradictory. A forward P/E rests on forecasts of strong earnings, while the CAPE looks backwards at history. If the forecasts come true, forward numbers will look fine in hindsight. If they disappoint, the denominator shrinks and the multiple jumps. That is the real bet, and it is why "doesn't add up" and "looks cheap" can both be argued in good faith. One more conflict: sources disagree on how rich tech is. Fortune says tech trades around 25 times forward earnings, against 58 times at the 2000 peak, while The Next Web says 30 times against 50. I cannot tell which definition is right, so I would treat the exact multiple with caution and take the broad message: lower than 2000, but not cheap.
Concentration: how much rides on ten stocks
How much of the market depends on a few names? A lot. The Motley Fool says the S&P 500 is worth about $70.4 trillion and the top ten stocks account for $27.4 trillion, or around 39%. Fortune cites 41% of market cap and 34% of index profits for the top ten, and Barclays puts the figures at over 41% of market cap and roughly 32% of earnings. The dot-com comparison is striking. Between June 1994 and June 2000, the top ten's share rose from 17% to more than 26%. Since the current bull market began in late 2022 it has climbed from around 26% to 39%. Fortune notes that the median S&P 500 stock sat 13% below its 52-week high even as the index hit records.There is a fair counterpoint. Fortune's data shows the top ten produce 34% of profits; their 41% market weight is higher than that, but not wildly so. That is a point in the bulls' favour. Still, it means a stumble by a few companies can move a diversified-looking index. For anyone who owns a plain S&P 500 fund, the practical effect is that your portfolio is more of an AI bet than the label suggests. That is not good or bad on its own, but it is worth knowing.
The spending side of the equation
Now to the spending. The Motley Fool reports that Microsoft, Alphabet, Amazon and Meta spent a combined $208.7 billion on capital expenditure in the third quarter of 2026 alone. Om Malik's April summary of earnings calls says the four told investors they would spend roughly $700 billion in 2026, with combined capex roughly doubling in twelve months.That money is large compared with the cash these businesses make. Tom Tunguz estimates that Amazon, Microsoft, Alphabet, Meta and Oracle will spend 90% of operating cash flow on AI data centres in 2026, up from a historical average of 40%. He also frames it as about $12 of AI infrastructure spend for every $1 of AI revenue. That is an analyst's estimate, and definitions vary.
Goldman Sachs, as reported by CryptoBriefing, calculates that at a 15% annual return on invested capital the six hyperscalers it tracks would need about $1.42 trillion of cumulative revenue across 2028 to 2030. The same piece says hyperscaler cloud revenues are currently about $70 billion above the pre-AI trend line. Put simply, the revenue is growing, but the bill is growing faster, and the payback is expected years away. That does not make it a bad bet. It does make timing the crucial variable.
The adoption side of the equation
What about the customers? Official data suggests broad but shallow use. The Census Bureau's Business Trends and Outlook Survey found overall AI use hovering between 17% and 20% of US businesses from December 2025 to May 2026, with 20% to 23% expecting to use it within six months. A Federal Reserve note puts adoption at about 18% at the end of 2025. Note that the Census changed its question wording in November 2025, so comparisons with earlier years are not like-for-like. Larger firms are further along. McKinsey's 2026 survey finds nearly nine in ten respondents using AI in at least one function, and 44% say it is scaling across their enterprise. Forty percent of respondents from large organisations report scaling AI agents, up from 27% a year earlier.But the financial payoff is less clear. McKinsey says the share of respondents reporting enterprise-level financial impact has not changed since last year, with 37% attributing at least some EBIT impact to AI, and the share of "high performers" flat at about 6%. About 20% say AI-related operating costs, including token costs, constrained their use.
The takeaway: adoption is real and growing, but it is gradual, uneven and so far only modestly visible in profit. That is exactly the pace you would expect from enterprises that do not refresh their technology every few weeks.
The depreciation puzzle
Accounting adds another wrinkle. Hyperscalers spread the cost of chips and servers over several years. Alphabet and Microsoft assign six-year lives to similar assets, while Amazon reduced the estimate to five years for some servers and networking gear. Meta raised its estimate to 5.5 years in 2025, which added $1.00 to its earnings per share for the year, and lowered depreciation by $2.3 billion over the first nine months of 2025. Michael Burry has argued that this understates costs, saying that extending useful lives of compute equipment artificially boosts earnings when chips are on a two-to-three-year product cycle. That is one investor's view, stated in strong terms, and not an established fact. The other side says the lives are defensible. Nvidia has argued that its A100 fleet is "mission-capable from 2020 through 2029" because software keeps improving older chips, and Barchart notes older processors can be repurposed for less demanding inference work or resold.Why does this matter for valuations? If chips wear out economically faster than the books assume, reported profits today are flattered and future write-downs or heavier depreciation could hurt. If the longer lives are right, current earnings are fine. Nobody can prove which is correct yet, which is why it belongs on the list of things to watch.
The case that valuations are fine
It would be unfair to present only the bear case. Earnings are not imaginary: forward EPS estimates for the S&P 500 rose 33.6% between the start of the year and 5 November.Fortune's May piece lays out a 1999-style bull case too: S&P 500 EPS revision breadth hit a four-year high, median stock earnings growth was running at 16%, and tech's forward multiple was well below 2000's. The Next Web makes the point that today's AI leaders are massively profitable, unlike many dot-com era companies.
Even the strongest bears usually concede that AI is a real technology. The debate is about price and timing, not existence. A company like Nvidia at 13.3 times forward earnings does not look priced for perfection. My inference is that the market may already be doubting how long that growth lasts. I would keep both pictures in mind. The bull case is that earnings keep surprising upwards. The bear case is that spending and expectations run ahead of customers. Both can be partly right.
What the early-November selloff showed
The market tested these arguments in early November. The day after the midterm elections the Nasdaq rose, but on 5 November the Nasdaq Composite fell 5.52% and the Nasdaq 100 fell 6.36%. After the drop, the Nasdaq Composite was up just 4.6% for the year, the smallest gain among the major indexes. It also brought the forward P/E down: the 17.7 reading on 5 November came the same day. So prices fell at the same time as forecasts for earnings kept rising, which is just what you would expect if investors were worried about durability rather than next year's numbers.FactSet's data adds colour: Alphabet, Amazon and Meta reported negative EPS surprises for Q3 and saw an average price decline of 7.8% around the report. The market, in other words, punished spending that outran expectations, even from very large companies. The lesson is not that a crash is coming. It is that a market priced on forward growth reacts violently to any sign that the timetable is slipping.
What it could mean for your portfolio
I cannot give personal advice, but I can describe the exposures. If you hold an S&P 500 index fund, a large part of it is in the ten biggest companies, around 39% to 41% by market cap. If you also hold a Nasdaq 100 fund or a tech sector fund, you may be doubling up on the same names. If you hold AI-linked individual stocks, the questions are different. Does the company sell to hyperscalers, whose spending is the engine of demand, or to enterprises, whose adoption is slower? Does it make money from the build-out, or does it carry the cost? Companies that sell the shovels face a different timetable from companies that must earn the money back.Remember also that 2026 has been a strong year. Fortune noted the S&P 500 rose 79% from the end of 2022 and the Nasdaq 100 gained 130% by early 2026. Winners can quietly grow into oversized positions, so a portfolio that was balanced three years ago may not be today. None of this means selling. It means knowing what you own, and why, before the next surprise.
Practical ways investors can get ahead
Here are general ideas that investors often use, none of them specific to you. First, check your concentration. Look inside your funds and add up your exposure to the largest holdings. If one theme is a big share of your portfolio, decide whether that is deliberate. Second, consider rebalancing. After a long run, a periodic return to your target mix is a disciplined way to trim what has grown and top up what has lagged, without trying to call the top. Third, diversify across more than one kind of exposure, for example smaller companies, other regions, value stocks, bonds or cash, depending on your goals. Fortune noted that the median S&P 500 stock sat 13% below its 52-week high even as the index hit records, which suggests many stocks outside the leaders have not shared in the gains.Fourth, match investments to time horizon. Money you need within a few years should not depend on the success of a single technology theme. Money for decades can tolerate more volatility, though it is still sensible to be diversified. Fifth, avoid trying to time the exact peak. History is full of bubbles that lasted longer than sceptics expected and then ended faster than believers hoped. A plan that works either way is better than a prediction. And if you are unsure, a licensed adviser who knows your circumstances can help more than any article.
Signals worth watching
A few indicators may help you gauge whether the timing gap is closing or widening. The first is enterprise adoption data, such as the Census Bureau's survey, where 20% to 23% of firms expected to be using AI within six months. If actual use stalls below that, that matters. The second is profit impact. McKinsey's EBIT figures barely moved this year. A sustained increase in the share of firms reporting real financial gains would support the bull case.The third is capex and cash flow. If hyperscaler spending keeps rising faster than operating cash flow, borrowing and issuance will matter more. The fourth is depreciation assumptions: any further changes to useful lives could signal how companies themselves view the pace of obsolescence. The fifth is earnings revisions. The whole forward-P/E story depends on estimates continuing to rise. If revisions turn down, valuations will look very different very quickly.
Conclusion
AI valuations "don't add up" only if you assume the optimistic timetable cannot be met. Spending is running at around $700 billion a year, enterprise adoption is gradual, financial returns are still modest, and the market is concentrated in a handful of names. At the same time, forward earnings estimates are rising and the forward P/E is the lowest in three years.So the honest answer is: it is a bet on timing. If enterprises adopt faster than sceptics expect, or if the hyperscalers can fund their own spending, today's prices may look reasonable. If adoption keeps its slow, steady pace while spending stays high, there could be more shocks like 5 November. For investors, the useful move is not to guess which way it goes. Know your exposure, keep a sensible mix, match money to time horizon, and watch the handful of indicators that will tell you whether the gap between spending and adoption is closing.
FAQ
Are AI stocks in a bubble?Opinions differ. Bears point to concentration, with the top ten near 39% to 41% of the S&P 500, and a CAPE around 41. Bulls point to strong earnings and a forward P/E of 17.7.
What is the "mismatch" investors are worried about?
Spending and share prices assume fast, constant demand for new AI hardware and software, while enterprise adoption is gradual: about 18% of US firms used AI at the end of 2025, and only about 6% of McKinsey's respondents count as "high performers".
Why does GPU depreciation matter?
Hyperscalers depreciate chips over five to six years. If chips become obsolete sooner, profits may be overstated; if older chips stay useful, as Nvidia argues, the assumptions hold.
How concentrated is the S&P 500 in AI-linked stocks?
Estimates range from about 39% to over 41% of market cap in the ten largest companies, depending on the source and date.
What can ordinary investors do?
General ideas include checking concentration across funds, rebalancing, diversifying, matching money to time horizon and not trying to time a peak. This is not personal advice.
0 Comments
Be the first to share your thoughts on this article.