

Investing
Value The Best Energy ETFs to Buy: 5 Picks for Income & Inflation!

Energy ETFs can help investors earn income, hedge against inflation and speculate on commodity prices. Here are five worth a close look. Expense ratios 0.08% (XLE) to 1.01% (AMLP); yields 1.8% (XOP) to 8.2% (AMLP); Brent about $92 on 18 Nov vs $124 October average; XLE fell 12.0% in one week in November; EIA sees Brent at $86 in 2027.
% per year by Source: ETF Copilot, data as of 17 Nov 2026 (AMLP is 0.85% in an older source)
Energy ETFs sell three promises: income, protection when prices rise, and a way to bet on oil without buying a barrel. Those promises are real but uneven, and 2026 has shown just how uneven. The Energy Select Sector SPDR ETF (XLE) is up 45.28% for the year according to one data feed. Yet it fell 12.0% in a single week in November, almost exactly as far as oil did.
That swing is the story. Brent crude was about $91.84 a barrel on 18 November and on track for a fall of around 20% this month [3], after averaging $124 in October. If you are thinking of buying an energy fund now, you are buying into a market that has just lost a fifth of its oil price.
In this post I compare five funds: XLE, VDE, XOP, AMLP and EMLP. I cover what they cost, what they yield, what drives them and where they can hurt you. I also put the numbers in dollars so they mean something.
Key takeaway: There is no single best energy ETF. XLE and VDE are the low-cost core, XOP is the oil-sensitive lever, and AMLP and EMLP are the income and infrastructure plays. Energy is volatile, so keep it a modest slice of a diversified portfolio.
Oil prices are easing because Middle East exports are rising and shipping rates are plummeting. The EIA says Middle East crude shut-ins have fallen from a peak of 10.9 million barrels a day in May to about 2.5 million in October. One oddity: energy stocks did not join an oil bounce after the sell-off, and the yearly correlation between daily oil and S&P 500 moves is at -0.44 in 2026, lower than the previous low of -0.25 in 2003 on that chart. In plain English, this is an unusual market in which oil and stocks have often moved in opposite directions.
Speculation on commodity prices: here the funds are very different. One comparison says XOP equal-weights exploration and production companies and swings the most with oil prices. The Daily Digits found that XLE fell 12.0% in the week to 6 November against 12.1% for the US Oil Fund and just 2.7% for the S&P 500 fund. For a week, XLE behaved almost like crude itself.
GuruFocus lists a price-to-earnings ratio of 14.01, a dividend yield of 2.39% and a year-to-date return of 45.28%. Other sources give different return figures: 39.5% on an undated page and about 29% to 31% in mid-June. They are measured at different dates, so I would not compare them directly. Investors who want cheap, liquid exposure to the big integrated oil companies and are comfortable with two stocks dominating. It is a low-cost core, but not a diversified one.
There is a tax angle that surprises people. AMLP is structured so that the fund itself pays corporate tax, which drags on returns, while investors receive a regular tax form rather than a partnership one (general knowledge, check the fund's prospectus and your own tax situation). Income at 8.2% looks attractive: $820 a year on $10,000 (my calculation). But a yield that high reflects risk and a price that has already been marked down. It is not a promise, and it can be cut.
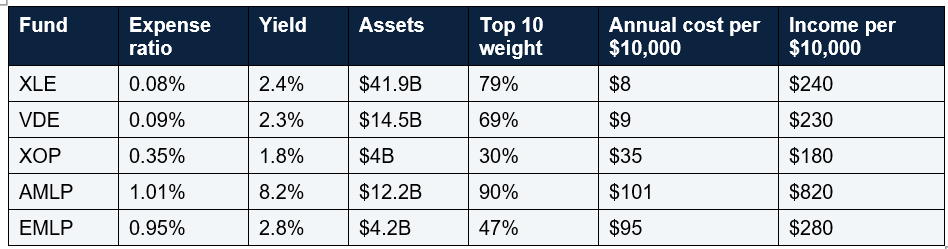
The pattern is clear. The cheapest funds pay modest yields, and the high-yield funds cost over ten times more in fees. Whether the extra income is worth the extra cost and tax complexity is a personal decision. Note that ETF Copilot does not say whether yields are trailing or forward, so treat them as approximate.
Two cautions. First, the EIA finished its inputs on 5 November [9], and Brent is already trading around $92, well below the "near $100" assumption. Forecasts lag markets. Second, forecasts swing wildly. In February the EIA expected Brent to average $58 in 2026 and $53 in 2027. By October it had raised those to about $105 in the fourth quarter of 2026 and $84 in 2027. If experts can be that far off, so can you.
The supply side matters too. The EIA expects US crude production to reach a record 13.9 million barrels a day in 2026 and 14.3 million in 2027, and global inventories to rebuild from the fourth quarter. More supply is bearish for oil prices, which is the main threat to the stocks inside these funds.
Concentration. XLE is about 42.5% Exxon and Chevron, and AMLP's top ten holdings are 90% of the fund. A problem at one company can hit the whole fund. Cost and tax drag. At about 1% a year, AMLP and EMLP need to earn more just to match the cheaper funds. Timing. The Daily Digits adds that after oil-led crash weeks, XLE was at least 5.5% higher a month later 40% of the time, against 26% in other weeks. That is one newsletter's analysis and not a reliable signal. It still means a fall does not guarantee a rebound, and also does not rule one out.
Buy in steps. Spreading purchases over several months means you do not have to guess whether oil has bottomed. Reinvest or spend? Yields look best when they are reinvested over many years, but only if the fund holds up. Decide in advance what you will do with the income. Review once or twice a year. Check cost, yield and whether the fund still matches the job you gave it.
Common mistakes: buying because a fund is up 45% this year; mistaking a high yield for safety; owning both XLE and VDE and thinking you are diversified; treating energy as a clean inflation hedge; ignoring fees; trusting an oil forecast as if it were a fact; and putting too much of your portfolio in one volatile sector. Another is reading old articles. Several "best energy ETF" lists I found are months old and quote different prices, yields and returns. For example, one older comparison puts AMLP's yield at 7.2%, another at 7.71%, and the latest data show 8.2%.
Some caveats. Most of the fund data come from one aggregator, ETF Copilot, dated 17 November. I did not retrieve fund providers' own fact sheets, so please check expense ratios, yields and holdings with State Street, Vanguard, Alerian and First Trust. Conflicts: AMLP's expense ratio is 1.01% in two sources and 0.85% in an older one; XLE's year-to-date return is 45.28%, 39.5% on an undated page and 29% to 31% in June; and the EIA's near-$100 Brent view is already above where oil trades. I use the latest dated figure in each case. I also did not retrieve a full holdings list for VDE, XOP or EMLP, tax details for the MLP fund, or independent performance data over five or ten years. The statement about AMLP's tax treatment is general knowledge.
It depends on your goal. XLE and VDE are the lowest-cost broad funds at 0.08% and 0.09%, AMLP has the highest yield at 8.2%, and XOP is the most oil-sensitive.
Are energy ETFs a good hedge against inflation?
Only partly. Energy stocks can rise with oil, but in 2026 XLE has also fallen when oil was above $100 [19] and fell 12.0% in a week when oil dropped.
What is the difference between XLE and VDE?
Both are low-cost and similar in their biggest holdings. XLE holds 21 large companies; VDE is broader, with more than 100 holdings per an older report.
Should I buy energy ETFs after oil falls?
Nobody can say whether oil has bottomed. The EIA expects Brent to fall further in 2027 [8], though its forecasts have swung widely this year. Consider buying in steps and keeping the position small.
Why does AMLP yield so much more?
It holds midstream pipeline partnerships and yields 8.2%, but charges about 1% a year and has a different tax structure (general knowledge). A high yield is not a guarantee.
Table of Contents
- Why energy ETFs are back in focus
- What energy ETFs can and cannot do
- How I picked five
- XLE: the large-cap core
- VDE: the broader, cheap alternative
- XOP: the oil price lever
- AMLP: the income engine
- EMLP: pipelines and infrastructure
- Side-by-side comparison
- What the oil forecasts say
- The risks you must price in
- How to build a position
- Conclusion
- FAQ
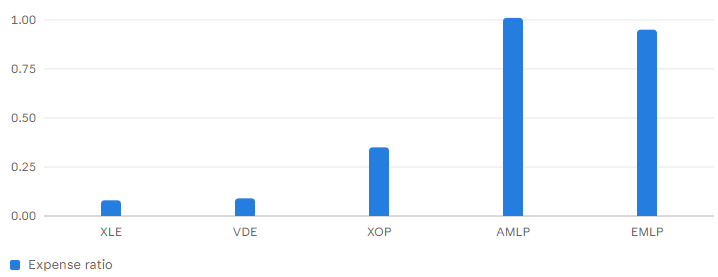
Expense ratio by energy ETF (%)
% per year by Source: ETF Copilot, data as of 17 Nov 2026 (AMLP is 0.85% in an older source)
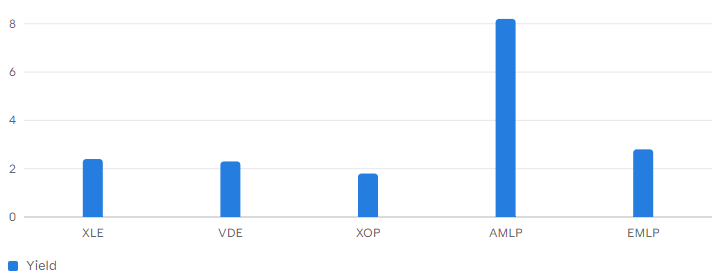
Dividend yield by energy ETF (%)
% yield by Source: ETF Copilot, 17 Nov 2026 (trailing or forward not stated)
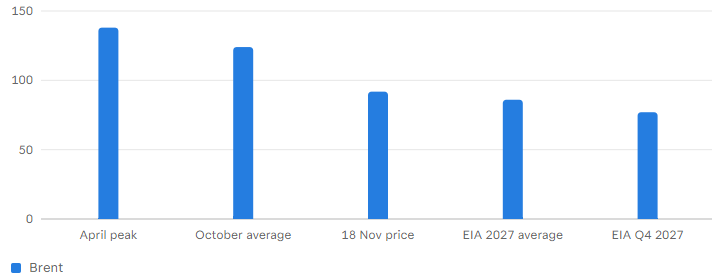
Brent crude path in 2026 and EIA outlook ($ per barrel)
$ per barrel by Sources: 24/7 Wall St, EIA via OGJ, Rallies.aiEnergy ETFs sell three promises: income, protection when prices rise, and a way to bet on oil without buying a barrel. Those promises are real but uneven, and 2026 has shown just how uneven. The Energy Select Sector SPDR ETF (XLE) is up 45.28% for the year according to one data feed. Yet it fell 12.0% in a single week in November, almost exactly as far as oil did.
That swing is the story. Brent crude was about $91.84 a barrel on 18 November and on track for a fall of around 20% this month [3], after averaging $124 in October. If you are thinking of buying an energy fund now, you are buying into a market that has just lost a fifth of its oil price.
In this post I compare five funds: XLE, VDE, XOP, AMLP and EMLP. I cover what they cost, what they yield, what drives them and where they can hurt you. I also put the numbers in dollars so they mean something.
Key takeaway: There is no single best energy ETF. XLE and VDE are the low-cost core, XOP is the oil-sensitive lever, and AMLP and EMLP are the income and infrastructure plays. Energy is volatile, so keep it a modest slice of a diversified portfolio.
Why energy ETFs are back in focus
Energy has been the market's wild card this year. One report says the closure of the Strait of Hormuz drove Brent to $138 a barrel in April . The US Energy Information Administration (EIA) says Brent averaged $124 in October and fell below $100 on 4 November. The drop was fast. WTI futures fell 15% from a 30 October settle above $104 to near $88 on 4 November, the worst three-day drop since 2021. The energy sector fell 4.74% in the 4 November session, the weakest sector that day, and XLE dropped 7.1% over the week to $63.59.Oil prices are easing because Middle East exports are rising and shipping rates are plummeting. The EIA says Middle East crude shut-ins have fallen from a peak of 10.9 million barrels a day in May to about 2.5 million in October. One oddity: energy stocks did not join an oil bounce after the sell-off, and the yearly correlation between daily oil and S&P 500 moves is at -0.44 in 2026, lower than the previous low of -0.25 in 2003 on that chart. In plain English, this is an unusual market in which oil and stocks have often moved in opposite directions.
What energy ETFs can and cannot do
Let me take the three promises one by one. Income: the five funds I cover yield between 1.8% and 8.2%. That range is wide, so the fund you pick matters a lot. Yields are not guaranteed and can change. Inflation hedge: this one is shakier than the marketing suggests. Energy prices feed into inflation, so energy stocks can help when prices rise (general reasoning). But the 2026 evidence is mixed. In late September, XLE was the worst-performing sector ETF on a day when Brent stayed above $100, with Treasury yields above 5% weighing on markets. A hedge that falls when oil falls, and sometimes when oil rises, is not a clean hedge.Speculation on commodity prices: here the funds are very different. One comparison says XOP equal-weights exploration and production companies and swings the most with oil prices. The Daily Digits found that XLE fell 12.0% in the week to 6 November against 12.1% for the US Oil Fund and just 2.7% for the S&P 500 fund. For a week, XLE behaved almost like crude itself.
How I picked five
I picked the five funds from a list of energy ETFs that ETF Copilot published with data as of 17 November 2026. The page says its list is selected by size and is not investment advice. I then looked at each fund's cost, yield, concentration and what drives its returns. This is not a "buy" list. I chose a spread of strategies: two broad low-cost funds (XLE and VDE), one oil-sensitive producer fund (XOP), and two income-focused pipeline funds (AMLP and EMLP). Several of the fund details come from a single aggregator, which I flag in the source notes.XLE: the large-cap core
XLE is the heavyweight. It has $41.9 billion in assets, a 0.08% expense ratio and a 2.4% yield, with the top ten holdings making up 79% of the fund. It holds 21 positions. Concentration is the key fact. Exxon Mobil is 23.97% of the fund and Chevron 18.49%, followed by ConocoPhillips at 7.28% and Marathon Petroleum at 4.69%. By my calculation, Exxon and Chevron together are about 42.5% of the fund. When you buy XLE, you are mostly buying those two.GuruFocus lists a price-to-earnings ratio of 14.01, a dividend yield of 2.39% and a year-to-date return of 45.28%. Other sources give different return figures: 39.5% on an undated page and about 29% to 31% in mid-June. They are measured at different dates, so I would not compare them directly. Investors who want cheap, liquid exposure to the big integrated oil companies and are comfortable with two stocks dominating. It is a low-cost core, but not a diversified one.
VDE: the broader, cheap alternative
VDE is XLE's broader cousin. It has $14.5 billion in assets, a 0.09% expense ratio and a 2.3% yield, and its top ten holdings are 69% of the fund. An older U.S. News piece says VDE holds a broader portfolio of 111 companies, with market-cap weighting that keeps the largest holdings similar to XLE's but at lower weights. The cost difference is small. By my calculation, 0.09% versus 0.08% is $9 versus $8 a year on $10,000. The real difference is breadth: VDE reaches more mid-sized and smaller energy companies, so less of your money rides on two stocks. Because XLE and VDE overlap heavily, owning both mostly doubles up on the same exposure. For most people one of them is enough.XOP: the oil price lever
XOP is the aggressive one. It tracks exploration and production companies, and an older comparison says it equal-weights them and swings the most with oil prices. Its expense ratio is 0.35%, its yield 1.8%, its assets $4 billion, and its top ten holdings are only 30% of the fund. The low concentration is a benefit: no single company dominates. The trade-off is cost and sensitivity. On $10,000, a 0.35% fee is $35 a year (my calculation), over four times XLE's, and the yield is the lowest of the five. This is the fund for someone who wants a stronger link to the oil price and accepts bigger swings. After a month in which oil fell about 20%, that is worth thinking hard about.AMLP: the income engine
AMLP is the income engine. It yields 8.2%, the highest of the five, with $12.2 billion in assets and a top-ten weight of 90%. It invests in midstream master limited partnerships, which own pipelines and storage. One guide calls it "the income engine of the energy sector". The cost is high. ETF Copilot lists a 1.01% expense ratio, and so does InvestSnips, though an older comparison lists 0.85% . That is one of the conflicts I flag later. On $10,000, 1.01% is $101 a year (my calculation).There is a tax angle that surprises people. AMLP is structured so that the fund itself pays corporate tax, which drags on returns, while investors receive a regular tax form rather than a partnership one (general knowledge, check the fund's prospectus and your own tax situation). Income at 8.2% looks attractive: $820 a year on $10,000 (my calculation). But a yield that high reflects risk and a price that has already been marked down. It is not a promise, and it can be cut.
EMLP: pipelines and infrastructure
EMLP, the First Trust North American Energy Infrastructure Fund, sits between the other funds. It has a 0.95% expense ratio, a 2.8% yield, $4.2 billion in assets and a top-ten weight of 47%. Infrastructure funds tend to focus on companies that move and store energy rather than produce it, so they may be less tied to day-to-day oil prices (general reasoning). I did not retrieve a full holdings breakdown for EMLP, so check the fund's fact sheet for what it actually holds. Like AMLP, it charges close to 1% a year, so $95 on $10,000 (my calculation). That is a high price compared with XLE or VDE and it needs to earn its keep.Side-by-side comparison
Here are the five funds side by side. The first four data columns are from ETF Copilot as of 17 November 2026. The last two are my calculations per $10,000 invested.The pattern is clear. The cheapest funds pay modest yields, and the high-yield funds cost over ten times more in fees. Whether the extra income is worth the extra cost and tax complexity is a personal decision. Note that ETF Copilot does not say whether yields are trailing or forward, so treat them as approximate.
What the oil forecasts say
Oil is the driver, so look at the forecasts, and be cautious with them. The EIA's November outlook expects Brent near $100 for the rest of 2026, averaging $97 for the year, then $86 in 2027 and $77 in the fourth quarter of 2027. It sees Henry Hub natural gas at $2.87 per million BTU from November to March and $2.88 in 2027.Two cautions. First, the EIA finished its inputs on 5 November [9], and Brent is already trading around $92, well below the "near $100" assumption. Forecasts lag markets. Second, forecasts swing wildly. In February the EIA expected Brent to average $58 in 2026 and $53 in 2027. By October it had raised those to about $105 in the fourth quarter of 2026 and $84 in 2027. If experts can be that far off, so can you.
The supply side matters too. The EIA expects US crude production to reach a record 13.9 million barrels a day in 2026 and 14.3 million in 2027, and global inventories to rebuild from the fourth quarter. More supply is bearish for oil prices, which is the main threat to the stocks inside these funds.
The risks you must price in
Oil price risk. The Daily Digits notes that energy stocks "priced a barrel, not a business" in November, falling about as far as oil. By my calculation, a 12% drop turns $10,000 into $8,800, while a 2.4% yield replaces only $240 a year. Geopolitical swings both ways. After a US-Iran ceasefire announcement sent oil sharply lower, XLE saw $1.0 billion of outflows in one session, the largest daily outflow in 14 years, according to Tickeron. News can move this sector in hours.Concentration. XLE is about 42.5% Exxon and Chevron, and AMLP's top ten holdings are 90% of the fund. A problem at one company can hit the whole fund. Cost and tax drag. At about 1% a year, AMLP and EMLP need to earn more just to match the cheaper funds. Timing. The Daily Digits adds that after oil-led crash weeks, XLE was at least 5.5% higher a month later 40% of the time, against 26% in other weeks. That is one newsletter's analysis and not a reliable signal. It still means a fall does not guarantee a rebound, and also does not rule one out.
How to build a position
General education, not advice. Here is a sensible way to think about it. Decide the job. If you want broad energy exposure, one of XLE or VDE is enough because they overlap. If you want income, look at AMLP or EMLP and understand the fees and tax. If you want an oil bet, XOP is the closest of these five. Size it small. As an example, with a $10,000 portfolio, a 5% position is $500. If that falls 30%, you lose $150, which is 1.5% of the portfolio (my calculation). A 30% position falling the same amount costs $900.Buy in steps. Spreading purchases over several months means you do not have to guess whether oil has bottomed. Reinvest or spend? Yields look best when they are reinvested over many years, but only if the fund holds up. Decide in advance what you will do with the income. Review once or twice a year. Check cost, yield and whether the fund still matches the job you gave it.
Common mistakes: buying because a fund is up 45% this year; mistaking a high yield for safety; owning both XLE and VDE and thinking you are diversified; treating energy as a clean inflation hedge; ignoring fees; trusting an oil forecast as if it were a fact; and putting too much of your portfolio in one volatile sector. Another is reading old articles. Several "best energy ETF" lists I found are months old and quote different prices, yields and returns. For example, one older comparison puts AMLP's yield at 7.2%, another at 7.71%, and the latest data show 8.2%.
Some caveats. Most of the fund data come from one aggregator, ETF Copilot, dated 17 November. I did not retrieve fund providers' own fact sheets, so please check expense ratios, yields and holdings with State Street, Vanguard, Alerian and First Trust. Conflicts: AMLP's expense ratio is 1.01% in two sources and 0.85% in an older one; XLE's year-to-date return is 45.28%, 39.5% on an undated page and 29% to 31% in June; and the EIA's near-$100 Brent view is already above where oil trades. I use the latest dated figure in each case. I also did not retrieve a full holdings list for VDE, XOP or EMLP, tax details for the MLP fund, or independent performance data over five or ten years. The statement about AMLP's tax treatment is general knowledge.
Conclusion
Energy ETFs can do useful jobs, but each does a different one. XLE and VDE are the cheap core, with XLE heavily tied to Exxon and Chevron. XOP gives the strongest link to oil. AMLP pays the highest income at 8.2% but costs about 1% a year. EMLP sits in between. The backdrop is a market that has just lost about a fifth of its oil price, with forecasts that point lower in 2027. That may create opportunity, or it may be the start of a longer fall. Nobody knows. Choose the job, keep the position modest, check the fees, and remember that this post is education only, not advice.FAQ
What is the best energy ETF to buy?It depends on your goal. XLE and VDE are the lowest-cost broad funds at 0.08% and 0.09%, AMLP has the highest yield at 8.2%, and XOP is the most oil-sensitive.
Are energy ETFs a good hedge against inflation?
Only partly. Energy stocks can rise with oil, but in 2026 XLE has also fallen when oil was above $100 [19] and fell 12.0% in a week when oil dropped.
What is the difference between XLE and VDE?
Both are low-cost and similar in their biggest holdings. XLE holds 21 large companies; VDE is broader, with more than 100 holdings per an older report.
Should I buy energy ETFs after oil falls?
Nobody can say whether oil has bottomed. The EIA expects Brent to fall further in 2027 [8], though its forecasts have swung widely this year. Consider buying in steps and keeping the position small.
Why does AMLP yield so much more?
It holds midstream pipeline partnerships and yields 8.2%, but charges about 1% a year and has a different tax structure (general knowledge). A high yield is not a guarantee.
0 Comments
Be the first to share your thoughts on this article.