
Investing
5 Reasons You Shouldn't Try to Time the Market: See the Data

What the long-run numbers say about trying to sidestep the next drop. $10,000 in the S&P 500 for 20 years to 2024: $71,750, or $32,871 missing the 10 best days; 7 of the 10 best days came within 15 days of a worst day; average equity investor 9.24% a year vs 10.35% for the S&P 500 over 20 years.
2. What "timing the market" really means
3. Reason 1: You have to be right twice
4. Reason 2: A few days drive much of the return
5. Reason 3: The best days hide inside the worst
6. Reason 4: Real investors tend to lag
7. Reason 5: Costs, taxes and constant stress
8. The honest caveats
9. This month's whipsaw
10. What to do instead
11. A simple plan
12. When changing course is not market timing
13. Bull case versus bear case
14. What to watch next
15. Conclusion
16. FAQ
This post gives five reasons not to try timing the market: you have to be right twice, a few days drive much of the return, the best days sit next to the worst, real investors tend to lag the funds they own, and the costs and stress add up. I also cover the honest caveats, because this subject is full of over-simplified charts. It is education, not advice, and it is based mostly on US data.
Key takeaway: You do not need to be wrong often for timing to hurt. Missing a handful of strong days, which tend to arrive in the middle of panics, can halve your long-term result.
The central question is whether you can predict the market well enough to beat simply staying invested. The evidence below suggests that, for most people, the answer is no.
Think about how hard each call is. To sell at a good moment you need to know that a fall is coming. To buy back at a good moment you need to know that the recovery has started, and the recovery usually begins when the news still looks bad. By the time the picture feels safe, prices have often already jumped. There is no shortcut here. Even if your first call is right, one wrong second call can wipe out the gain. That is the heart of the problem, and it explains why the next reasons matter so much.
A newer calculation from a Motley Fool author used a different 20-year window, 12 October 2006 to 12 October 2026, using the SPDR S&P 500 ETF with dividends reinvested. $10,000 grew to about $82,300, but only to about $35,700 without the 10 best days. Missing the best 20 left about $21,500, and missing the best 40 left about $9,900.
Notice the sources do not agree to the dollar. That is normal: the results depend on the start date, the index and whether dividends are included. What matters is that every version shows the same shape. The cost of missing even 10 days out of roughly 5,000 is enormous. For scale, a quick comparison: $38,879 less on the J.P. Morgan figures, or about 54% lower (my calculation). Ten days out of about 5,000 is 0.2% of the time.
A further study by Hartford Funds, reported by a secondary source, found that about 42% of the market's strongest days in a 20-year window happened during official bear markets, and another 36% in the first two months of a new bull market, before it was clear the bear market had ended [6]. By my calculation that leaves only about 22% of the best days outside those two situations. This is why selling after a sharp fall is so risky. The time you most want to be out is also when the strongest rebound days tend to appear. One source notes that sources differ here too: a more recent write-up says six of the 10, not seven. That one is a lower-quality aggregator, so I would lean on the J.P. Morgan figure.
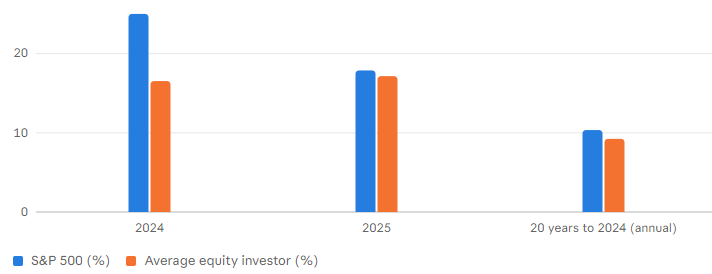
Now to the evidence on real investors. DALBAR's annual study compares what the average fund investor earns with what the market returned. Over the 20 years to the end of 2024, the average equity investor earned 9.24% a year, against 10.35% for the S&P 500, a gap of more than a percentage point every year. Compounding makes that gap bigger than it sounds. Using those two rates on $10,000 over 20 years gives roughly $71,700 for the index and $58,600 for the average investor, about $13,100 or 18% less (my calculation).
In 2024 the gap was 8.48 percentage points: the average equity investor earned 16.54% against 25.02% for the S&P 500, the second-largest gap in a decade. In 2025 it narrowed sharply to 0.72 points, with the S&P 500 at 17.88% and the average equity investor at 17.16%.
That is worth saying plainly: the gap is not fixed. DALBAR itself describes it as a fund-flow-based measure, and one commentator notes that it does not prove every individual investor lost exactly that amount [8]. Another measure, Morningstar's, found fund investors earned about 7.0% a year versus 8.2% for the funds over the ten years to 2024, a gap of 1.2 points.
Longer-run figures differ by source, which is a warning in itself: one tracker quotes 7.1% a year for the average equity-fund investor versus 10.7% for the S&P 500 over the 30 years to 2021, while other write-ups I saw give noticeably lower investor figures. I would not rely on any single 30-year number. What is consistent is the direction: the average investor lags, and behaviour is the usual explanation.
Fourth, DALBAR's 2025 result shows investors can do better than the headlines suggest. A gap of 0.72 points was the third smallest since 1985 and the smallest since 2012.
The bear case: past patterns may not repeat, a long bear market can last years, and some people really do sleep better with a larger cash holding. A plan that you will actually stick to is better than a perfect plan you will abandon. Both points hold at once. The argument is not that markets never fall. It is that predicting when is far harder than it looks.
If you invest, a few things are worth watching: your own savings rate and contributions, which matter more than any single year; your mix compared with your target; and the next DALBAR update, which will show whether last year's narrow gap was a one-off. For the UK, remember the 5 April tax-year end if you plan to use ISA or CGT allowances.
That does not mean you should never change your portfolio. It means you should make changes for reasons about your life, not about guessing tomorrow's headline. Build a plan you can hold, invest regularly and let time do the heavy lifting. This post is education only, not advice.
Staying invested for a long period has usually done better than trying to jump in and out based on predictions. The data above shows how costly missing a few strong days can be.
What happens if you miss the best days?
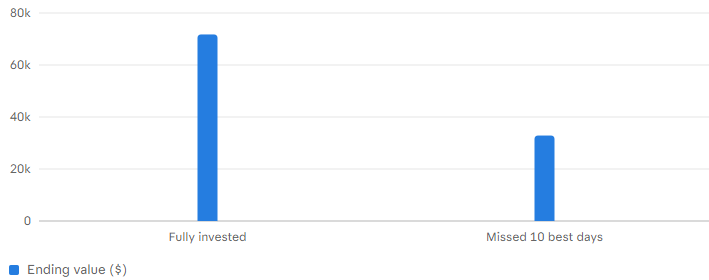
On J.P. Morgan's 2005-2024 data, $10,000 grew to $71,750 fully invested but $32,871 without the 10 best days.
Do average investors really underperform?
Over the 20 years to 2024, DALBAR found 9.24% a year for the average equity investor against 10.35% for the S&P 500. In 2025 the gap narrowed to 0.72 points.
Isn't it just as good to avoid the worst days?
Yes, if you could do it, but best and worst days cluster together, so avoiding the worst usually means missing some of the best too.
Is it ever sensible to change my investments?
Yes, when your goals, timeline or risk tolerance change, or to rebalance. That is planning, not timing.
Table of Contents
1. The quick answer2. What "timing the market" really means
3. Reason 1: You have to be right twice
4. Reason 2: A few days drive much of the return
5. Reason 3: The best days hide inside the worst
6. Reason 4: Real investors tend to lag
7. Reason 5: Costs, taxes and constant stress
8. The honest caveats
9. This month's whipsaw
10. What to do instead
11. A simple plan
12. When changing course is not market timing
13. Bull case versus bear case
14. What to watch next
15. Conclusion
16. FAQ
DALBAR: S&P 500 vs average equity investor
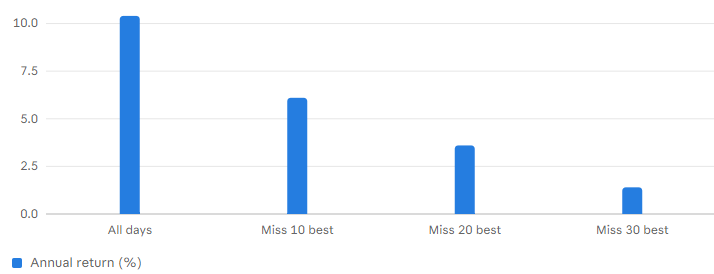
Annualised return by best days missed, 2005-2024
% a year by Source: Greenline (J.P. Morgan); fully invested figure is my calculation
$10,000 in the S&P 500, 2005-2024 (J.P. Morgan figures)
The quick answer
If you could sell just before every crash and buy back just before every recovery, you would be rich. The trouble is that almost nobody can do it, and the data suggests that even a few mistimed moves can cost a lot. One widely cited J.P. Morgan analysis found that $10,000 invested in the S&P 500 from 2005 to 2024 grew to $71,750, but only to $32,871 if you missed the 10 best days.This post gives five reasons not to try timing the market: you have to be right twice, a few days drive much of the return, the best days sit next to the worst, real investors tend to lag the funds they own, and the costs and stress add up. I also cover the honest caveats, because this subject is full of over-simplified charts. It is education, not advice, and it is based mostly on US data.
Key takeaway: You do not need to be wrong often for timing to hurt. Missing a handful of strong days, which tend to arrive in the middle of panics, can halve your long-term result.
What "timing the market" really means
Market timing means moving in and out of investments based on a prediction of what prices will do next. The most extreme version is selling everything when you fear a fall and buying back when things feel safe. A milder version is holding back cash and waiting for a better entry point. It is different from other sensible actions. Rebalancing to a target mix, adjusting when your goals change, or building a cash buffer are decisions about your own situation, not forecasts of the market. I come back to this in section 12.The central question is whether you can predict the market well enough to beat simply staying invested. The evidence below suggests that, for most people, the answer is no.
Reason 1: You have to be right twice
Timing involves two decisions, not one: when to get out and when to get back in. The odds of nailing both consistently are extremely low, as one personal-finance site puts it.Think about how hard each call is. To sell at a good moment you need to know that a fall is coming. To buy back at a good moment you need to know that the recovery has started, and the recovery usually begins when the news still looks bad. By the time the picture feels safe, prices have often already jumped. There is no shortcut here. Even if your first call is right, one wrong second call can wipe out the gain. That is the heart of the problem, and it explains why the next reasons matter so much.
Reason 2: A few days drive much of the return
The famous chart in this area comes from J.P. Morgan Asset Management. According to its data, a $10,000 investment in the S&P 500 on 1 January 2005, left untouched through 31 December 2024, grew to $71,750. Missing the 10 best days cut that to $32,871, more than half. Those two numbers imply annual returns of about 10.4% and 6.1% (my calculation from the figures above), which lines up with a second source quoting 6.1% for missing the best 10 days, 3.6% for missing the best 20 and 1.4% for the best 30. The same source says missing the best 60 days turns $10,000 into $4,712.A newer calculation from a Motley Fool author used a different 20-year window, 12 October 2006 to 12 October 2026, using the SPDR S&P 500 ETF with dividends reinvested. $10,000 grew to about $82,300, but only to about $35,700 without the 10 best days. Missing the best 20 left about $21,500, and missing the best 40 left about $9,900.
Notice the sources do not agree to the dollar. That is normal: the results depend on the start date, the index and whether dividends are included. What matters is that every version shows the same shape. The cost of missing even 10 days out of roughly 5,000 is enormous. For scale, a quick comparison: $38,879 less on the J.P. Morgan figures, or about 54% lower (my calculation). Ten days out of about 5,000 is 0.2% of the time.
Reason 3: The best days hide inside the worst
If the best days arrived at random, you might shrug. They do not. J.P. Morgan found that seven of the 10 best days over its 20-year window came within 15 days of one of the 10 worst days [1]. The Motley Fool analysis found the same: seven of its 10 best days fell within two weeks of one of its 10 worst. I give a vivid example: the S&P 500's best day in the period was followed two days later by a loss of 9.8%, which was one of its three worst days. Another source says March 2020 alone contained three of the 10 best days of the previous 20 years.A further study by Hartford Funds, reported by a secondary source, found that about 42% of the market's strongest days in a 20-year window happened during official bear markets, and another 36% in the first two months of a new bull market, before it was clear the bear market had ended [6]. By my calculation that leaves only about 22% of the best days outside those two situations. This is why selling after a sharp fall is so risky. The time you most want to be out is also when the strongest rebound days tend to appear. One source notes that sources differ here too: a more recent write-up says six of the 10, not seven. That one is a lower-quality aggregator, so I would lean on the J.P. Morgan figure.
Reason 4: Real investors tend to lag
The most common objection is fair: surely avoiding the worst days would be just as valuable? In fact it would be. Analyses of S&P 500 data from the early 1990s to 2025 found that missing the 10 worst days could lift annualised returns from roughly 10% into the mid-teens. The catch is that you would need to do it without missing the best days, and they come in the same stormy periods. Missing both the 10 best and 10 worst days often lands you almost exactly where buy-and-hold already was [12]. One analysis even finds that deleting both beat buy-and-hold by about 0.47 percentage points a year in the sample it used [5]. So the fair summary is that the benefit of perfect timing is real, but nobody has a reliable way to get it.Now to the evidence on real investors. DALBAR's annual study compares what the average fund investor earns with what the market returned. Over the 20 years to the end of 2024, the average equity investor earned 9.24% a year, against 10.35% for the S&P 500, a gap of more than a percentage point every year. Compounding makes that gap bigger than it sounds. Using those two rates on $10,000 over 20 years gives roughly $71,700 for the index and $58,600 for the average investor, about $13,100 or 18% less (my calculation).
In 2024 the gap was 8.48 percentage points: the average equity investor earned 16.54% against 25.02% for the S&P 500, the second-largest gap in a decade. In 2025 it narrowed sharply to 0.72 points, with the S&P 500 at 17.88% and the average equity investor at 17.16%.
That is worth saying plainly: the gap is not fixed. DALBAR itself describes it as a fund-flow-based measure, and one commentator notes that it does not prove every individual investor lost exactly that amount [8]. Another measure, Morningstar's, found fund investors earned about 7.0% a year versus 8.2% for the funds over the ten years to 2024, a gap of 1.2 points.
Longer-run figures differ by source, which is a warning in itself: one tracker quotes 7.1% a year for the average equity-fund investor versus 10.7% for the S&P 500 over the 30 years to 2021, while other write-ups I saw give noticeably lower investor figures. I would not rely on any single 30-year number. What is consistent is the direction: the average investor lags, and behaviour is the usual explanation.
Reason 5: Costs, taxes and constant stress
Costs and taxes are the quiet fifth reason. Frequent trading means dealing fees, spreads and, in a taxable account, realised gains. One writer notes that short-term trades may lead to higher capital gains taxes. Here in the UK, selling investments held outside an ISA or pension can create a taxable gain. For 2026/27 the annual exempt amount is £3,000 and the rates are 18% and 24%. So a panicked sale of a holding with a large gain could cost real money in tax, on top of any price you lose by being out of the market. Inside an ISA or pension, you would not pay CGT, but you still face the timing risk in reasons 1 to 4. There is a stress cost too. Trying to time means you have to keep checking. One source describes it as a "never-ending vortex" of decisions about every headline. That drain on your attention is a real cost, even though it does not appear on a statement.The honest caveats
I want to be fair about the limits of this evidence. First, these charts are arithmetic, not forecasts. They show what happened in particular windows. A different start date, or a different market, gives different numbers. The J.P. Morgan and Motley Fool versions differ by about $10,000 on the starting figure alone. Second, the missing-best-days chart is one half of a pair. As the Summitward analysis puts it, the chart is arithmetic and it is one row of a four-row table; avoiding the worst days helps even more than missing the best days hurts. I covered that above. Third, valuation and the economy matter. Nothing here says that stocks cannot fall for years, or that every drop recovers quickly. Some investors reasonably adjust their mix because their goals or timeline have changed. That is not the same as predicting the market.Fourth, DALBAR's 2025 result shows investors can do better than the headlines suggest. A gap of 0.72 points was the third smallest since 1985 and the smallest since 2012.
This month's whipsaw
The past fortnight is a live example. One report says the S&P 500 rose 1.6% the day after the midterm elections, then fell 4.4% the next day, the worst single day since April 2025, with the VIX volatility index at 28. I am quoting the one-day moves from a lower-quality aggregator, so please check them against a reliable price source. But the point does not depend on the exact figures. In a week like that, a seller could easily have missed the next rebound, and a buyer waiting for "clarity" could have paid more. If you did sell during the drop, the question to ask is not "was I right?" but "what is my plan to get back in?" because that second decision is where timing usually goes wrong.What to do instead
Fortunately there are simple alternatives that do not need a crystal ball. Invest regularly. One article cites a Schwab Center for Financial Research study concluding that you are better off putting in a fixed amount every month, whatever the market looks like, than trying to pick moments. I could not read the study itself, so treat that as a pointer, not proof. Choose a mix you can hold. The aim is a portfolio you will not abandon in a panic, which usually means matching risk to your timeline and temperament. Keep a buffer. A cash reserve for emergencies and near-term spending means you are less likely to have to sell investments at a bad moment. Rebalance by rule. Selling a bit of what has grown and buying what has lagged, on a set schedule, forces a modest "buy low, sell high" discipline without predictions. Use tax wrappers where they fit. In the UK, ISAs and pensions can shelter growth from CGT, which also removes one reason to fiddle with holdings. I have not covered the contribution limits here, so check the current ones.A simple plan
Here is a plain sequence, which I offer as a framework, not advice.- Write down your goal and timeline in a sentence.
- Decide how much of your money you could leave alone for at least five years.
- Hold an emergency fund separately.
- Pick a diversified, low-cost mix and a monthly amount.
- Automate the contributions.
- Set a rebalancing date once or twice a year.
- Write down what would make you change the plan, such as a new job, a house purchase or retirement, and agree that market headlines are not on the list.
- Review once a year, not once a day.
When changing course is not market timing
Not every change is timing. Moving money out of shares because you will need it for a house deposit in two years is a goal-based decision, and is sensible. Increasing your cash after a redundancy is risk management. Rebalancing a portfolio that has drifted is housekeeping. The difference is the reason. If the reason is "I think the market will fall," that is timing. If the reason is "my situation has changed," that is planning.Bull case versus bear case
The bull case for staying invested: the cost of missing a few days is huge, the best days cluster in crises, average investors lag, and a rule-based plan removes a stressful decision.The bear case: past patterns may not repeat, a long bear market can last years, and some people really do sleep better with a larger cash holding. A plan that you will actually stick to is better than a perfect plan you will abandon. Both points hold at once. The argument is not that markets never fall. It is that predicting when is far harder than it looks.
If you invest, a few things are worth watching: your own savings rate and contributions, which matter more than any single year; your mix compared with your target; and the next DALBAR update, which will show whether last year's narrow gap was a one-off. For the UK, remember the 5 April tax-year end if you plan to use ISA or CGT allowances.
Conclusion
Timing the market is attractive because it feels like control. But you have to be right twice, a few days drive a large share of returns, the best days sit beside the worst, real investors tend to lag, and costs and stress add up. On the J.P. Morgan figures, missing just 10 days out of about 5,000 cut a $10,000 investment from $71,750 to $32,871.That does not mean you should never change your portfolio. It means you should make changes for reasons about your life, not about guessing tomorrow's headline. Build a plan you can hold, invest regularly and let time do the heavy lifting. This post is education only, not advice.
FAQ
What does "time in the market beats timing the market" mean?Staying invested for a long period has usually done better than trying to jump in and out based on predictions. The data above shows how costly missing a few strong days can be.
What happens if you miss the best days?
On J.P. Morgan's 2005-2024 data, $10,000 grew to $71,750 fully invested but $32,871 without the 10 best days.
Do average investors really underperform?
Over the 20 years to 2024, DALBAR found 9.24% a year for the average equity investor against 10.35% for the S&P 500. In 2025 the gap narrowed to 0.72 points.
Isn't it just as good to avoid the worst days?
Yes, if you could do it, but best and worst days cluster together, so avoiding the worst usually means missing some of the best too.
Is it ever sensible to change my investments?
Yes, when your goals, timeline or risk tolerance change, or to rebalance. That is planning, not timing.
0 Comments
Be the first to share your thoughts on this article.